 Explore
 Validate
 Learn
Learn Western blot
 Immunocytochemistry
Antibody data
- Antibody Data
- Antigen structure
- References [4]
- Comments [0]
- Validations
- Immunocytochemistry [1]
- Immunohistochemistry [4]
- Other assay [4]
Submit
Validation data
Reference
Comment
Report error
- Product number
- PA5-22257 - Provider product page

- Provider
- Invitrogen Antibodies
- Product name
- VCP Polyclonal Antibody
- Antibody type
- Polyclonal
- Antigen
- Recombinant full-length protein
- Description
- Recommended positive controls: 293T, A431, H1299, HeLa, HepG2, Molt-4, Raji, mouse brain, rat brain. Predicted reactivity: Mouse (100%), Rat (100%), Zebrafish (97%), Xenopus laevis (98%), Pig (99%), Chicken (99%), Chimpanzee (99%), Bovine (99%). Store product as a concentrated solution. Centrifuge briefly prior to opening the vial.
- Reactivity
- Human, Mouse, Rat, Canine
- Host
- Rabbit
- Isotype
- IgG
- Vial size
- 100 μL
- Concentration
- 0.3 mg/mL
- Storage
- Store at 4°C short term. For long term storage, store at -20°C, avoiding freeze/thaw cycles.
Submitted references Urea Cycle Dysregulation Generates Clinically Relevant Genomic and Biochemical Signatures.
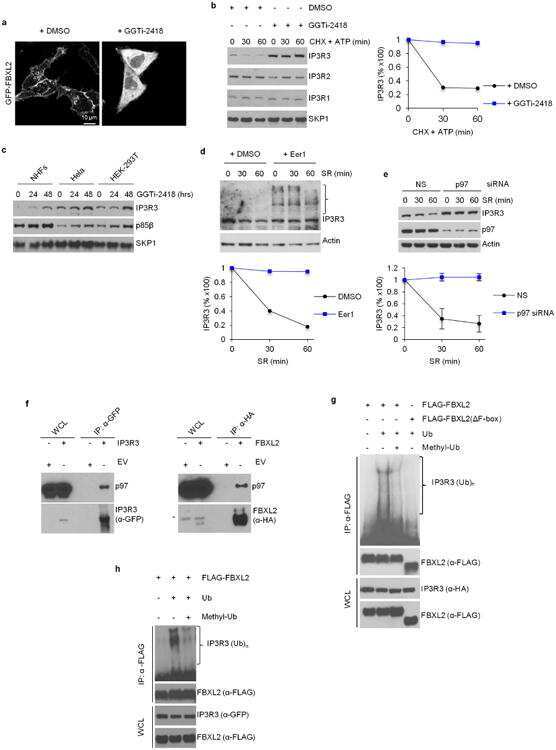
PTEN counteracts FBXL2 to promote IP3R3- and Ca(2+)-mediated apoptosis limiting tumour growth.
Human genome-wide RNAi screen reveals host factors required for enterovirus 71 replication.
Diversion of aspartate in ASS1-deficient tumours fosters de novo pyrimidine synthesis.
Lee JS, Adler L, Karathia H, Carmel N, Rabinovich S, Auslander N, Keshet R, Stettner N, Silberman A, Agemy L, Helbling D, Eilam R, Sun Q, Brandis A, Malitsky S, Itkin M, Weiss H, Pinto S, Kalaora S, Levy R, Barnea E, Admon A, Dimmock D, Stern-Ginossar N, Scherz A, Nagamani SCS, Unda M, Wilson DM 3rd, Elhasid R, Carracedo A, Samuels Y, Hannenhalli S, Ruppin E, Erez A
Cell 2018 Sep 6;174(6):1559-1570.e22
Cell 2018 Sep 6;174(6):1559-1570.e22
PTEN counteracts FBXL2 to promote IP3R3- and Ca(2+)-mediated apoptosis limiting tumour growth.
Kuchay S, Giorgi C, Simoneschi D, Pagan J, Missiroli S, Saraf A, Florens L, Washburn MP, Collazo-Lorduy A, Castillo-Martin M, Cordon-Cardo C, Sebti SM, Pinton P, Pagano M
Nature 2017 Jun 22;546(7659):554-558
Nature 2017 Jun 22;546(7659):554-558
Human genome-wide RNAi screen reveals host factors required for enterovirus 71 replication.
Wu KX, Phuektes P, Kumar P, Goh GY, Moreau D, Chow VT, Bard F, Chu JJ
Nature communications 2016 Oct 17;7:13150
Nature communications 2016 Oct 17;7:13150
Diversion of aspartate in ASS1-deficient tumours fosters de novo pyrimidine synthesis.
Rabinovich S, Adler L, Yizhak K, Sarver A, Silberman A, Agron S, Stettner N, Sun Q, Brandis A, Helbling D, Korman S, Itzkovitz S, Dimmock D, Ulitsky I, Nagamani SC, Ruppin E, Erez A
Nature 2015 Nov 19;527(7578):379-383
Nature 2015 Nov 19;527(7578):379-383
No comments: Submit comment
Supportive validation
- Submitted by
- Invitrogen Antibodies (provider)
- Main image
- Experimental details
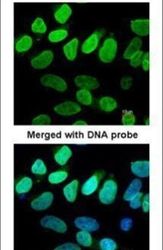
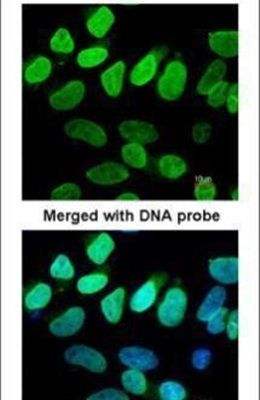
- Immunofluorescent analysis of VCP (p97) in paraformaldehyde-fixed HeLa cells using a VCP (p97) polyclonal antibody (Product # PA5-22257) at a 1:200 dilution.
Supportive validation
- Submitted by
- Invitrogen Antibodies (provider)
- Main image
- Experimental details
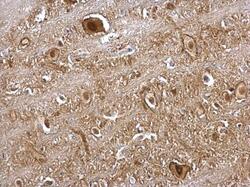
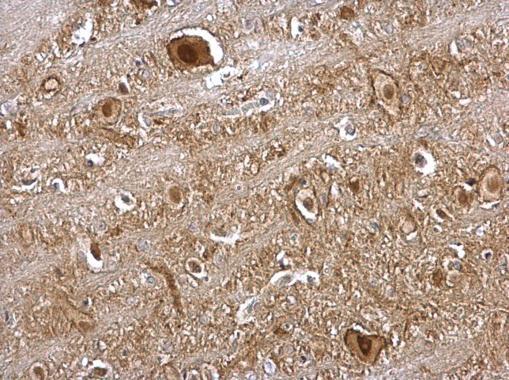
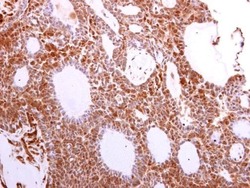
- VCP Polyclonal Antibody detects VCP protein at nucleus and cytosol on rat brain stem by immunohistochemical analysis. Sample: Paraffin-embedded rat brain stem. VCP Polyclonal Antibody (Product # PA5-22257) dilution: 1:500. Antigen Retrieval: EDTA based buffer, pH 8.0, 15 min.
- Submitted by
- Invitrogen Antibodies (provider)
- Main image
- Experimental details
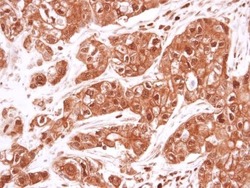
- Immunohistochemical analysis of paraffin-embedded Ca922 xenograft, using VCP (p97) (Product # PA5-22257) antibody at 1:500 dilution. Antigen Retrieval: EDTA based buffer, pH 8.0, 15 min.
- Submitted by
- Invitrogen Antibodies (provider)
- Main image
- Experimental details
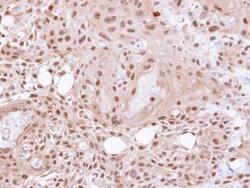
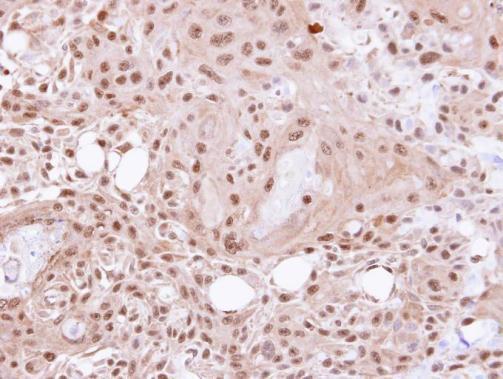
- Immunohistochemistry (Paraffin) analysis of VCP was performed in paraffin-embedded human lung adenocarcinoma tissue using VCP Polyclonal Antibody (Product # PA5-22257) at a dilution of 1:500.

- Submitted by
- Invitrogen Antibodies (provider)
- Main image
- Experimental details
- Immunohistochemistry (Paraffin) analysis of VCP was performed in paraffin-embedded human lung adenocarcinoma tissue using VCP Polyclonal Antibody (Product # PA5-22257) at a dilution of 1:500.

Supportive validation
- Submitted by
- Invitrogen Antibodies (provider)
- Main image
- Experimental details
- NULL
- Submitted by
- Invitrogen Antibodies (provider)
- Main image
- Experimental details
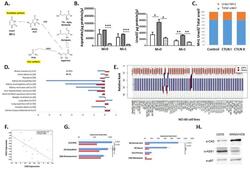
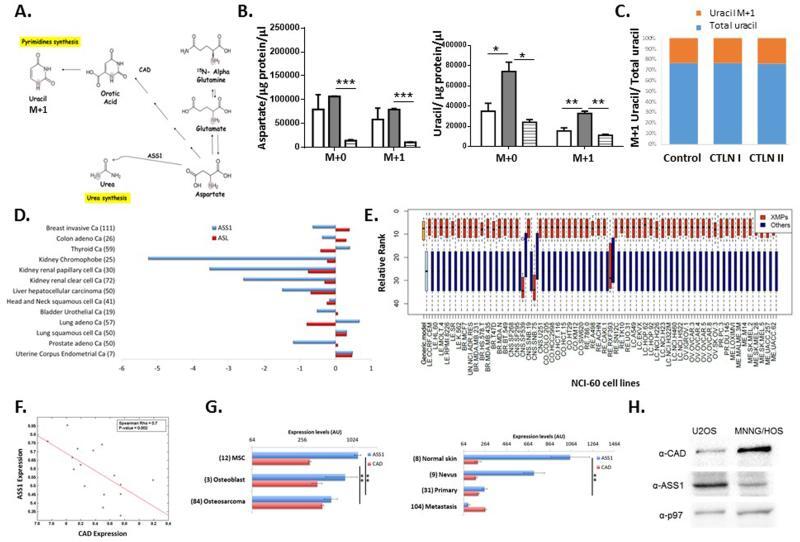
- Extended data Figure 1 : ASS1 deficiency correlates with aspartate utilization by CAD in cancerous and non-cancerous cells ( A ) Schematic flux tracing of the Alpha labeled nitrogen of glutamine ( 15 N-alpha-Glutamine) to nucleic acid synthesis via aspartate. ( B ) The ratio between M+1 labeled/ total level of uracil in fibroblasts is similar between citrullinemia patients and control, n>=3. Error bars represent SER. ( C ) Labeled levels of M+1 aspartate (left) and M+1 uracil (Right) synthesized from 15 N-alpha-labeled glutamine, are higher in fibroblasts from CTLN I as compared to fibroblasts from controls and CTLNII patients, n>=3. ( D ) TCGA analysis of tumor-normal paired tissues for gene expression comparison shows the expression levels of ASL and ASS1 in different cancers. ( E ) A graph plot generated from the modelling data for the production capacity of metabolites following ASS1 inactivation in each of the NCI-60 cell lines as well as in the generic model. The reddish bars represent the ranking of nucleic acids while the blueish bars represent the ranking of all other metabolites. ( F ) Correlation analysis of NCI-60 cell lines shows a significant inverse correlation between ASS1 and CAD expression levels. ( G ) Osteosarcoma ( Upper panel ) and melanoma ( Lower panel ) microarray data was obtained from the NCBI EO database (accessions GSE33383 and GSE46517, respectively). Raw expression levels were plotted and significance was computed using t-test on log2-transforme
- Submitted by
- Invitrogen Antibodies (provider)
- Main image

- Experimental details
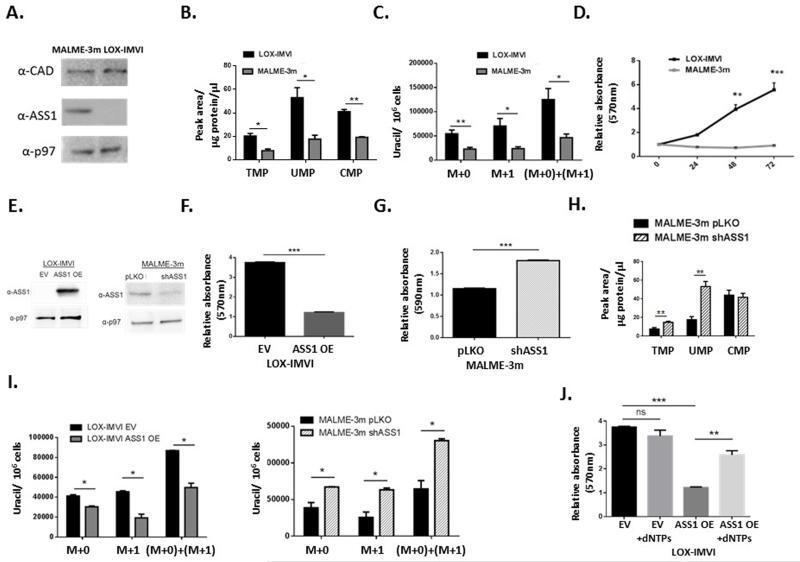
- Extended data Figure 2 : ASS1 inactivation in melanoma correlates with increased proliferation ( A ) An immunoblot showing different expression levels of ASS1 and CAD in two different cancer cell lines of melanoma. ( B ) Melanoma cells with ASS1 downregulation have a significant increase in pyrimidine levels as measured by LC/MS, n>=3. ( C ) Melanoma cells with ASS1 downregulation have a significant increase in total Uracil, n=4. ( D ) Melanoma cells with ASS1 downregulation have a significant increase in proliferation as measured by MTT assay, n=2. ( E ) Immunoblots of melanoma cells for ASS1 levels following transduction with either ASS1 over expression construct or with shASS1. ( F ) Proliferation assays showing a significant decrease in proliferation following ASS1 overexpression in melanoma using MTT, n=3. ( G ) Crystal violet quantification for melanoma cells following transduction with sh ASS1 demonstrating increase in proliferation, n=3. ( H ) LC/MS measurements of pyrimidine levels showing a significant increase following the use of shASS1 in melanoma cells, n>=3. ( I ) Left panel - Total uracil levels are decreased significantly in melanoma cells with ASS1 over expression and increased in melanoma cells with shASS1 - Right panel , n>=2. ( J ) Significant increase in proliferation of melanoma cells by dNTP's after ASS1 overexpression, n=3. In all panels, error bars represent SER.
- Submitted by
- Invitrogen Antibodies (provider)
- Main image
- Experimental details
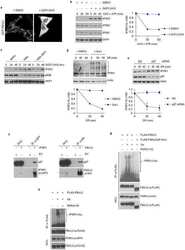
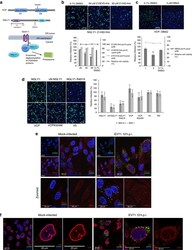
- Figure 4 NGLY1 and VCP functions are required for EV71 infection. ( a ) Functional domains of NGLY1 and VCP and their relative interactions at the ER membrane. ( b , c ) Specific inhibition of NGLY1 and VCP inhibits EV71 replication. Bars represent mean relative infection rates from three-independent experiments, normalized against 0.1% DMSO controls. Error bars show standard deviations. ( d ) EV71 infection in cells stably overexpressing NGLY1, DeltaN NGLY1, NGLY1 R401X, VCP or VCPK524M. Bars show average relative infection rates measured against V5 (empty vector) expressing cell line and error bars represent standard deviation. Data are from two-independent experiments. ( e ) Immunofluorescence tracking of NGLY1 or ( f ) VCP in mock-infected RD cells and EV71-infected RD cells at 12 h.p.i.. Red signal indicates ( e ) NGLY1 or ( f ) VCP, green for dsRNA and blue for nuclei. Two-tailed, Student's T -test was performed against controls, * P
