 Explore
 Validate
 Learn
Learn Western blot
 Immunocytochemistry
Antibody data
- Antibody Data
- Antigen structure
- References [3]
- Comments [0]
- Validations
- Immunocytochemistry [2]
- Other assay [5]
Submit
Validation data
Reference
Comment
Report error
- Product number
- PA5-65443 - Provider product page

- Provider
- Invitrogen Antibodies
- Product name
- RETSAT Polyclonal Antibody
- Antibody type
- Polyclonal
- Antigen
- Recombinant protein fragment
- Description
- Immunogen sequence: SSPNPFSEDVK RPPAPLVTDK EARKKVLKQA FSANQVPEKL DVVVIGSGFG GLAAAAILAK AGKRVLVLEQ HTKAGGCCHT FGKNGLEFDT GIHYIGRMEE GSIGRFILDQ ITEGQLDWAP LSSPFDIMVL EGPNGRKEYP M Highest antigen sequence identity to the following orthologs - mouse 88%, rat 89%.
- Reactivity
- Human
- Host
- Rabbit
- Isotype
- IgG
- Vial size
- 100 μL
- Concentration
- 0.40 mg/mL
- Storage
- Store at 4°C short term. For long term storage, store at -20°C, avoiding freeze/thaw cycles.
Submitted references RETSAT associates with DDX39B to promote fork restarting and resistance to gemcitabine based chemotherapy in pancreatic ductal adenocarcinoma.
Dual genome-wide CRISPR knockout and CRISPR activation screens identify mechanisms that regulate the resistance to multiple ATR inhibitors.
A Genome-Wide CRISPR/Cas9 Screen Reveals that Riboflavin Regulates Hydrogen Peroxide Entry into HAP1 Cells.
Tu Q, Liu X, Yao X, Li R, Liu G, Jiang H, Li K, Chen Q, Huang X, Chang Q, Xu G, Zhu H, Shi P, Zhao B
Journal of experimental & clinical cancer research : CR 2022 Sep 15;41(1):274
Journal of experimental & clinical cancer research : CR 2022 Sep 15;41(1):274
Dual genome-wide CRISPR knockout and CRISPR activation screens identify mechanisms that regulate the resistance to multiple ATR inhibitors.
Schleicher EM, Dhoonmoon A, Jackson LM, Clements KE, Stump CL, Nicolae CM, Moldovan GL
PLoS genetics 2020 Nov;16(11):e1009176
PLoS genetics 2020 Nov;16(11):e1009176
A Genome-Wide CRISPR/Cas9 Screen Reveals that Riboflavin Regulates Hydrogen Peroxide Entry into HAP1 Cells.
Chidawanyika T, Mark KMK, Supattapone S
mBio 2020 Aug 11;11(4)
mBio 2020 Aug 11;11(4)
No comments: Submit comment
Supportive validation
- Submitted by
- Invitrogen Antibodies (provider)
- Main image

- Experimental details
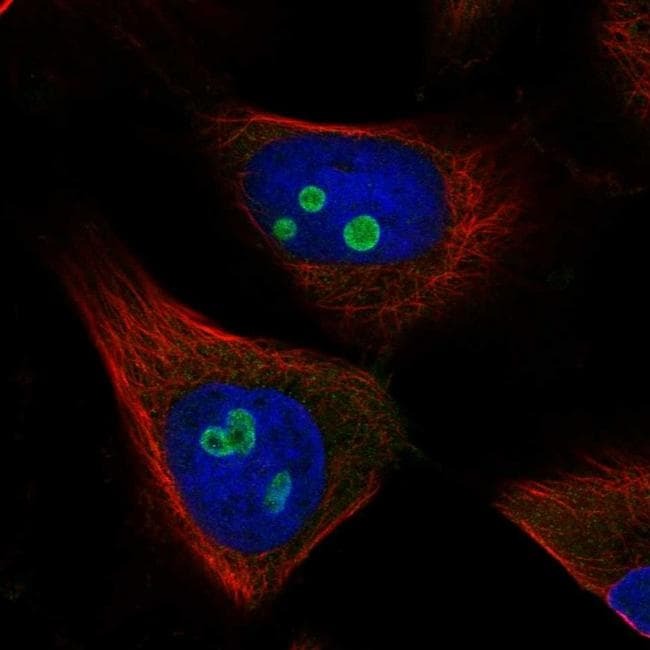
- Immunofluorescent staining of RETSAT in human cell line U-251 MG shows localization to nucleoli. Samples were probed using a RETSAT Polyclonal Antibody (Product # PA5-65443).
- Submitted by
- Invitrogen Antibodies (provider)
- Main image

- Experimental details
- Immunofluorescent staining of RETSAT in human cell line U-251 MG shows localization to nucleoli. Samples were probed using a RETSAT Polyclonal Antibody (Product # PA5-65443).

Supportive validation
- Submitted by
- Invitrogen Antibodies (provider)
- Main image

- Experimental details
- NULL
- Submitted by
- Invitrogen Antibodies (provider)
- Main image
- Experimental details
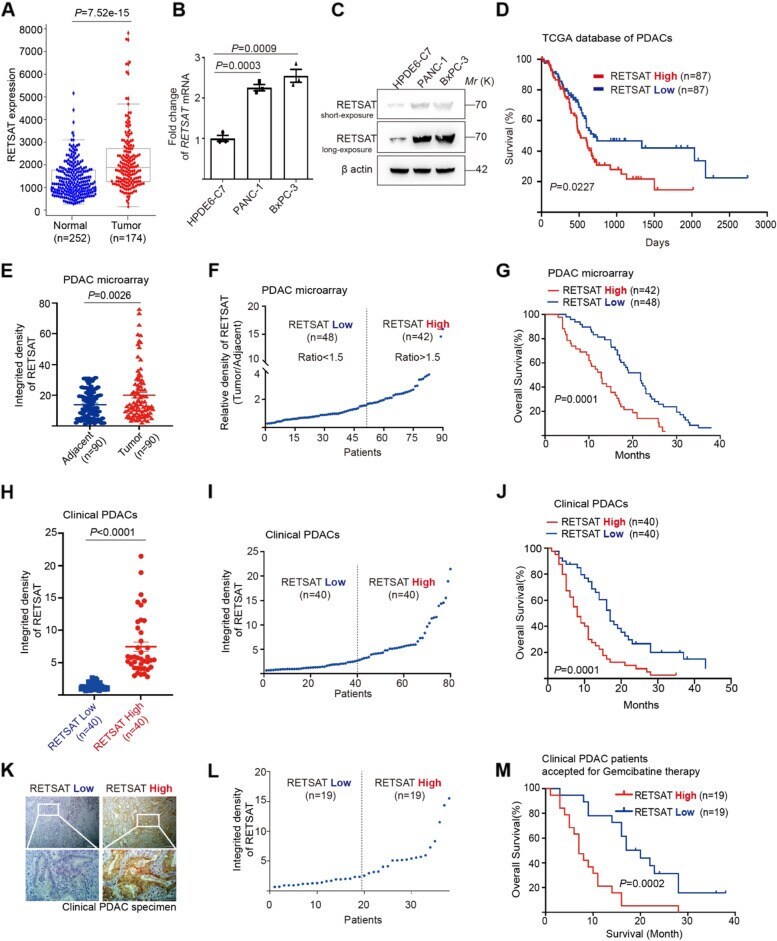
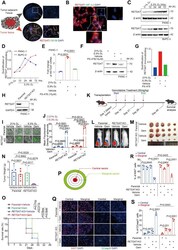
- High expression of RETSAT correlated to poor survival in PDAC patients. A The expression of RETSAT in PDAC tumor tissues ( n = 174) from The Cancer Genome Atlas database compare to normal tissues from The Cancer Genome Atlas database and GTEx database ( n = 252). B,C qPCR ( B ) and immunoblotting analysis ( C ) of RETSAT in human pancreatic duct epithelial (HPDE) cell line HPDE6-C7, pancreatic cancer cell lines PANC-1 and BxPC-3, the exposure time was 0.2 s (short exposure) and 1 s (long exposure) respectively in ( C ). D Kaplan-Meier curve for overall survival of PDAC patients ( n = 174) with low vs high expression of RETSAT. The data was downloaded from TCGA dataset and re-analyzed. E Quantification of IHC integrated density of RETSAT in PDAC tissue microarray using image J software. Ninety adjacent tissues and corresponding tumor tissues were calculated. F Classification of PDAC microarray tissues into RETSAT high ( n = 42) and low ( n = 48) subgroups based on the ratio of RETSAT integrated density in tumor tissues versus own adjacent tissues. Tissues with ratio greater than 1.5 were defined as RETSAT-high, while lower than 1.5 were defined as RETSAT-low. G Overall survival time (months) of RETSAT-high and RETSAT-low subgroups based on microarray information. The figure shows the Kaplan-Meier survival curves. H, I Quantification of IHC integrated density of RETSAT in PDAC clinical tissues using image J software ( H ), 80 tumor tissues were calculated and divided into RETSA
- Submitted by
- Invitrogen Antibodies (provider)
- Main image
- Experimental details
- Fig. 2 RETSAT deletion sensitized PDAC cells to gemcitabine induced apoptosis. A Representative images of fluorescent Co-immunohistochemistry staining of RETSAT(red) and ductal cell marker CK19 (green) in PDAC tissue microarray. B Co-immunohistofluorescence of RETSAT (red) and HIF-1alpha (green) in PDAC tissue. C, D Immunoblotting ( C ) and quantification ( D ) of RETSAT in PDAC cell lines PANC-1 and BxPC-3. Cells were cultured under normoxia (21% O 2 ) or hypoxia (0.3% O 2 ) for 12, 24, 48, 72 hours respectively. beta actin was used as a loading control. E qPCR analysis of RETSAT transcription under indicated treatments. HIF-1alpha antagonist PX-478(10 muM) was used. F, G Immunoblotting ( F ) and quantification ( G ) of RETSAT in PANC-1 cells under indicated treatments. H Immunoblotting confirmation of RETSAT deletion in luciferase positive PANC-1 cells. I, J Representative images ( I ) and quantification ( J ) of apoptosis using green-fluorescent caspase 3/7 probe labeling in 3D cultured PANC-1 spheroids with or without RETSAT under indicated treatments. K Experimental setup and treatment schedule of CDX assay. Tumor sizes were detected by IVIS system at day 7 post transplantation, and starting Gemcitabine treatment at dose of 50 mg/kg weekly and ending at day 28, the mice were monitored until day 49. L Representative images of bioluminescence signals in mice bearing with PANC-1 cell derived xenografts. M, N Image of cell derived xenografts ( M ) and weight quantification (

- Submitted by
- Invitrogen Antibodies (provider)
- Main image
- Experimental details
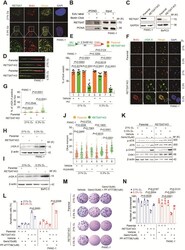
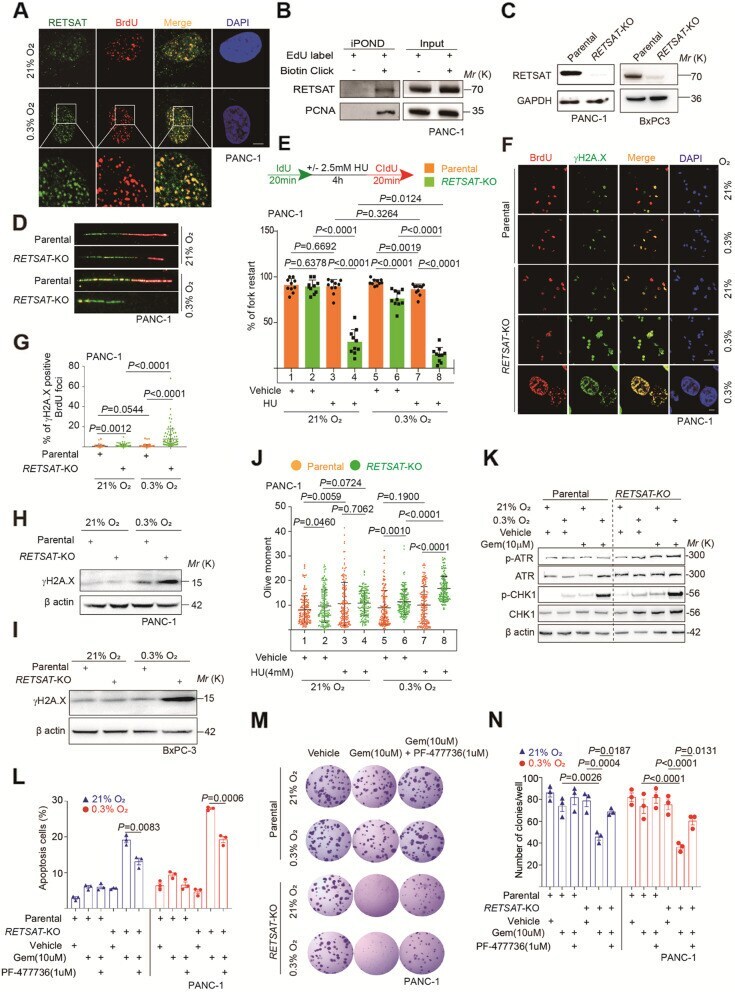
- Fig. 3 RETSAT promotes fork restarting under replication stress. A Co-immunostaining of RETSAT (green) and BrdU pulse labeled replication foci (red) in PANC-1 cells cultured under normoxia (21% O 2 ) or hypoxia (0.3% O 2 ). B iPOND assay to validate location of RETSAT on replication forks. PCNA was included as a positive control. C Immunoblotting of RETSAT in PANC-1 and BxPC-3 infected with or without RETSAT CRISPR gRNA lentivirus. beta actin was used as a loading control. D, E Representative images ( D ) and quantification ( E ) of fork restarting in parental or RETSAT -KO PANC-1 cells under indicated treatments. 2.5 mM Hydroxyurea (HU) was used to induce replication stress. At least 200 single forks were calculated in each sample. F, G Representative images ( F ) and quantification ( G ) of replication fork damage in PANC-1 parental and RETSAT -KO cells under indicated treatments. Pulse labeled BrdU foci was indicating DNA replication sites. gammaH2A.X was used to indicate DNA damage. H, I Immunoblotting of gammaH2A.X in parental and RETSAT -KO PANC-1 ( H ) and BxPC-3 ( I ) under indicated treatments. beta actin was used as a loading control. J Quantification of neutral comet assay in parental and RETSAT -KO PANC-1 cells under indicated treatments. At least 150 single comets were calculated in each sample. K Immunoblotting of ATR, p-ATR (Ser428), CHK1, p-CHK1 (Ser345) andbeta actin in parental and RETSAT -KO PANC-1 cells under indicated treatments. L Flow cytometry based An
- Submitted by
- Invitrogen Antibodies (provider)
- Main image
- Experimental details
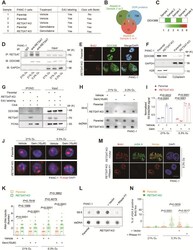
- Fig. 4 RETSAT recruits DDX39B onto replication forks to resolve R-loop. A Treatment and sample collections used for iPOND combined with LC-MS/MS detection. B Overlapping analysis between absent proteins in RETSAT -KO groups and DNA damage response protein dataset. C Heatmap of DDX39B based on its abundance in LC-MS/MS results. D Co-immunoprecipitation using anti-RETSAT antibody combined with immunoblotting to confirm the interaction of RETSAT and DDX39B in PANC-1 cells under indicated treatments. GAPDH was included as a negative control. E Co-immunostaining of DDX39B (green) and pulse labeled BrdU (red) in parental and RETSAT -KO PANC-1 cells. F Immunoblotting of DDX39B in nuclear and cytoplasmic extractions of PANC-1 cells with or without RETSAT. GAPDH and H2B were used as a cytoplasmic and nuclear loading control respectively. G iPOND combined with immunoblotting to examine DDX39B loading dosage on replication forks in parental and RETSAT -KO PANC-1 cells. H, I Representative images ( H ) and quantification ( I ) of R-loop dot blotting using S9.6 antibody in parental and RETSAT -KO PANC-1 cells under indicated treatments. Anti-dsDNA antibody was used as a loading control. J, K Representative images ( J ) and quantification ( K ) of R-loop accumulation in parental and RETSAT -KO PANC-1 cells under indicated treatments. L Dot Blotting of R-loops using S9.6 antibody in parental and RETSAT -KO PANC-1 cells with or without RNase H1 ectopic expression. Anti-dsDNA antibody was use
