Explore
 Validate
 Learn
Learn Immunohistochemistry
Antibody data
- Antibody Data
- Antigen structure
- References [1]
- Comments [0]
- Validations
- Immunohistochemistry [1]
- Other assay [1]
Submit
Validation data
Reference
Comment
Report error
- Product number
- PA5-61979 - Provider product page

- Provider
- Invitrogen Antibodies
- Product name
- Naked2 Polyclonal Antibody
- Antibody type
- Polyclonal
- Antigen
- Recombinant protein fragment
- Description
- Immunogen sequence: GHKRYRQKGR EGHSPLKAPH AQPATVEHEV VRDLPPTPAG EGYAVPVIQR HE Highest antigen sequence identity to the following orthologs: Mouse - 75%, Rat - 77%.
- Reactivity
- Human
- Host
- Rabbit
- Isotype
- IgG
- Vial size
- 100 μL
- Concentration
- 1.0 mg/mL
- Storage
- Store at 4°C short term. For long term storage, store at -20°C, avoiding freeze/thaw cycles.
Submitted references Decoding myofibroblast origins in human kidney fibrosis.
Kuppe C, Ibrahim MM, Kranz J, Zhang X, Ziegler S, Perales-Patón J, Jansen J, Reimer KC, Smith JR, Dobie R, Wilson-Kanamori JR, Halder M, Xu Y, Kabgani N, Kaesler N, Klaus M, Gernhold L, Puelles VG, Huber TB, Boor P, Menzel S, Hoogenboezem RM, Bindels EMJ, Steffens J, Floege J, Schneider RK, Saez-Rodriguez J, Henderson NC, Kramann R
Nature 2021 Jan;589(7841):281-286
Nature 2021 Jan;589(7841):281-286
No comments: Submit comment
Supportive validation
- Submitted by
- Invitrogen Antibodies (provider)
- Main image
- Experimental details
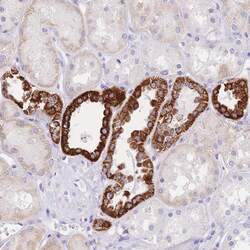
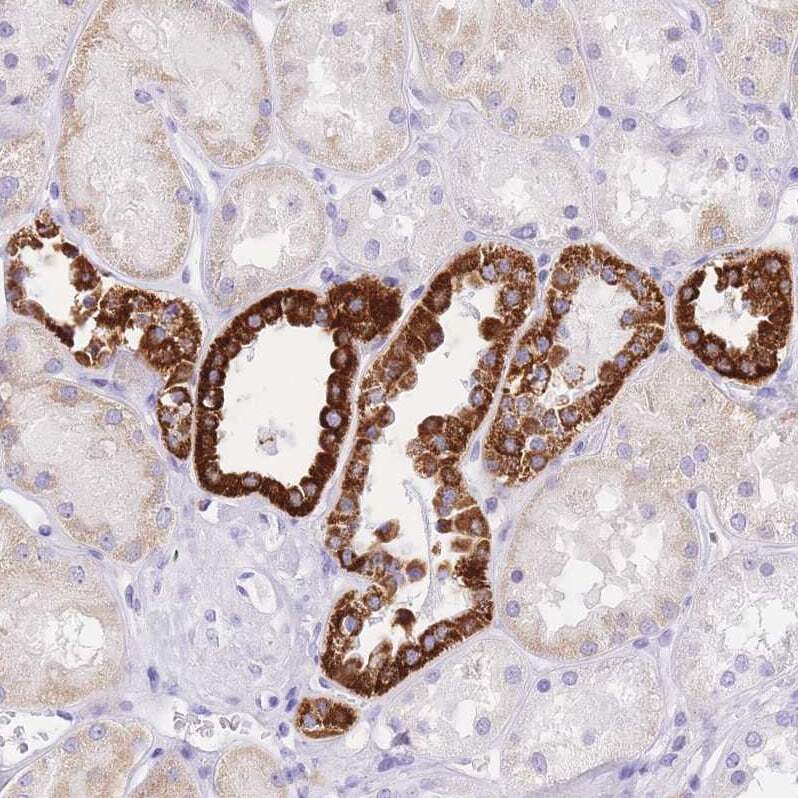
- Immunohistochemical analysis of Naked2 in human kidney using Naked2 Polyclonal Antibody (Product # PA5-61979) shows moderate cytoplasmic positivity in subset of cells in tubules.
Supportive validation
- Submitted by
- Invitrogen Antibodies (provider)
- Main image
- Experimental details
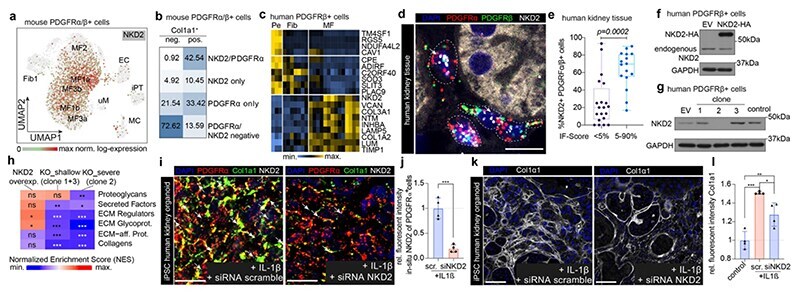
- Figure 4 Nkd2 as therapeutic target. a . Expression of Nkd2 visualized on the UMAP embedding from Figure 3j . b . Percent of Col1a1+/- cells in mouse Pdgfra+/Pdgfrb+ cells ( Figure 3j , stratified by Pdgfra and Nkd2 expression). c . Scaled gene expression of Nkd2 correlating or anti-correlating genes in human Pdgfrb+ cells ( Figure 2 ). d.-e . RNA in-situ hybridization (ISH) of PDGFRa, PDGFRb and NKD2 in human kidneys and quantification of triple positive cells (n=36, Patient data in Extended Data Table 2). n=20 and 16. Two-tailed Mann-Whitney test. Tukey box whisker plot. IF-score = interstitial fibrosis score. Scale bar 10mum. f.-g . Representative Western blots of Nkd2 overexpression and KO cells. For gel source data, see Extended Data Fig. 10e . h . GSEA (Gene set enrichment analysis) of ECM genes in Nkd2-perturbed PDGFRb - kidney cells. n=3 each. * P < 0.05, **p< 0.01, and ***p < 0.001 as determined by FGSEA-multilevel method after adjusting p-values for multiple testing correction (Benjamini & Hochberg). i . ISH of Pdgfra, Pdgfrb and Nkd2 in human iPSC derived kidney organoids. j . Quantification of Nkd2 RNA expression in organoids. n=4 each. Two-tailed unpaired t-test. k.-l . Immunofluorescence staining and quantification of Col1a1 in organoids. n=4 each. * P < 0.05, **p< 0.01, and ***p < 0.001 by 1-way ANOVA followed by Bonferroni's correction. Scale bar in i+k 50 mum. Data shown as mean+-SD. For details on statistics and reproducibility, please see Methods .