Explore
 Validate
 Learn
Learn Western blot
Antibody data
- Antibody Data
- Antigen structure
- References [3]
- Comments [0]
- Validations
- Western blot [1]
- Immunohistochemistry [1]
- Other assay [11]
Submit
Validation data
Reference
Comment
Report error
- Product number
- PA5-31163 - Provider product page

- Provider
- Invitrogen Antibodies
- Product name
- GABRA5 Polyclonal Antibody
- Antibody type
- Polyclonal
- Antigen
- Recombinant full-length protein
- Description
- Recommended positive controls: GABRA5-transfected 293T. Predicted reactivity: Mouse (100%), Rat (100%), Bovine (98%). Store product as a concentrated solution. Centrifuge briefly prior to opening the vial.
- Reactivity
- Human, Mouse
- Host
- Rabbit
- Isotype
- IgG
- Vial size
- 100 μL
- Concentration
- 0.21 mg/mL
- Storage
- Store at 4°C short term. For long term storage, store at -20°C, avoiding freeze/thaw cycles.
Submitted references Amyloid-Beta(1-42) -Induced Increase in GABAergic Tonic Conductance in Mouse Hippocampal CA1 Pyramidal Cells.
GABA(A) Receptors Are Well Preserved in the Hippocampus of Aged Mice.
Sex- and age-related changes in GABA signaling components in the human cortex.
Calvo-Flores Guzmán B, Kim S, Chawdhary B, Peppercorn K, Tate WP, Waldvogel HJ, Faull RL, Montgomery J, Kwakowsky A
Molecules (Basel, Switzerland) 2020 Feb 6;25(3)
Molecules (Basel, Switzerland) 2020 Feb 6;25(3)
GABA(A) Receptors Are Well Preserved in the Hippocampus of Aged Mice.
Palpagama TH, Sagniez M, Kim S, Waldvogel HJ, Faull RL, Kwakowsky A
eNeuro 2019 Jul Aug;6(4)
eNeuro 2019 Jul Aug;6(4)
Sex- and age-related changes in GABA signaling components in the human cortex.
Pandya M, Palpagama TH, Turner C, Waldvogel HJ, Faull RL, Kwakowsky A
Biology of sex differences 2019 Jan 14;10(1):5
Biology of sex differences 2019 Jan 14;10(1):5
No comments: Submit comment
Supportive validation
- Submitted by
- Invitrogen Antibodies (provider)
- Main image
- Experimental details
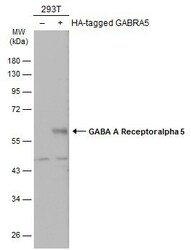
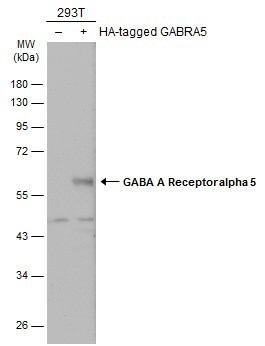
- Western Blot analysis of GABRA5 was performed by separating 30 µg of non-transfected (–) and transfected (+) 293T whole cell extracts by 10% SDS-PAGE. Proteins were transferred to a membrane and probed with a GABRA5 Polyclonal Antibody (Product # PA5-31163) at a dilution of 1:500. The HRP-conjugated anti-rabbit IgG antibody was used to detect the primary antibody.
Supportive validation
- Submitted by
- Invitrogen Antibodies (provider)
- Main image
- Experimental details
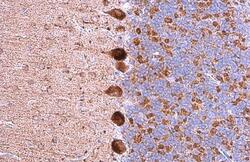
- GABRA5 Polyclonal Antibody detects GABA A Receptor alpha 5 protein at cytoplasm by immunohistochemical analysis. Sample: Paraffin-embedded mouse cerebellum. GABA A Receptor alpha 5 stained by GABRA5 Polyclonal Antibody (Product # PA5-31163) diluted at 1:500. Antigen Retrieval: Citrate buffer, pH 6.0, 15 min.

Supportive validation
- Submitted by
- Invitrogen Antibodies (provider)
- Main image

- Experimental details
- Fig. 1 Western blot against human brain protein homogenates probed with GABA A receptor alpha1, alpha2, alpha3, alpha5, beta3, and gamma2 subunit, GAT1, GAT3, GAD65 and GAD67 and GABA B R R2 subunit antibodies. Each lane has 20 mug of protein loaded. Observed band sizes: alpha1, alpha2: ~ 52 kDa; alpha3, alpha5: ~ 55 kDa; beta3: ~ 63 kDa; gamma2: ~ 44 kDa; GAT1: ~ 85 kDa, GAT3: ~ 80 kDa; GABA B R R2: ~ 120 kDa

- Submitted by
- Invitrogen Antibodies (provider)
- Main image
- Experimental details
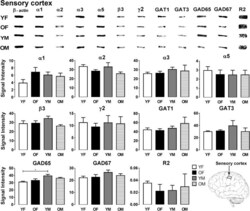
- Fig. 2 Representative immunoreactive Western blot bands from younger female (YF), older female (OF), younger male (YM), and older male (OM) sensory cortex homogenates following incubation with antibodies to the GABA A R subunits alpha1, alpha2, alpha3, alpha5, beta3, and gamma2 and GABA B R subunit R2, GAT1, GAT3, GAD65, and GAD67 ( a ) and corresponding signal intensity graphs ( b ). Signal intensity for each GABA signaling component Western blot band was measured and normalized to their corresponding beta-actin signal for each age group. The data is graphed as mean +- SEM ( n = 6; Kruskal-Wallis test; p * < 0.05)

- Submitted by
- Invitrogen Antibodies (provider)
- Main image

- Experimental details
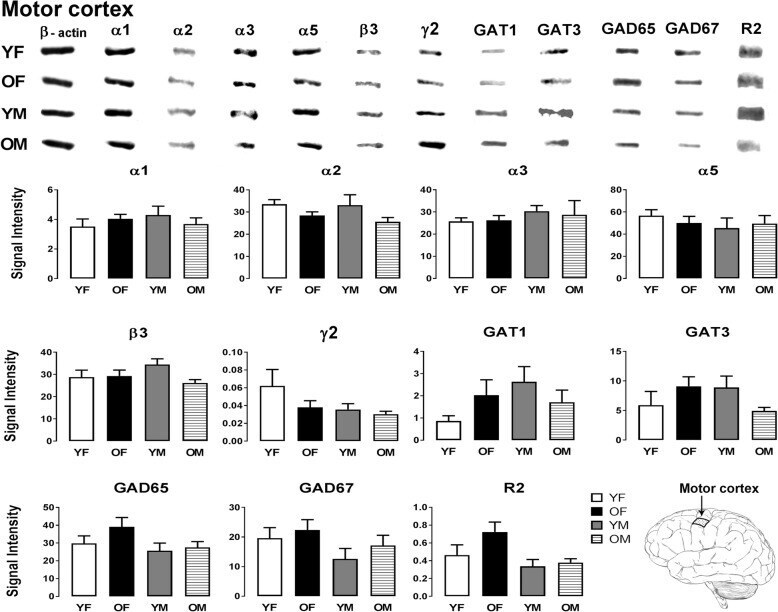
- Fig. 3 Representative immunoreactive Western blot bands from younger female (YF), older female (OF), younger male (YM), and older male (OM) motor cortex homogenates following incubation with antibodies to the GABA A R subunits alpha1, alpha2, alpha3, alpha5, beta3, and gamma2 and GABA B R subunit R2, GAT1, GAT3, GAD65, and GAD67 ( a ) and corresponding signal intensity graphs ( b ). Also, see figure legend on Fig. 2 for details
- Submitted by
- Invitrogen Antibodies (provider)
- Main image
- Experimental details
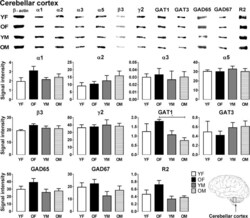
- Fig. 4 Representative immunoreactive Western blot bands from younger female (YF), older female (OF), younger male (YM), and older male (OM) cerebellum homogenates following incubation with antibodies to the GABA A R subunits alpha1, alpha2, alpha3, alpha5, beta3, and gamma2 and GABA B R subunit R2, GAT1, GAT3, GAD65, and GAD67 ( a ) and corresponding signal intensity graphs ( b ). Also, see figure legend on Fig. 2 for details

- Submitted by
- Invitrogen Antibodies (provider)
- Main image

- Experimental details
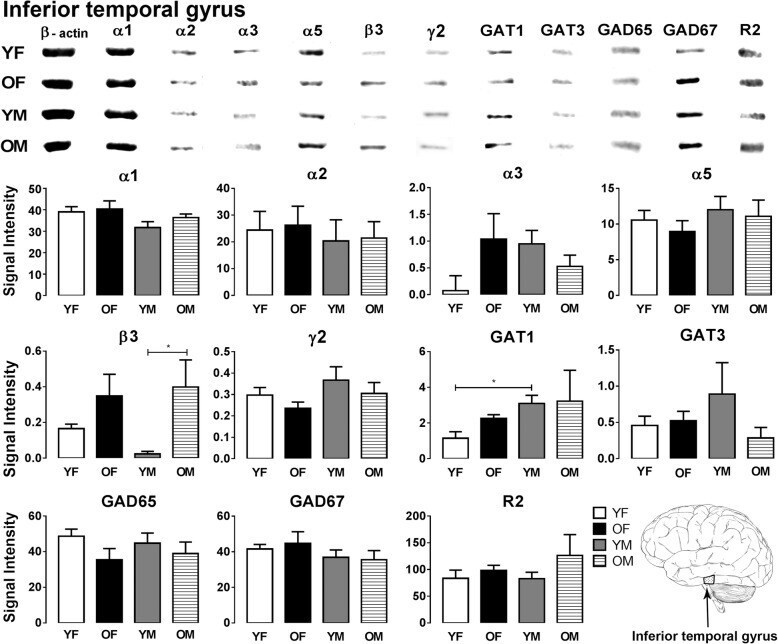
- Fig. 5 Representative immunoreactive Western blot bands from younger female (YF), older female (OF), younger male (YM), and older male (OM) inferior temporal gyrus homogenates following incubation with antibodies to the GABA A R subunits alpha1, alpha2, alpha3, alpha5, beta3, and gamma2 and GABA B R subunit R2, GAT1, GAT3, GAD65, and GAD67 ( a ) and corresponding signal intensity graphs ( b ). Also, see figure legend on Fig. 2 for details
- Submitted by
- Invitrogen Antibodies (provider)
- Main image
- Experimental details
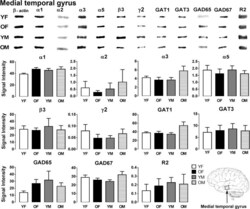
- Fig. 6 Representative immunoreactive Western blot bands from younger female (YF), older female (OF), younger male (YM), and older male (OM) medial temporal gyrus homogenates following incubation with antibodies to the GABA A R subunits alpha1, alpha2, alpha3, alpha5, beta3, and gamma2 and GABA B R subunit R2, GAT1, GAT3, GAD65, and GAD67 ( a ) and corresponding signal intensity graphs ( b ). Also, see figure legend on Fig. 2 for details

- Submitted by
- Invitrogen Antibodies (provider)
- Main image
- Experimental details
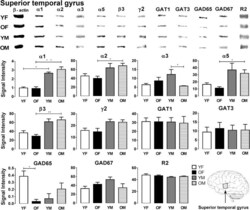
- Fig. 7 Representative immunoreactive Western blot bands from younger female (YF), older female (OF), younger male (YM), and older male (OM) superior temporal gyrus homogenates following incubation with antibodies to the GABA A R subunits alpha1, alpha2, alpha3, alpha5, beta3, and gamma2 and GABA B R subunit R2, GAT1, GAT3, GAD65, and GAD67 ( a ) and corresponding signal intensity graphs ( b ). Also, see figure legend on Fig. 2 for details

- Submitted by
- Invitrogen Antibodies (provider)
- Main image
- Experimental details
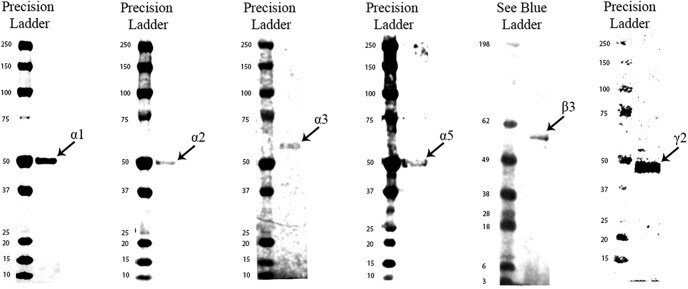
- Figure 1. Western blot against mouse hippocampal protein homogenates probed with GABA A R alpha1, alpha2, alpha3, alpha5, beta3, and gamma2 subunit antibodies. Each lane has 20-40 mug of protein loaded. Observed band sizes: alpha1, alpha2, alpha5: ~52 kDa; alpha3, beta3: ~53 kDa; gamma2: ~44 kDa.
- Submitted by
- Invitrogen Antibodies (provider)
- Main image
- Experimental details
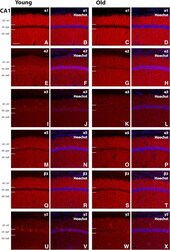
- Figure 3. Representative photomicrographs of the CA1 region showing GABA A R alpha1, alpha2, alpha3, alpha5, beta3, and gamma2 subunit expression (red) and alpha1, alpha2, alpha3, alpha5, beta3, and gamma2 immunoreactivity overlaid with Hoechst (blue) labeling for representative young and old mice ( A-X ). The strong alpha2 subunit immunoreactivity is evident around the soma, proximal dendrites, and possibly in the axon-initial segment of individual pyramidal cells of the CA1 region in young animals but the labeling is decreased at these sites in aged mice ( E-H ). Scale bar, 50 mum. Startum (str), oriens (ori), pyramidale (pyr), radiatum (rad).

- Submitted by
- Invitrogen Antibodies (provider)
- Main image
- Experimental details
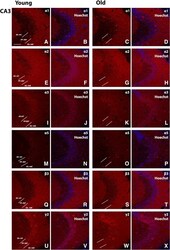
- Figure 4. Representative photomicrographs of the CA3 region showing GABA A R alpha1, alpha2, alpha3, alpha5, beta3, and gamma2 subunit expression (red), and alpha1, alpha2, alpha3, alpha5, beta3, and gamma2 immunoreactivity overlaid with Hoechst (blue) labeling for representative young and old mice ( A-X ). Scale bar, 50 mum.

- Submitted by
- Invitrogen Antibodies (provider)
- Main image
- Experimental details
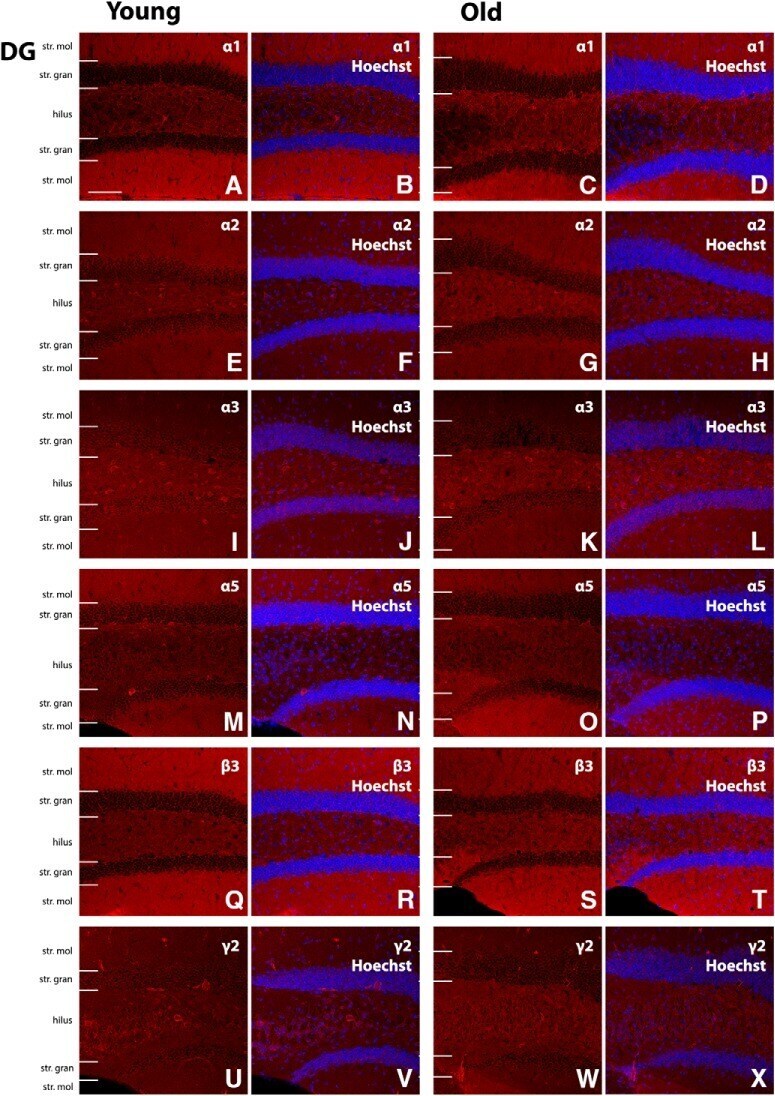
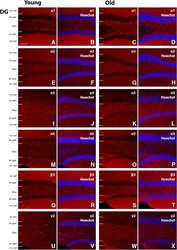
- Figure 5. Representative photomicrographs of the DG region showing GABA A R alpha1, alpha2, alpha3, alpha5, beta3, and gamma2 subunit expression (red), and alpha1, alpha2, alpha3, alpha5, beta3, and gamma2 immunoreactivity overlaid with Hoechst (blue) labeling for representative young and old mice ( A-X ). Scale bar, 50 mum. Moleculare (mol), granulare (gran).