Explore
 Validate
 Learn
Learn Western blot
 Immunoprecipitation
 Immunohistochemistry
Antibody data
- Antibody Data
- Antigen structure
- References [24]
- Comments [0]
- Validations
- Immunohistochemistry [2]
- Flow cytometry [1]
- Other assay [27]
Submit
Validation data
Reference
Comment
Report error
- Product number
- 38-2100 - Provider product page

- Provider
- Invitrogen Antibodies
- Product name
- VPS34 Polyclonal Antibody
- Antibody type
- Polyclonal
- Antigen
- Synthetic peptide
- Reactivity
- Human, Mouse
- Host
- Rabbit
- Isotype
- IgG
- Vial size
- 100 μg
- Concentration
- 0.25 mg/mL
- Storage
- -20°C
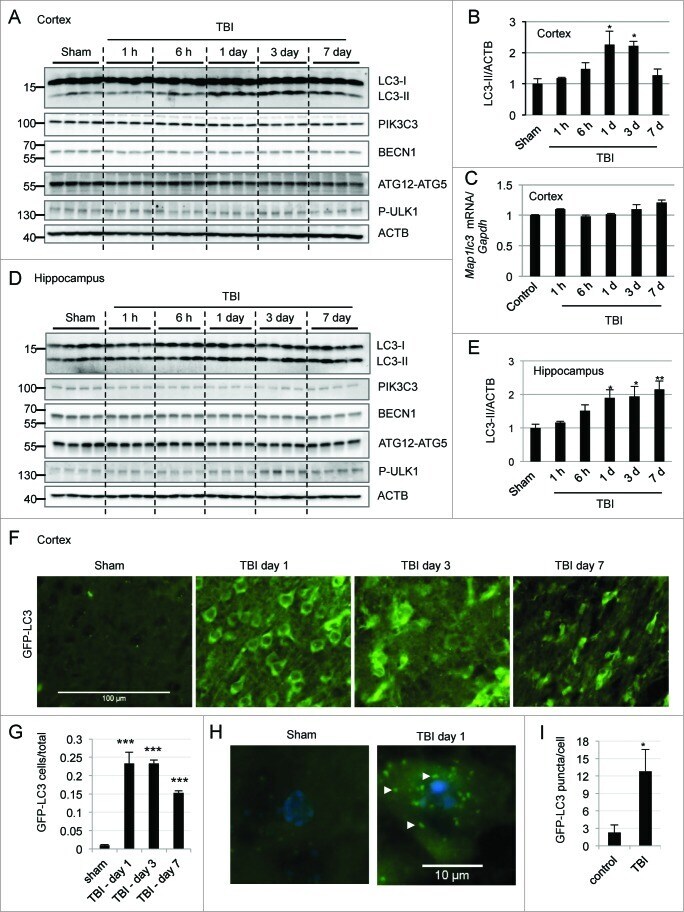
Submitted references PLA2G4A/cPLA2-mediated lysosomal membrane damage leads to inhibition of autophagy and neurodegeneration after brain trauma.
Lipopolysaccharide induces neuroinflammation in microglia by activating the MTOR pathway and downregulating Vps34 to inhibit autophagosome formation.
NLRX1 Negatively Regulates Group A Streptococcus Invasion and Autophagy Induction by Interacting With the Beclin 1-UVRAG Complex.
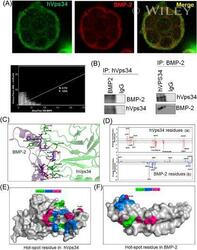
Abrus agglutinin stimulates BMP-2-dependent differentiation through autophagic degradation of β-catenin in colon cancer stem cells.
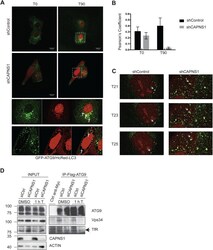
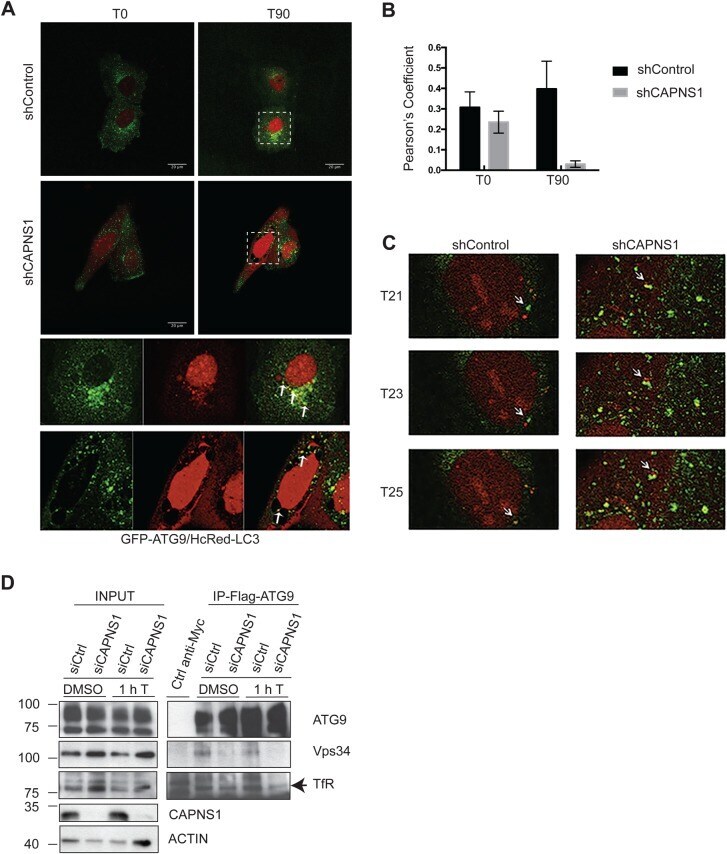
Calpain mobilizes Atg9/Bif-1 vesicles from Golgi stacks upon autophagy induction by thapsigargin.
MTORC1-mediated NRBF2 phosphorylation functions as a switch for the class III PtdIns3K and autophagy.
Impaired autophagosome clearance contributes to neuronal death in a piglet model of neonatal hypoxic-ischemic encephalopathy.
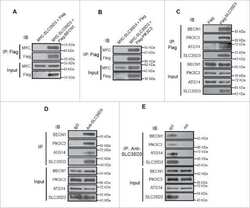
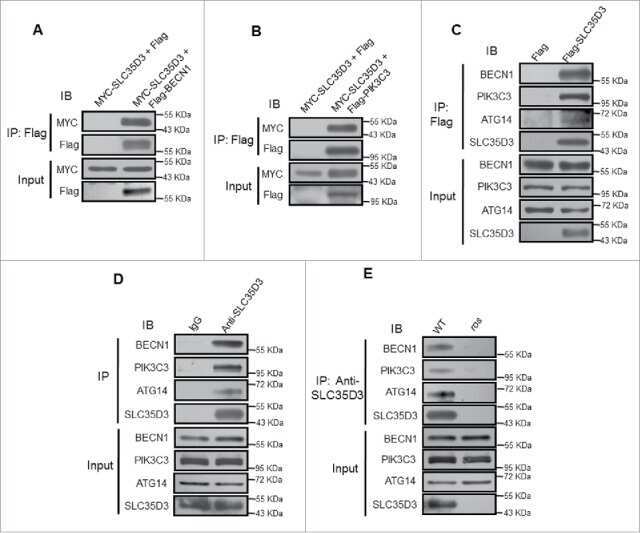
SLC35D3 increases autophagic activity in midbrain dopaminergic neurons by enhancing BECN1-ATG14-PIK3C3 complex formation.
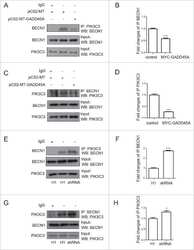
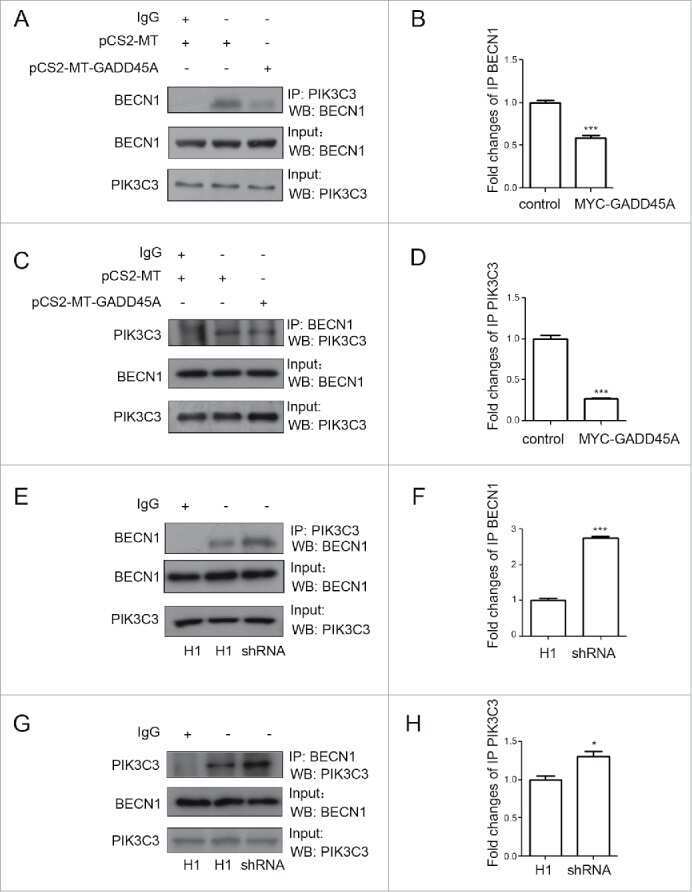
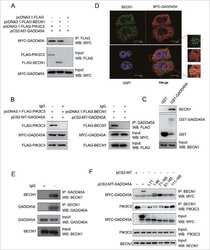
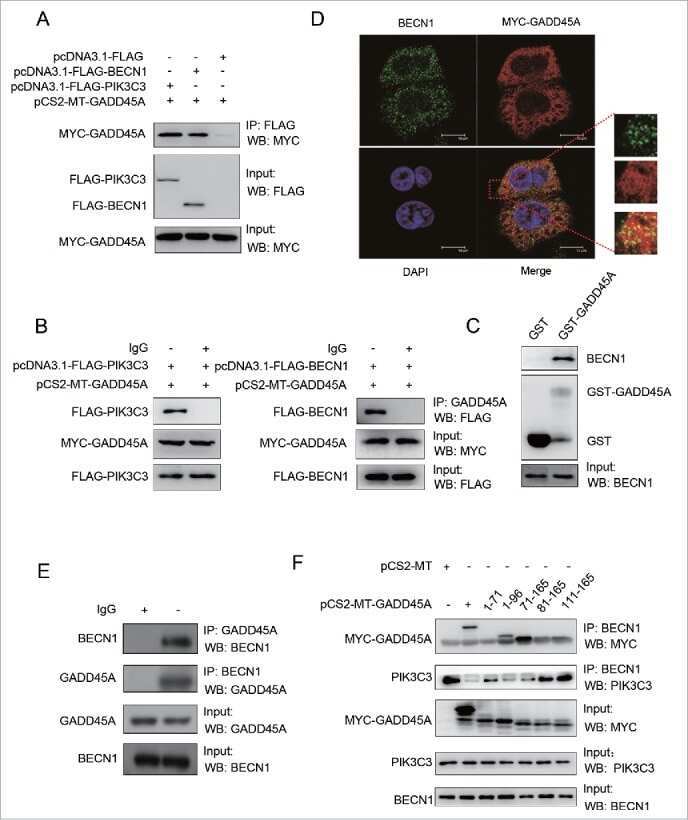
GADD45A inhibits autophagy by regulating the interaction between BECN1 and PIK3C3.
Degradation of lipid droplet-associated proteins by chaperone-mediated autophagy facilitates lipolysis.
Phosphatidylinositol 3-kinase signaling determines kidney size.
Transcriptional regulation of Annexin A2 promotes starvation-induced autophagy.
Impaired autophagy flux is associated with neuronal cell death after traumatic brain injury.
Connexins modulate autophagosome biogenesis.
NRBF2 regulates autophagy and prevents liver injury by modulating Atg14L-linked phosphatidylinositol-3 kinase III activity.
Probiotic Lactobacillus rhamnosus GG mono-association suppresses human rotavirus-induced autophagy in the gnotobiotic piglet intestine.
Rab5 and class III phosphoinositide 3-kinase Vps34 are involved in hepatitis C virus NS4B-induced autophagy.
RalB and the exocyst mediate the cellular starvation response by direct activation of autophagosome assembly.
SLAM is a microbial sensor that regulates bacterial phagosome functions in macrophages.
Regulation of amyloid precursor protein processing by the Beclin 1 complex.
Autophagy induction by the pathogen receptor CD46.
Is autophagy rather than apoptosis the regression driver in imatinib-treated gastrointestinal stromal tumors?
CD18-dependent activation of the neutrophil NADPH oxidase during phagocytosis of Escherichia coli or Staphylococcus aureus is regulated by class III but not class I or II PI3Ks.
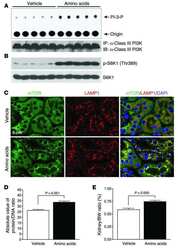
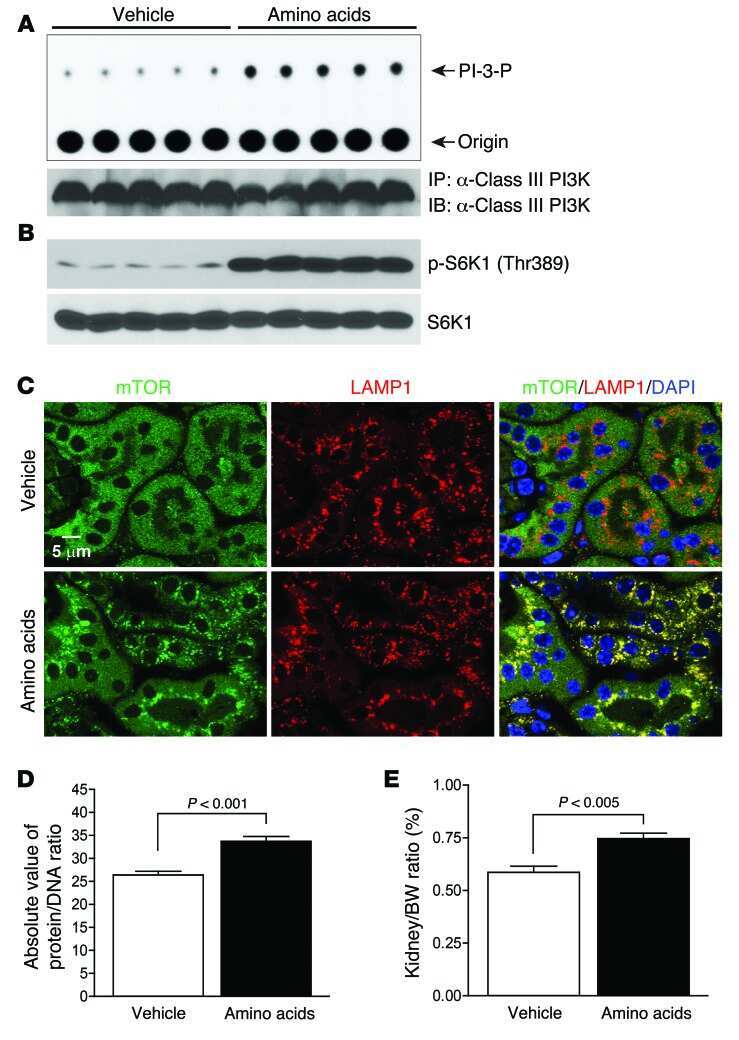
Amino acids mediate mTOR/raptor signaling through activation of class 3 phosphatidylinositol 3OH-kinase.
Sarkar C, Jones JW, Hegdekar N, Thayer JA, Kumar A, Faden AI, Kane MA, Lipinski MM
Autophagy 2020 Mar;16(3):466-485
Autophagy 2020 Mar;16(3):466-485
Lipopolysaccharide induces neuroinflammation in microglia by activating the MTOR pathway and downregulating Vps34 to inhibit autophagosome formation.
Ye X, Zhu M, Che X, Wang H, Liang XJ, Wu C, Xue X, Yang J
Journal of neuroinflammation 2020 Jan 11;17(1):18
Journal of neuroinflammation 2020 Jan 11;17(1):18
NLRX1 Negatively Regulates Group A Streptococcus Invasion and Autophagy Induction by Interacting With the Beclin 1-UVRAG Complex.
Aikawa C, Nakajima S, Karimine M, Nozawa T, Minowa-Nozawa A, Toh H, Yamada S, Nakagawa I
Frontiers in cellular and infection microbiology 2018;8:403
Frontiers in cellular and infection microbiology 2018;8:403
Abrus agglutinin stimulates BMP-2-dependent differentiation through autophagic degradation of β-catenin in colon cancer stem cells.
Panda PK, Naik PP, Praharaj PP, Meher BR, Gupta PK, Verma RS, Maiti TK, Shanmugam MK, Chinnathambi A, Alharbi SA, Sethi G, Agarwal R, Bhutia SK
Molecular carcinogenesis 2018 May;57(5):664-677
Molecular carcinogenesis 2018 May;57(5):664-677
Calpain mobilizes Atg9/Bif-1 vesicles from Golgi stacks upon autophagy induction by thapsigargin.
Marcassa E, Raimondi M, Anwar T, Eskelinen EL, Myers MP, Triolo G, Schneider C, Demarchi F
Biology open 2017 May 15;6(5):551-562
Biology open 2017 May 15;6(5):551-562
MTORC1-mediated NRBF2 phosphorylation functions as a switch for the class III PtdIns3K and autophagy.
Ma X, Zhang S, He L, Rong Y, Brier LW, Sun Q, Liu R, Fan W, Chen S, Yue Z, Kim J, Guan KL, Li D, Zhong Q
Autophagy 2017 Mar 4;13(3):592-607
Autophagy 2017 Mar 4;13(3):592-607
Impaired autophagosome clearance contributes to neuronal death in a piglet model of neonatal hypoxic-ischemic encephalopathy.
Cui D, Sun D, Wang X, Yi L, Kulikowicz E, Reyes M, Zhu J, Yang ZJ, Jiang W, Koehler RC
Cell death & disease 2017 Jul 13;8(7):e2919
Cell death & disease 2017 Jul 13;8(7):e2919
SLC35D3 increases autophagic activity in midbrain dopaminergic neurons by enhancing BECN1-ATG14-PIK3C3 complex formation.
Wei ZB, Yuan YF, Jaouen F, Ma MS, Hao CJ, Zhang Z, Chen Q, Yuan Z, Yu L, Beurrier C, Li W
Autophagy 2016 Jul 2;12(7):1168-79
Autophagy 2016 Jul 2;12(7):1168-79
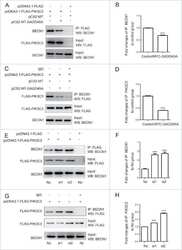
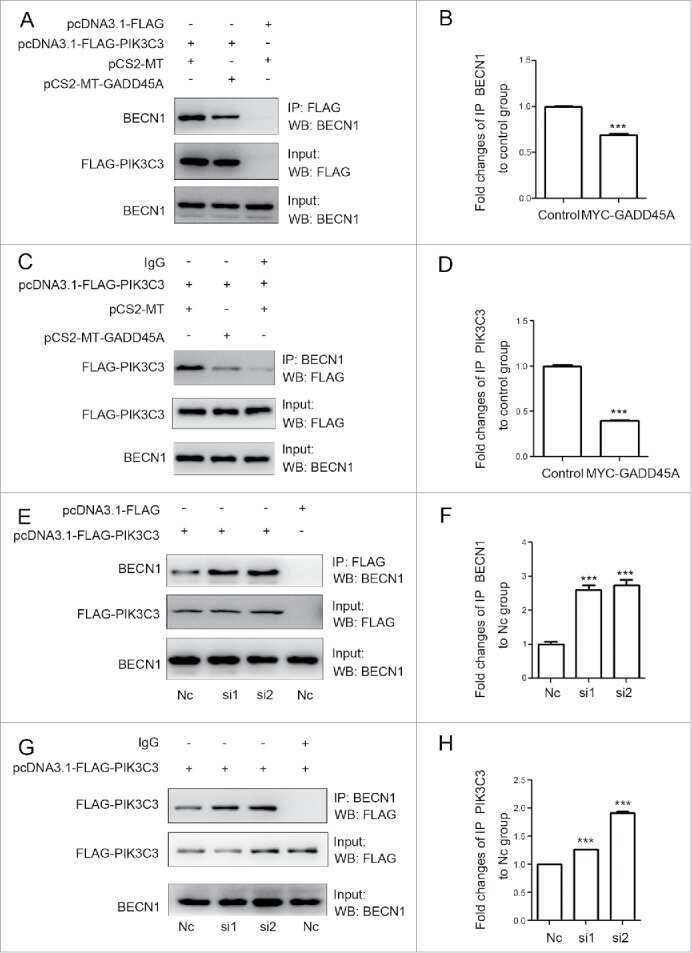
GADD45A inhibits autophagy by regulating the interaction between BECN1 and PIK3C3.
Zhang D, Zhang W, Li D, Fu M, Chen R, Zhan Q
Autophagy 2015;11(12):2247-58
Autophagy 2015;11(12):2247-58
Degradation of lipid droplet-associated proteins by chaperone-mediated autophagy facilitates lipolysis.
Kaushik S, Cuervo AM
Nature cell biology 2015 Jun;17(6):759-70
Nature cell biology 2015 Jun;17(6):759-70
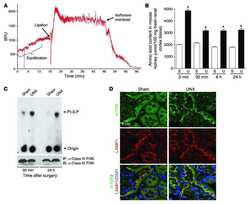
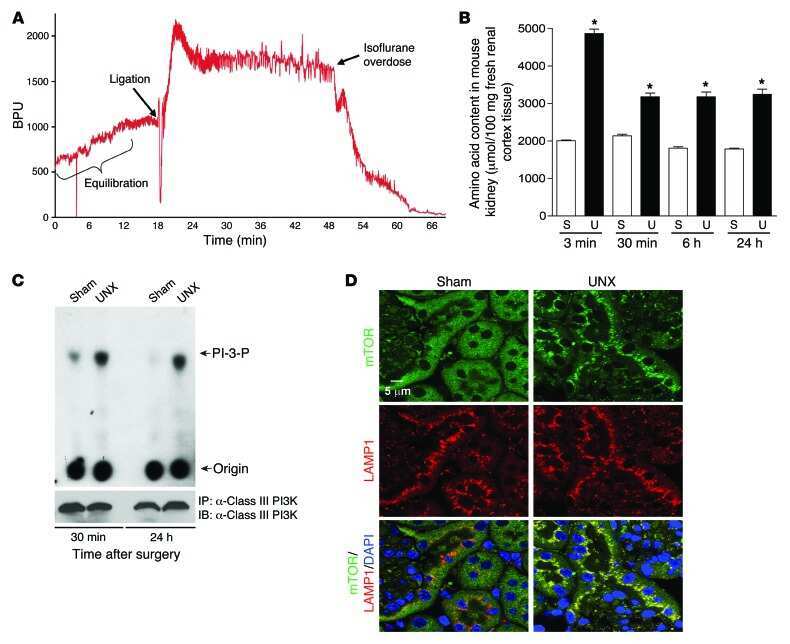
Phosphatidylinositol 3-kinase signaling determines kidney size.
Chen JK, Nagai K, Chen J, Plieth D, Hino M, Xu J, Sha F, Ikizler TA, Quarles CC, Threadgill DW, Neilson EG, Harris RC
The Journal of clinical investigation 2015 Jun;125(6):2429-44
The Journal of clinical investigation 2015 Jun;125(6):2429-44
Transcriptional regulation of Annexin A2 promotes starvation-induced autophagy.
Moreau K, Ghislat G, Hochfeld W, Renna M, Zavodszky E, Runwal G, Puri C, Lee S, Siddiqi F, Menzies FM, Ravikumar B, Rubinsztein DC
Nature communications 2015 Aug 20;6:8045
Nature communications 2015 Aug 20;6:8045
Impaired autophagy flux is associated with neuronal cell death after traumatic brain injury.
Sarkar C, Zhao Z, Aungst S, Sabirzhanov B, Faden AI, Lipinski MM
Autophagy 2014;10(12):2208-22
Autophagy 2014;10(12):2208-22
Connexins modulate autophagosome biogenesis.
Bejarano E, Yuste A, Patel B, Stout RF Jr, Spray DC, Cuervo AM
Nature cell biology 2014 May;16(5):401-14
Nature cell biology 2014 May;16(5):401-14
NRBF2 regulates autophagy and prevents liver injury by modulating Atg14L-linked phosphatidylinositol-3 kinase III activity.
Lu J, He L, Behrends C, Araki M, Araki K, Jun Wang Q, Catanzaro JM, Friedman SL, Zong WX, Fiel MI, Li M, Yue Z
Nature communications 2014 May 22;5:3920
Nature communications 2014 May 22;5:3920
Probiotic Lactobacillus rhamnosus GG mono-association suppresses human rotavirus-induced autophagy in the gnotobiotic piglet intestine.
Wu S, Yuan L, Zhang Y, Liu F, Li G, Wen K, Kocher J, Yang X, Sun J
Gut pathogens 2013 Aug 7;5(1):22
Gut pathogens 2013 Aug 7;5(1):22
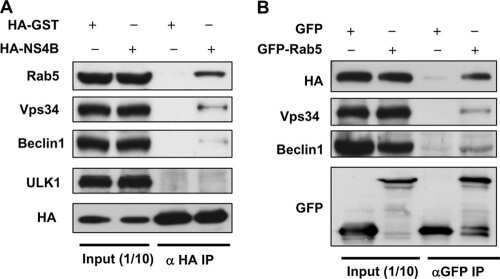
Rab5 and class III phosphoinositide 3-kinase Vps34 are involved in hepatitis C virus NS4B-induced autophagy.
Su WC, Chao TC, Huang YL, Weng SC, Jeng KS, Lai MM
Journal of virology 2011 Oct;85(20):10561-71
Journal of virology 2011 Oct;85(20):10561-71
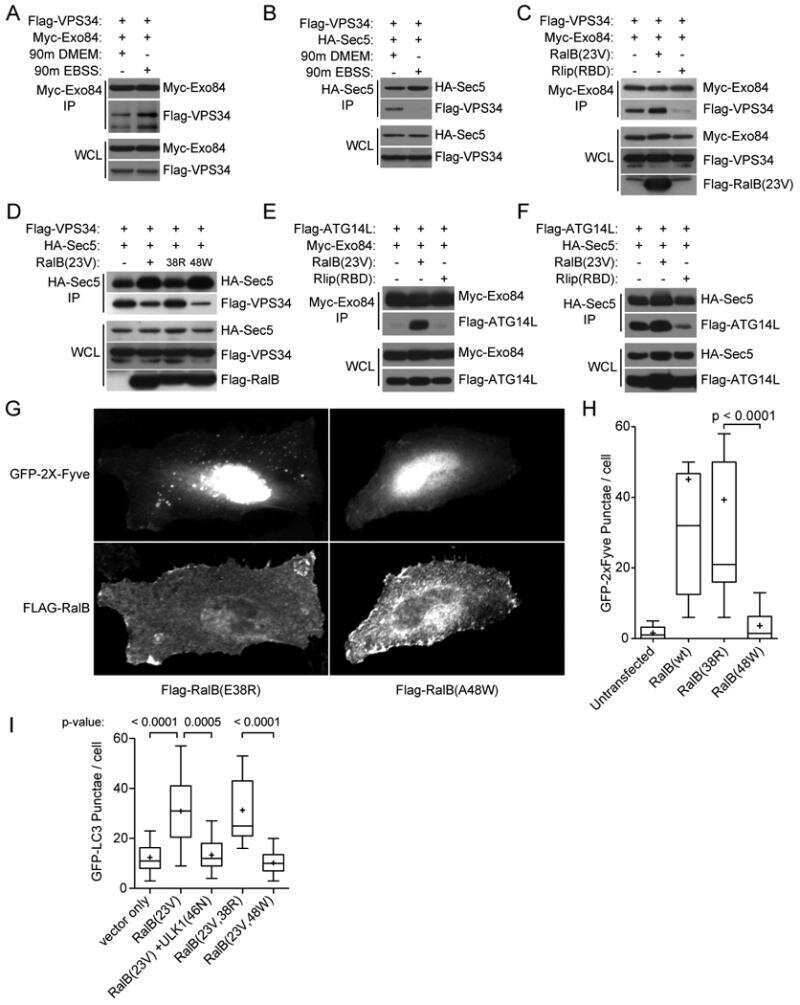
RalB and the exocyst mediate the cellular starvation response by direct activation of autophagosome assembly.
Bodemann BO, Orvedahl A, Cheng T, Ram RR, Ou YH, Formstecher E, Maiti M, Hazelett CC, Wauson EM, Balakireva M, Camonis JH, Yeaman C, Levine B, White MA
Cell 2011 Jan 21;144(2):253-67
Cell 2011 Jan 21;144(2):253-67
SLAM is a microbial sensor that regulates bacterial phagosome functions in macrophages.
Berger SB, Romero X, Ma C, Wang G, Faubion WA, Liao G, Compeer E, Keszei M, Rameh L, Wang N, Boes M, Regueiro JR, Reinecker HC, Terhorst C
Nature immunology 2010 Oct;11(10):920-7
Nature immunology 2010 Oct;11(10):920-7
Regulation of amyloid precursor protein processing by the Beclin 1 complex.
Jaeger PA, Pickford F, Sun CH, Lucin KM, Masliah E, Wyss-Coray T
PloS one 2010 Jun 15;5(6):e11102
PloS one 2010 Jun 15;5(6):e11102
Autophagy induction by the pathogen receptor CD46.
Joubert PE, Meiffren G, Grégoire IP, Pontini G, Richetta C, Flacher M, Azocar O, Vidalain PO, Vidal M, Lotteau V, Codogno P, Rabourdin-Combe C, Faure M
Cell host & microbe 2009 Oct 22;6(4):354-66
Cell host & microbe 2009 Oct 22;6(4):354-66
Is autophagy rather than apoptosis the regression driver in imatinib-treated gastrointestinal stromal tumors?
Miselli F, Negri T, Gronchi A, Losa M, Conca E, Brich S, Fumagalli E, Fiore M, Casali PG, Pierotti MA, Tamborini E, Pilotti S
Translational oncology 2008 Dec;1(4):177-86
Translational oncology 2008 Dec;1(4):177-86
CD18-dependent activation of the neutrophil NADPH oxidase during phagocytosis of Escherichia coli or Staphylococcus aureus is regulated by class III but not class I or II PI3Ks.
Anderson KE, Boyle KB, Davidson K, Chessa TA, Kulkarni S, Jarvis GE, Sindrilaru A, Scharffetter-Kochanek K, Rausch O, Stephens LR, Hawkins PT
Blood 2008 Dec 15;112(13):5202-11
Blood 2008 Dec 15;112(13):5202-11
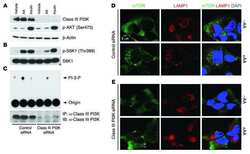
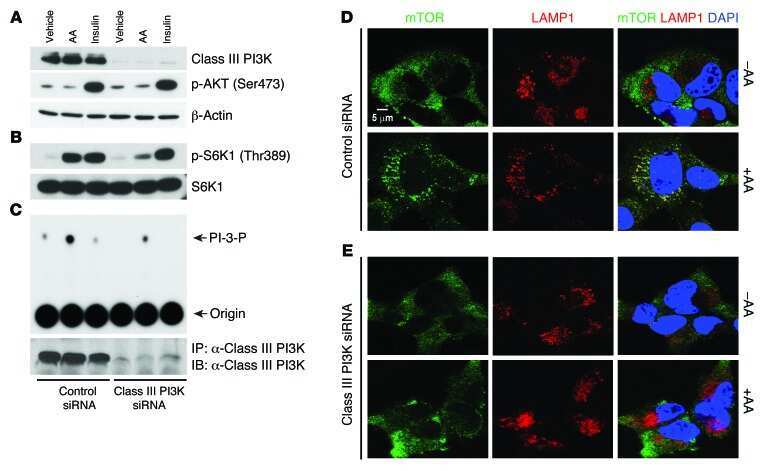
Amino acids mediate mTOR/raptor signaling through activation of class 3 phosphatidylinositol 3OH-kinase.
Nobukuni T, Joaquin M, Roccio M, Dann SG, Kim SY, Gulati P, Byfield MP, Backer JM, Natt F, Bos JL, Zwartkruis FJ, Thomas G
Proceedings of the National Academy of Sciences of the United States of America 2005 Oct 4;102(40):14238-43
Proceedings of the National Academy of Sciences of the United States of America 2005 Oct 4;102(40):14238-43
No comments: Submit comment
Supportive validation
- Submitted by
- Invitrogen Antibodies (provider)
- Main image
- Experimental details
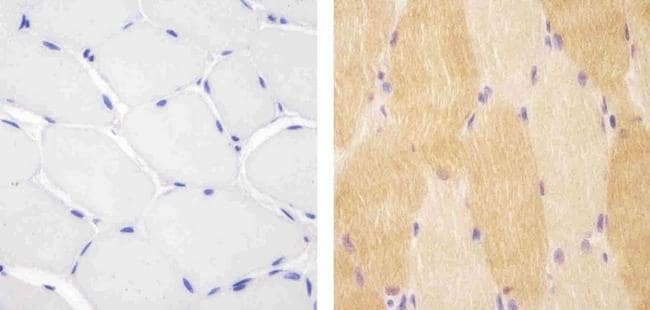
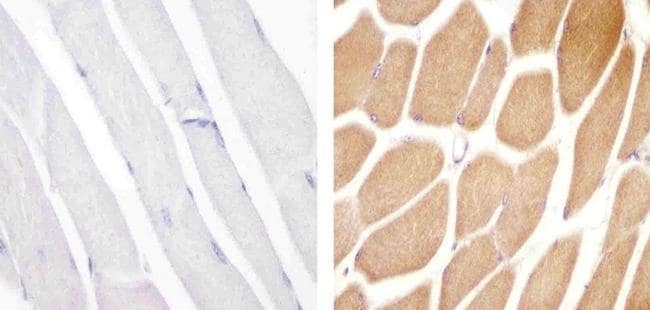
- Immunohistochemistry analysis of VPS34 showing staining in the cytoplasm of paraffin-embedded human skeletal muscle tissue (right) compared to a negative control without primary antibody (left). To expose target proteins, antigen retrieval was performed using 10mM sodium citrate (pH 6.0), microwaved for 8-15 min. Following antigen retrieval, tissues were blocked in 3% H2O2-methanol for 15 min at room temperature, washed with ddH2O and PBS, and then probed with a Anti- VPS34 Polyclonal Antibody (Product # 38-2100) diluted in 3% BSA-PBS at a dilution of 1:20 overnight at 4°C in a humidified chamber. Tissues were washed extensively in PBST and detection was performed using an HRP-conjugated secondary antibody followed by colorimetric detection using a DAB kit. Tissues were counterstained with hematoxylin and dehydrated with ethanol and xylene to prep for mounting.
- Submitted by
- Invitrogen Antibodies (provider)
- Main image

- Experimental details
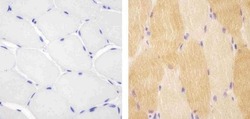
- Immunohistochemistry analysis of VPS34 showing staining in the cytoplasm of paraffin-embedded mouse skeletal muscle tissue (right) compared to a negative control without primary antibody (left). To expose target proteins, antigen retrieval was performed using 10mM sodium citrate (pH 6.0), microwaved for 8-15 min. Following antigen retrieval, tissues were blocked in 3% H2O2-methanol for 15 min at room temperature, washed with ddH2O and PBS, and then probed with a Anti- VPS34 Polyclonal Antibody (Product # 38-2100) diluted in 3% BSA-PBS at a dilution of 1:20 overnight at 4°C in a humidified chamber. Tissues were washed extensively in PBST and detection was performed using an HRP-conjugated secondary antibody followed by colorimetric detection using a DAB kit. Tissues were counterstained with hematoxylin and dehydrated with ethanol and xylene to prep for mounting.
Supportive validation
- Submitted by
- Invitrogen Antibodies (provider)
- Main image
- Experimental details
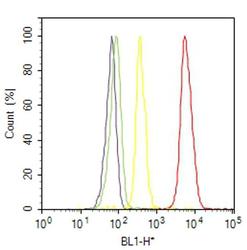
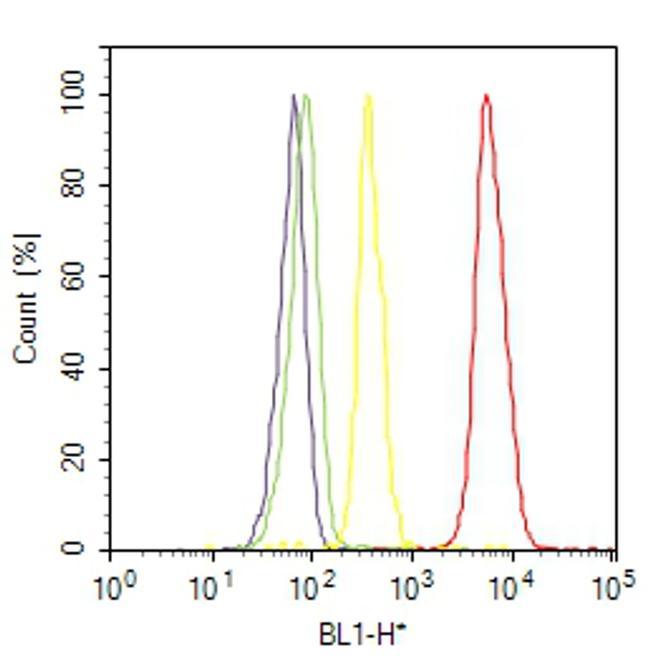
- Flow cytometry analysis of VPS34 was done on SH-SY5Y cells. Cells were fixed with 70% ethanol for 10 minutes, permeabilized with 0.25% Triton™ X-100 for 20 minutes, and blocked with 5% BSA for 30 minutes at room temperature. Cells were labeled with VPS34 Rabbit Polyclonal Antibody (382100, red histogram) or with rabbit isotype control (yellow histogram) at 3-5 ug/million cells in 2.5% BSA. After incubation at room temperature for 2 hours, the cells were labeled with Alexa Fluor® 488 Goat Anti-Rabbit Secondary Antibody (A11008) at a dilution of 1:400 for 30 minutes at room temperature. The representative 10,000 cells were acquired and analyzed for each sample using an Attune® Acoustic Focusing Cytometer. The purple histogram represents unstained control cells and the green histogram represents no-primary-antibody control.
Supportive validation
- Submitted by
- Invitrogen Antibodies (provider)
- Main image
- Experimental details
- NULL
- Submitted by
- Invitrogen Antibodies (provider)
- Main image

- Experimental details
- NULL
- Submitted by
- Invitrogen Antibodies (provider)
- Main image
- Experimental details
- NULL
- Submitted by
- Invitrogen Antibodies (provider)
- Main image
- Experimental details
- NULL
- Submitted by
- Invitrogen Antibodies (provider)
- Main image
- Experimental details
- NULL

- Submitted by
- Invitrogen Antibodies (provider)
- Main image
- Experimental details
- NULL
- Submitted by
- Invitrogen Antibodies (provider)
- Main image
- Experimental details
- NULL
- Submitted by
- Invitrogen Antibodies (provider)
- Main image
- Experimental details
- NULL
- Submitted by
- Invitrogen Antibodies (provider)
- Main image
- Experimental details
- NULL
- Submitted by
- Invitrogen Antibodies (provider)
- Main image
- Experimental details
- NULL
- Submitted by
- Invitrogen Antibodies (provider)
- Main image
- Experimental details
- NULL
- Submitted by
- Invitrogen Antibodies (provider)
- Main image

- Experimental details
- NULL
- Submitted by
- Invitrogen Antibodies (provider)
- Main image
- Experimental details
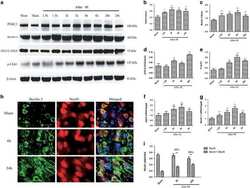
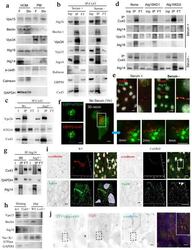
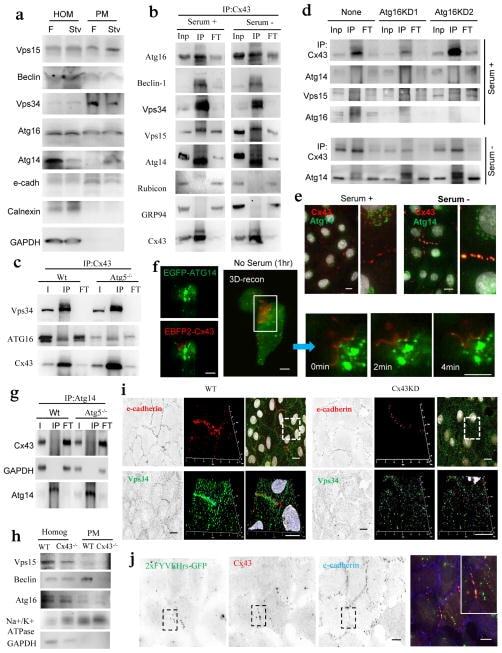
- Figure 6 Atg14 is recruited to Cx43-enriched plasma membrane regions during nutritional deprivation ( a ) Immunoblot for the indicated proteins in homogenates and purified plasma membrane from fed (F) and 24 h starved mice (Stv). Starvation-induced changes in the PM content relative to fed levels were as follows: Vps15 (1.2+0.2), Beclin-1 (0.7+0.5), Vps34 (0.9+0.1), Atg16 (1.1+0.3), Atg14 (2.5+0.2) and only Atg14 were significant for p
- Submitted by
- Invitrogen Antibodies (provider)
- Main image
- Experimental details
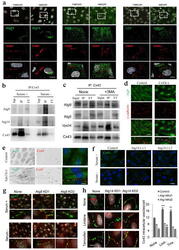
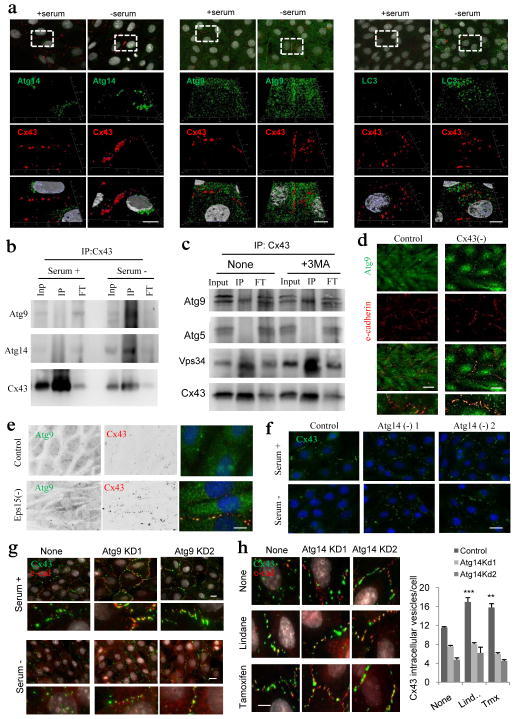
- Figure 7 Cx43 modulates formation of pre-autophagosomal structures through direct interaction with autophagy-related proteins ( a ) Co-immunostaining for Cx43 and the indicated Atgs in NRK cells maintained in the presence or absence of serum (top). Single and merged channels of the 3D reconstruction of the boxed regions are shown (bottom). Nuclei are highlighted with DAPI. ( b, c ) Immunoblot for the indicated proteins of immunoprecipitates (IP) of Cx43 in NRK cells maintained in the presence or absence of serum ( b ) or treated or not with 3-methyladenine ( c ) Atg5 is shown as negative control for IP. ( d ) Co-staining for Atg9 and e-cadherin in NRK cells control and knocked down for Cx43. Single and merged channels at higher magnification areas are shown. ( e ) Immunofluorescence for endogenous Atg9 and Cx43 in NRK cells control or knocked down for Eps15. ( f, g ) Immunofluorescence for endogenous Cx43 (green) in NRK cells control or knocked down for Atg14 ( f ) or Atg9 ( g ) maintained in the presence or absence of serum. ( h ) Immunofluorescence of endogenous Cx43 in NRK cells control or knocked down for Atg14 treated (or not) with Tx or Lnd (left). e-cadherin staining (red) is shown to highlight plasma membrane in g and h . Full fields are shown in Supplementary Fig. 6h . Quantification of intracytoplasmic Cx43-positives vesicles (right) (n= 3 wells, 3 independent experiments, >30 cells per experiment). Values are mean+s.e.m and significant for (*) p
- Submitted by
- Invitrogen Antibodies (provider)
- Main image
- Experimental details
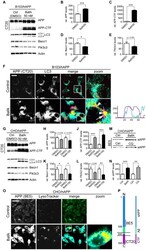
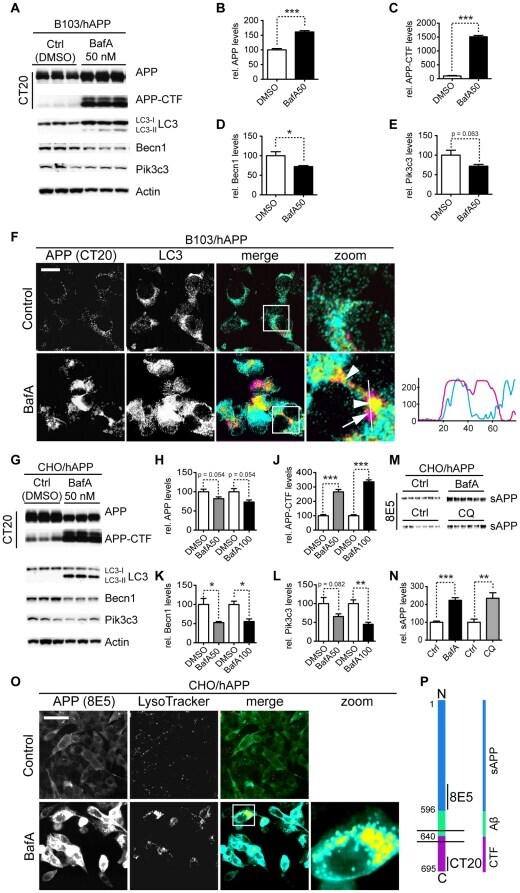
- Figure 5 Inhibition of autophagosomal turnover leads to a reduction in Becn1 and Pik3c3 levels. A-E. B103/hAPP cells were treated with vehicle (DMSO) or 50 nM BafA for 24 hrs to inhibit autophagosomal degradation. Western blots (A) and quantification (B-E) of RIPA cell lysates that were probed with CT15 APP, LC3, Becn1, and Pik3c3 antibody. An actin antibody was used as a loading control. F. Confocal microscopy of B103/hAPP cells treated with vehicle (DMSO) or 100 nM BafA for 24 hrs. Cells were stained with CT20 APP antibody (magenta) and LC3 antibody (cyan). Co-localization is indicated in yellow. Arrowheads indicate LC3 positive APP containing vesicles. The arrow indicates an APP containing LC3 negative vesicle (scale bar represents 10 um). The line indicates cross-section. Cyan line in the cross-section represents APP intensity, magenta line represents LC3 intensity (AU). G-L. CHO/hAPP cells were treated with vehicle (DMSO), 50 nM, or 100 nM BafA (WB data not shown) for 24 hrs. Western blots (G) and quantification (H-L) of RIPA cell lysates that were probed with the CT15 APP, LC3, Becn1, and Pik3c3 antibody. An actin antibody was used as a loading control. M-N. BafA and CQ treatment cause increased APP processing which in turn leads to elevated levels of secreted APP (sAPP) in the cell supernatant (M). This is quantified in (N). O. Epifluorescence microscopy of CHO/hAPP cells treated with vehicle (DMSO) or 100 nM BafA for 12 hrs. Cells were stained with the 8E5 APP antibod
- Submitted by
- Invitrogen Antibodies (provider)
- Main image
- Experimental details
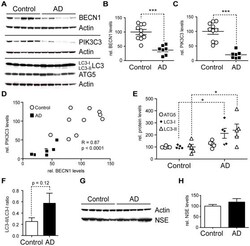
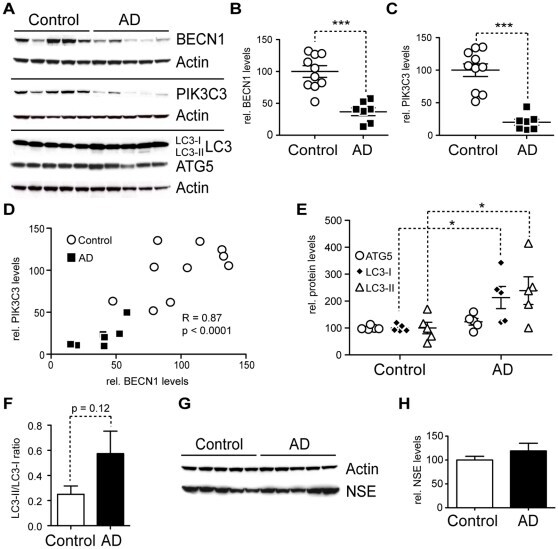
- Figure 7 AD brains have less BECN1 and PIK3C3 and more LC3. A-H. Comparison of protein levels in frontal cortex (gray matter) from AD brains and age matched, non-demented, non-pathological controls. Western blots (A) and quantification (B-F) of RIPA lysates that were probed with the CT20 APP, LC3, Becn1, Pik3c3, and Atg5 antibody. An actin antibody was used as a loading control. 7 AD and 10 control cases were used. BECN1 and PIK3C3 levels were significantly reduced in AD cases (B-C). A significant linear correlation exists between BECN1 and PIK3C3 levels (R = 0.86, p
- Submitted by
- Invitrogen Antibodies (provider)
- Main image
- Experimental details
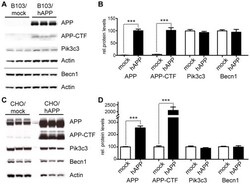
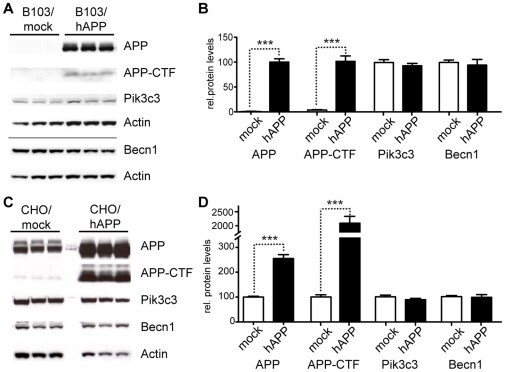
- Figure 3 Overexpression of APP does not change Becn1 or Pik3c3 protein levels. A-B. B103 cells were stably transfected with an empty plasmid (mock) or a hAPP encoding plasmid. Western blots (A) and quantification (B) of RIPA cell lysates that were probed with the CT15 APP, a Becn1, and a Pik3c3 antibody. An actin antibody was used as a loading control. C-D. CHO cells were stably transfected with an empty plasmid (mock) or a hAPP encoding plasmid. Western blots (C) and quantification (D) of RIPA cell lysates that were probed with the CT15 APP, a Becn1, and a Pik3c3 antibody. Actin antibody was used as a loading control. Bars are mean +- SEM from triplicate cultures of at least two independent experiments. * p
- Submitted by
- Invitrogen Antibodies (provider)
- Main image
- Experimental details
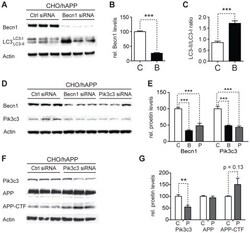
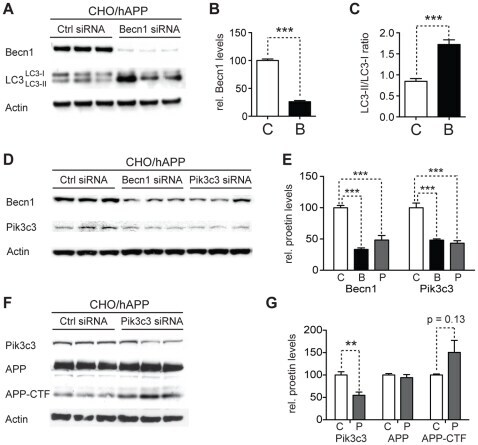
- Figure 4 Reduction of Becn1 impairs degradation of autophagosomes and reduces Pik3c3 levels. A-C. CHO/hAPP cells were treated with Becn1 siRNA for 48 h. Western blots (A) of RIPA cell lysates were probed with a Becn1 and LC3 antibody. An actin antibody was used as a loading control. Quantification (B) of the Becn1 band intensity and the ratio of LC3-II to LC3-I (C). D-E. CHO/hAPP cells were treated with Becn1 and Pik3c3 siRNA for 48 h. Western blots (D) and quantification (E) of RIPA cell lysates that were probed with a Becn1 and Pik3c3 antibody. An actin antibody was used as a loading control. F-G. CHO/hAPP cells were treated with Pik3c3 siRNA for 48 h. Western blots (F) and quantification (G) of RIPA cell lysates that were probed with the CT15 APP antibody and with an actin antibody as a control for loading. Bars are mean +- SEM from triplicate cultures of at least two independent experiments. * p
- Submitted by
- Invitrogen Antibodies (provider)
- Main image
- Experimental details
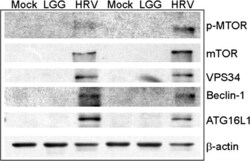
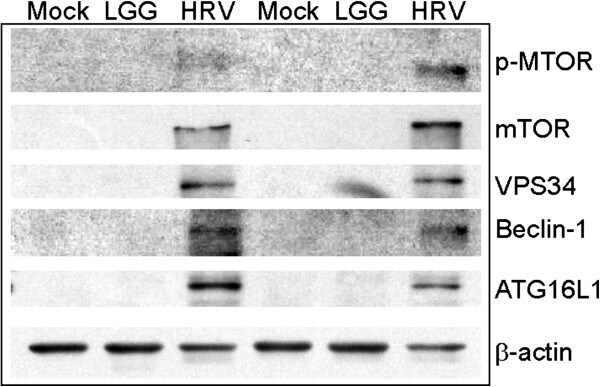
- Figure 1 Human rotavirus (HRV) stimulates autophagy proteins in gnotobiotic (Gn) pig ileum. Autophagy proteins in pig ileum on post-HRV inoculation day (PID) 2. Tissue lysates were analyzed for p-mTOR (Ser 2448), total mTOR, VPS34, Beclin-1,and ATG16L1 by immunoblot. LGG, Lactobacillus rhamnosus GG.
- Submitted by
- Invitrogen Antibodies (provider)
- Main image
- Experimental details
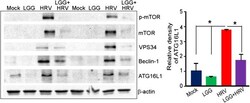
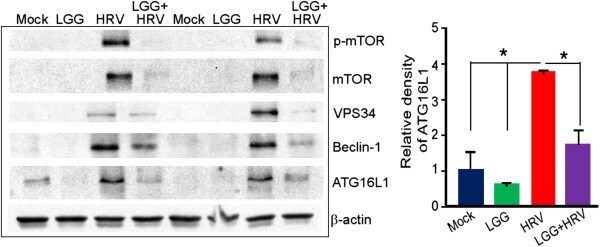
- Figure 2 LGG inhibits autophagy proteins enhanced by HRV in Gn pig ileum. Autophagy proteins in pig ileum treated with LGG and HRV. Ileum epithelia were scraped on PID 2. Relative protein band intensities of ATG16L1 in pig ileum were analyzed with NIH image. Data are reported as the mean +- SD. ANOVA, * P
- Submitted by
- Invitrogen Antibodies (provider)
- Main image
- Experimental details
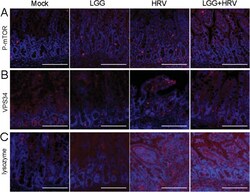
- Figure 3 Detection of p-mTOR, VPS34 and lysozyme proteins by immunofluorescence in pig ileum. (A) HRV increases the expression of p-mTOR (Ser 2448) in pig ileum. Red, p-mTOR. (B) HRV increases the expression of VPS34 in Gn pig ileum. Red, VPS34. (C) HRV with/without LGG increases the expression of lysozyme in Gn pig ileum. Red, lysozyme; blue, DAPI (20x magnification, scale bar 100 mum).

- Submitted by
- Invitrogen Antibodies (provider)
- Main image
- Experimental details
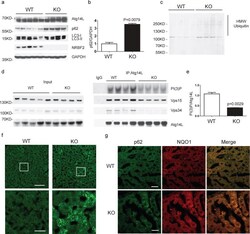
- Figure 6 NRBF2 KO livers display reduced Atg14L-linked Vps34 activity, partially impaired autophagy and focal activation of Nrf2 pathway (a) Western blotting analysis shows accumulation of p62 in the liver of NRBF2 KO mice. Livers lysates were immunoprobed with antibodies indicated. p62 protein levels are up-regulated in the KO mice liver. (b) The quantification result shows that the p62 level increased more than three-fold in the NRBF2 KO mice liver compared with WT mice liver (Data shown as mean+-SEM, P values are indicated on the figures, unpaired Student's t test; WT, n=5 mice; KO, n=4 mice). (c) Western blotting analysis shows accumulation of high molecular weight (HMW) ubiqutin in the liver of NRBF2 KO mice. Insoluble fractions of liver lysates were immunoprobed with an anti-ubiquitin antibody, n=4 mice per genotype. (d) Atg14L-linked Vps34 kinase activity is impaired in the liver of NRBF2 KO mice. Atg14L-linked Vps34 is pulled down by an anti-Atg14L antibody and subjected to kinase assay. IP products and inputs were immunoblotted using the antibodies indicated. (e) Quantification of IPed Vps34 kinase activity versus IPed Atg14L shows the significant difference between WT and NRBF2 KO mice liver (Data shown as mean+-SEM, P values are indicated on the figure, unpaired Student's t test, n=4 mice each group). (f) Focal accumulation of p62 in the liver of NRBF2 KO mice. Liver frozen sections (15 mum in thickness) were stained with an anti-p62 antibody. Focal accum

- Submitted by
- Invitrogen Antibodies (provider)
- Main image
- Experimental details
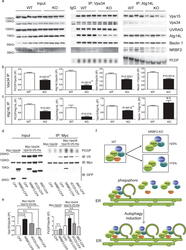
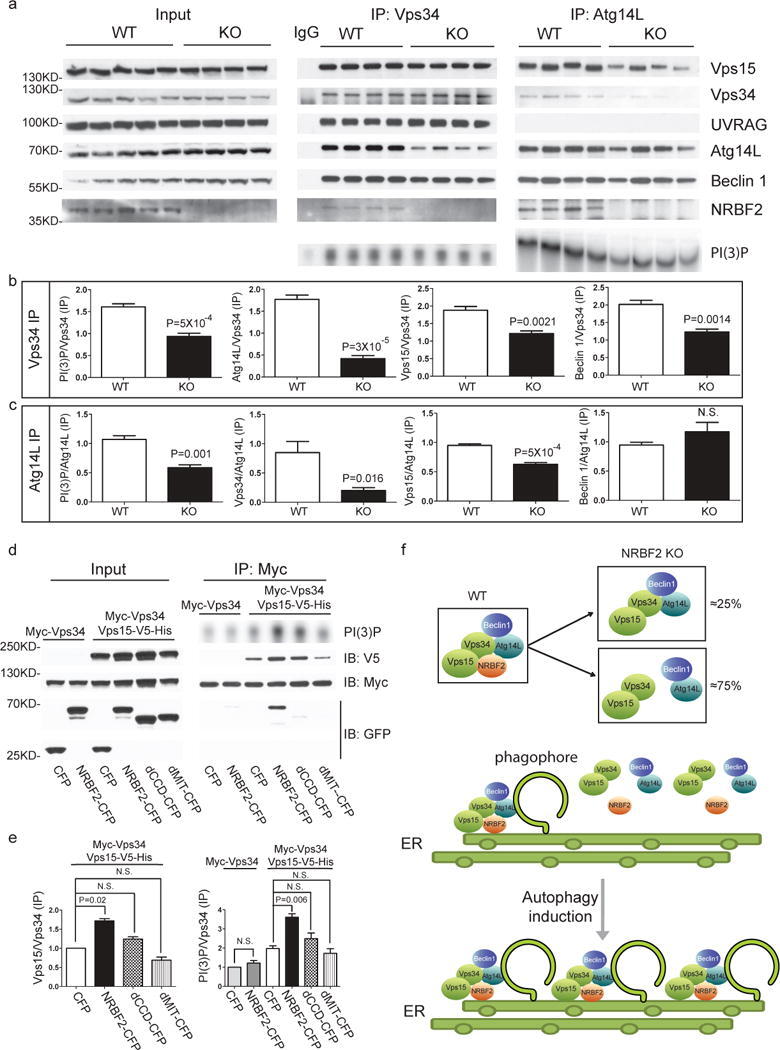
- Figure 8 Assembly of Beclin 1-Vps34 complex in WT and NRBF2 mice, and schematic model for the NRBF2 function (a) NRBF2 is critical for the assembly of Vps34-Vps15 and Atg14L-Beclin 1 complex. Brain lysate from WT and NRBF2 KO mice were subjected to Co-IP by Vps34 antibody and Atg14L antibody. The IP products were subjected to in vitro lipid kinase assay and Western blotting analysis using the indicated antibodies. (b, c) Quantification results shows that Vps34-Vps15 and Atg14L-Beclin 1 complex interactions as well as Atg14L-linked Vps34 kinase activity are dramatically impaired in NRBF2 KO mice. (Data shown as mean+-SEM, P values are indicated on the figures, unpaired Student's t test, n=4 mice in each group). (d) Over-expression of NRBF2 enhances overall Vps34 kinase activity. HEK293T cells were co-transfected with Myc-Vps34-Vps15-His and CFP, NRBF2-CFP, dMIT-CFP or dCCD-CFP. Total Vps34 was pulled down by an anti-myc antibody and subjected to kinase assay. IP products and inputs are immunoblotted using the antibodies indicated. (e) Quantification of IPed Vps34 kinase activity, Vps15 protein normalized with IPed Vps34 shows that NRBF2-CFP, but not CFP, dMIT-CFP or dCCD-CFP significantly enhance Vps34 kinase activity and Vps34-Vps15 interaction. (Data shown as mean+-SEM, P values are indicated on the figures. IPed Vps15 / IPed Vps34, one sample t test versus hypothetical mean 1, bonferroni correction, n=3; IPed Vps34 kinase activity / IPed Vps34, multiple t test followed
- Submitted by
- Invitrogen Antibodies (provider)
- Main image
- Experimental details
- Figure 1. For figure legend, see page 2211.
- Submitted by
- Invitrogen Antibodies (provider)
- Main image
- Experimental details
- Fig. 5. Atg9 dynamics is impaired in CAPNS1-depleted cells. (A) ShCAPNS1 and control cells were co-transfected with GFP-Atg9 and HcRed-LC3. 24 h later, the cells were analysed using a confocal microscope. Images were acquired every 2 min over a 50 min time interval. The first (T0) and last (T90) merged pictures of the 2 h time-lapse experiments are shown. Scale bars: 20 mum. Magnifications of boxed areas are shown in the right panels. Arrows indicate ATG9 vesicles adjacent to or fused with LC3 vesicles. (B) Quantification of GFP-Atg9 and HcRed-LC3 colocalization by Pearson's coefficient determination in control and CAPNS1-depleted U2OS cells, before and after thapsigargin treatment. (C) Images sequences (T21, T23, T25) of the GFP-ATG9/HcRed-LC3 time-lapse experiment made using control and CAPNS1-depleted U2OS cells. The arrow indicates one ATG9 vesicle that meets and fuses with a LC3-positive vesicle in control cells. In shCAPNS1 cells, ATG9- and LC3-positive vesicles are more stationary. (D) U2OS cells stably expressing Flag-Atg9 were transfected with a CAPNS1-specific siRNA or a control siRNA. 48 h later, the cells were treated for 1 h with DMSO or 100 nM thapsigargin before lysis and immunoprecipitation with an anti-Flag antibody. The immunoprecipitation products were analysed by western blot to visualize Flag-Atg9, endogenous TfR and Vps34.
- Submitted by
- Invitrogen Antibodies (provider)
- Main image
- Experimental details
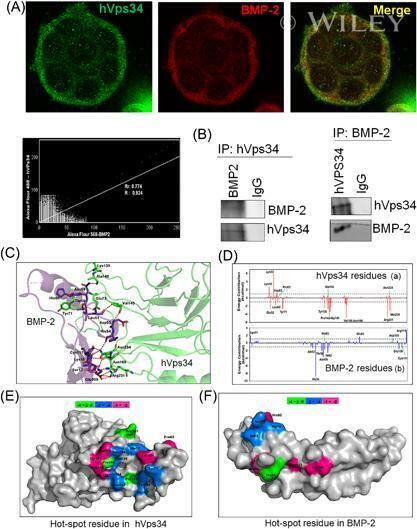
- Interaction of BMP-2 and hVps34. HT-29 colonospheres were treated with AGG (100 ng/mL) for 72 h and the interaction of BMP-2 (Red) and hVps34 (Green) was analyzed by confocal microscopy (A). The colocalization parameters were analyzed by using JaCoP plugin in ImageJ software. HT-29 colonospheres were treated with AGG (ng/mL) for 72 h and immunoprecipitated with anti-BMP-2 and anti-hVps34 followed by immunoblotting with anti-Vps34 or anti-BMP-2 antibodies (B). A schematic ribbon representation of the BMP-2-hVps34 complex structure is shown in different colors. The hVps34 domain is shown in green color while the BMP-2 structure is shown in violet color. The residues showing the interactions are shown in sticks along the domain interface for both BMP-2 and hVps34 (C). The decomposition of DeltaG on per-residue basis or the pair interaction energy between BMP-2 and hVps34: (a) the contribution of each residue in hVps34 to BMP-2 domain binding; (b) the contribution of each residue in the BMP-2 domain to hVps34 binding (D). The distributions of the identified hotspot residues on the hVps34 (E) and BMP-2 (F) domain cartoon representation. Colored bars show the range of contributions by the residues in the unit kcal/mol
- Submitted by
- Invitrogen Antibodies (provider)
- Main image

- Experimental details
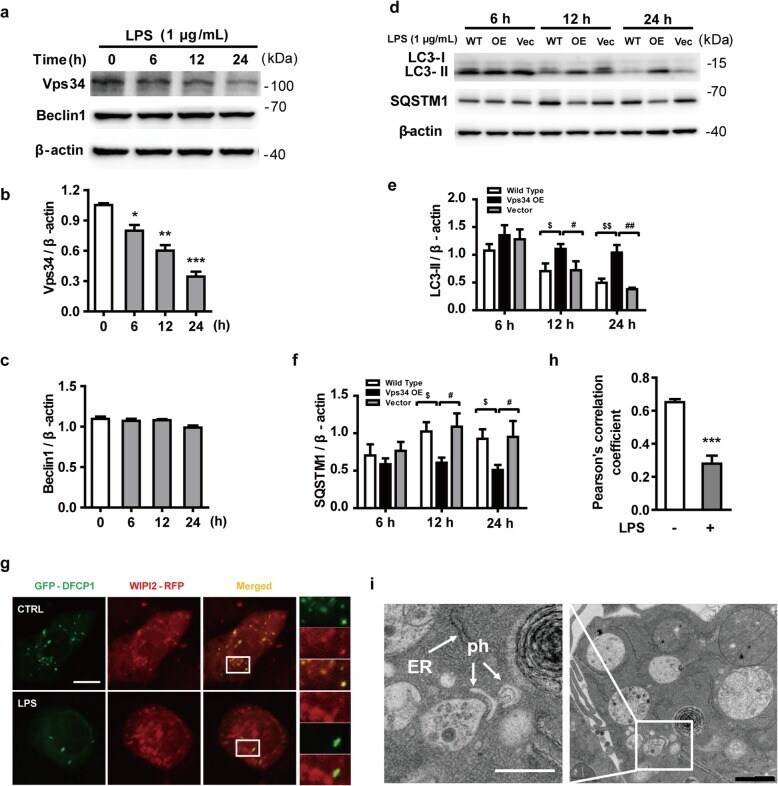
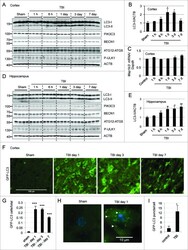
- Fig. 3 LPS reduces the expression of Vps34, resulting in the inhibition of omegasome formation and phagophore formation in N9 microglial cells. a The protein levels of Vps34 and Beclin1 were detected by western blotting in LPS-treated N9 microglial cells and quantified ( b , c ). d The expression of LC3 and SQSTM1 were detected by western blotting in Vps34 overexpressing N9 microglial cells after treatment with 1 mug/mL LPS for 6 h, 12 h, and 24 h, and quantified ( e , f ). g N9 microglial cells were transfected with GFP-DFCP1 and RFP-WIPI2 plasmids for 24 h and then treated with or without 1 mug/mL LPS for 12 h, and visualized by confocal microscopy. Immunofluorescence images show the colocalization of DFCP1 (green) with WIPI2 (red) in the CTRL and LPS-treated cells. The boxed areas are enlarged in the right panels. Scale bar: 10 mum. h Pearson's correlation coefficient for colocalization of DFCP1 with WIPI2 was calculated by Image J. Data are presented as mean +- SEM of three independent experiments. i Representative TEM images of N9 microglial cells cotreated with 100 nM rapamycin and 1 mug/mL LPS for 12 h. Arrows indicate phagophores (ph) and endoplasmic reticulum (ER). Scale bar: 500 nm (white), 1 mum (black). Data are presented as mean +- SEM. * p < 0.05, ** p < 0.01, *** p < 0.001 vs control; $ p < 0.05, $$ p < 0.01 vs wild type; # p < 0.05, ## p < 0.01 vs vector