Explore
 Validate
 Learn
Learn Flow cytometry
Antibody data
- Antibody Data
- Antigen structure
- References [14]
- Comments [0]
- Validations
- Flow cytometry [1]
- Other assay [11]
Submit
Validation data
Reference
Comment
Report error
- Product number
- 48-1469-42 - Provider product page

- Provider
- Invitrogen Antibodies
- Product name
- CD146 Monoclonal Antibody (P1H12), eFluor™ 450, eBioscience™
- Antibody type
- Monoclonal
- Antigen
- Other
- Description
- Description: The monoclonal antibody P1H12 recognizes CD146 also known as MUC18, s-endo, Endo-CAM and Mel-CAM, which is a member of the Ig superfamily of proteins. The expression of CD146 is found on endothelial cells, bone marrow fibroblasts and some tumors (especially melanoma). Recently mesenchymal stromal cells and endometrial stromal cells have also been shown to express CD146. The presence of CD146 on circulating blood cells have been confined to a subset of T cells rather than circulating endothelial cells, as expression of other endothelial markers (CD31 and CD51/61) is negative. Expression can be found on activated lymphocytes. The protein is heavily glycosylated with more than 50% of the mass from carbohydrates. The antibody P1H12 has been reported to crossreact to mouse, rabbit, canine, but not rat. Applications Reported: This P1H12 antibody has been reported for use in flow cytometric analysis. Applications Tested: This P1H12 antibody has been pre-titrated and tested by flow cytometric analysis of normal human peripheral blood cells. This can be used at 5 µL (0.125 µg) per test. A test is defined as the amount (µg) of antibody that will stain a cell sample in a final volume of 100 µL. Cell number should be determined empirically but can range from 10^5 to 10^8 cells/test. eFluor® 450 is an alternative to Pacific Blue®. eFluor® 450 emits at 445 nm and is excited with the Violet laser (405 nm). Please make sure that your instrument is capable of detecting this fluorochome. Excitation: 405 nm; Emission: 445 nm; Laser: Violet Laser. Filtration: 0.2 µm post-manufacturing filtered.
- Reactivity
- Human, Mouse, Canine, Rabbit
- Host
- Mouse
- Isotype
- IgG
- Antibody clone number
- P1H12
- Vial size
- 100 Tests
- Concentration
- 5 µL/Test
- Storage
- 4° C, store in dark, DO NOT FREEZE!
Submitted references Reprogramming bone progenitor identity and potency through control of collagen density and oxygen tension.
Site-Dependent Lineage Preference of Adipose Stem Cells.
Apoptotic bodies derived from mesenchymal stem cells promote cutaneous wound healing via regulating the functions of macrophages.
Impact of Fibronectin Knockout on Proliferation and Differentiation of Human Infrapatellar Fat Pad-Derived Stem Cells.
Therapeutic Effects of Human Urine-Derived Stem Cells in a Rat Model of Cisplatin-Induced Acute Kidney Injury In Vivo and In Vitro.
LPS‑induced upregulation of the TLR4 signaling pathway inhibits osteogenic differentiation of human periodontal ligament stem cells under inflammatory conditions.
Molecular Programming of Perivascular Stem Cell Precursors.
Tumor-associated B-cells induce tumor heterogeneity and therapy resistance.
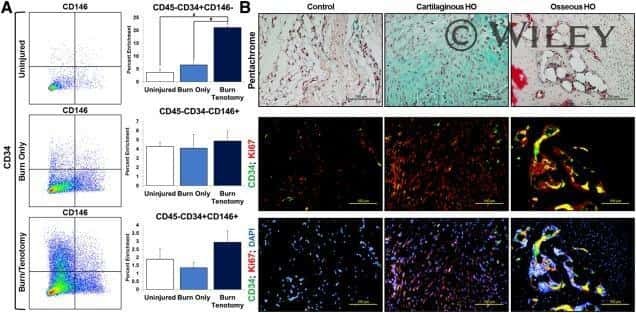
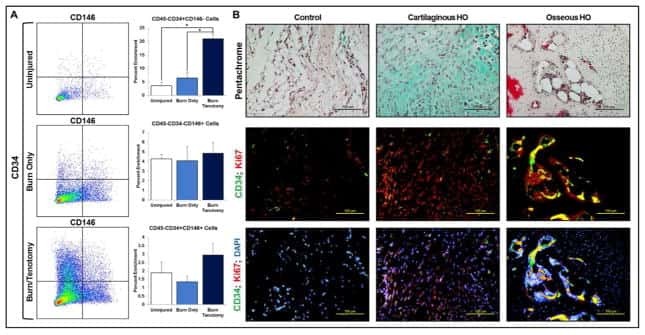
Analysis of Bone-Cartilage-Stromal Progenitor Populations in Trauma Induced and Genetic Models of Heterotopic Ossification.
Application of anodized titanium for enhanced recruitment of endothelial progenitor cells.
Canine hemangiosarcoma originates from hematopoietic precursors with potential for endothelial differentiation.
CD146 (Mel-CAM), an adhesion marker of endothelial cells, is a novel marker of lymphocyte subset activation in normal peripheral blood.
Identification and functional assessment of endothelial P1H12.
Circulating activated endothelial cells in sickle cell anemia.
Al Hosni R, Bozec L, Roberts SJ, Cheema U
iScience 2022 Apr 15;25(4):104059
iScience 2022 Apr 15;25(4):104059
Site-Dependent Lineage Preference of Adipose Stem Cells.
Wang T, Hill RC, Dzieciatkowska M, Zhu L, Infante AM, Hu G, Hansen KC, Pei M
Frontiers in cell and developmental biology 2020;8:237
Frontiers in cell and developmental biology 2020;8:237
Apoptotic bodies derived from mesenchymal stem cells promote cutaneous wound healing via regulating the functions of macrophages.
Liu J, Qiu X, Lv Y, Zheng C, Dong Y, Dou G, Zhu B, Liu A, Wang W, Zhou J, Liu S, Liu S, Gao B, Jin Y
Stem cell research & therapy 2020 Nov 27;11(1):507
Stem cell research & therapy 2020 Nov 27;11(1):507
Impact of Fibronectin Knockout on Proliferation and Differentiation of Human Infrapatellar Fat Pad-Derived Stem Cells.
Wang Y, Fu Y, Yan Z, Zhang XB, Pei M
Frontiers in bioengineering and biotechnology 2019;7:321
Frontiers in bioengineering and biotechnology 2019;7:321
Therapeutic Effects of Human Urine-Derived Stem Cells in a Rat Model of Cisplatin-Induced Acute Kidney Injury In Vivo and In Vitro.
Sun B, Luo X, Yang C, Liu P, Yang Y, Dong X, Yang Z, Xu J, Zhang Y, Li L
Stem cells international 2019;2019:8035076
Stem cells international 2019;2019:8035076
LPS‑induced upregulation of the TLR4 signaling pathway inhibits osteogenic differentiation of human periodontal ligament stem cells under inflammatory conditions.
Yu B, Li Q, Zhou M
International journal of molecular medicine 2019 Jun;43(6):2341-2351
International journal of molecular medicine 2019 Jun;43(6):2341-2351
Molecular Programming of Perivascular Stem Cell Precursors.
Yianni V, Sharpe PT
Stem cells (Dayton, Ohio) 2018 Dec;36(12):1890-1904
Stem cells (Dayton, Ohio) 2018 Dec;36(12):1890-1904
Tumor-associated B-cells induce tumor heterogeneity and therapy resistance.
Somasundaram R, Zhang G, Fukunaga-Kalabis M, Perego M, Krepler C, Xu X, Wagner C, Hristova D, Zhang J, Tian T, Wei Z, Liu Q, Garg K, Griss J, Hards R, Maurer M, Hafner C, Mayerhöfer M, Karanikas G, Jalili A, Bauer-Pohl V, Weihsengruber F, Rappersberger K, Koller J, Lang R, Hudgens C, Chen G, Tetzlaff M, Wu L, Frederick DT, Scolyer RA, Long GV, Damle M, Ellingsworth C, Grinman L, Choi H, Gavin BJ, Dunagin M, Raj A, Scholler N, Gross L, Beqiri M, Bennett K, Watson I, Schaider H, Davies MA, Wargo J, Czerniecki BJ, Schuchter L, Herlyn D, Flaherty K, Herlyn M, Wagner SN
Nature communications 2017 Sep 19;8(1):607
Nature communications 2017 Sep 19;8(1):607
Analysis of Bone-Cartilage-Stromal Progenitor Populations in Trauma Induced and Genetic Models of Heterotopic Ossification.
Agarwal S, Loder SJ, Sorkin M, Li S, Shrestha S, Zhao B, Mishina Y, James AW, Levi B
Stem cells (Dayton, Ohio) 2016 Jun;34(6):1692-701
Stem cells (Dayton, Ohio) 2016 Jun;34(6):1692-701
Application of anodized titanium for enhanced recruitment of endothelial progenitor cells.
Moradi I, Behjati M, Kazemi M
Nanoscale research letters 2012 Jun 7;7(1):298
Nanoscale research letters 2012 Jun 7;7(1):298
Canine hemangiosarcoma originates from hematopoietic precursors with potential for endothelial differentiation.
Lamerato-Kozicki AR, Helm KM, Jubala CM, Cutter GC, Modiano JF
Experimental hematology 2006 Jul;34(7):870-8
Experimental hematology 2006 Jul;34(7):870-8
CD146 (Mel-CAM), an adhesion marker of endothelial cells, is a novel marker of lymphocyte subset activation in normal peripheral blood.
Elshal MF, Khan SS, Takahashi Y, Solomon MA, McCoy JP Jr
Blood 2005 Oct 15;106(8):2923-4
Blood 2005 Oct 15;106(8):2923-4
Identification and functional assessment of endothelial P1H12.
Solovey AN, Gui L, Chang L, Enenstein J, Browne PV, Hebbel RP
The Journal of laboratory and clinical medicine 2001 Nov;138(5):322-31
The Journal of laboratory and clinical medicine 2001 Nov;138(5):322-31
Circulating activated endothelial cells in sickle cell anemia.
Solovey A, Lin Y, Browne P, Choong S, Wayner E, Hebbel RP
The New England journal of medicine 1997 Nov 27;337(22):1584-90
The New England journal of medicine 1997 Nov 27;337(22):1584-90
No comments: Submit comment
Supportive validation
- Submitted by
- Invitrogen Antibodies (provider)
- Main image

- Experimental details
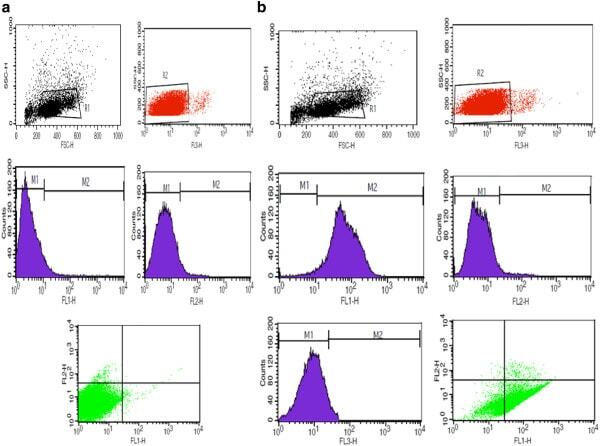
- Staining of normal human peripheral blood cells with Anti-Human CD3 APC (Product # 17-0038-42) and Mouse IgG1 K Isotype Control eFluor® 450 (Product # 48-4714-82) (left) or Anti-CD146 eFluor® 450 (right). Cells in the lymphocyte gate were used for analysis.

Supportive validation
- Submitted by
- Invitrogen Antibodies (provider)
- Main image

- Experimental details
- NULL
- Submitted by
- Invitrogen Antibodies (provider)
- Main image
- Experimental details
- NULL
- Submitted by
- Invitrogen Antibodies (provider)
- Main image
- Experimental details
- NULL
- Submitted by
- Invitrogen Antibodies (provider)
- Main image
- Experimental details
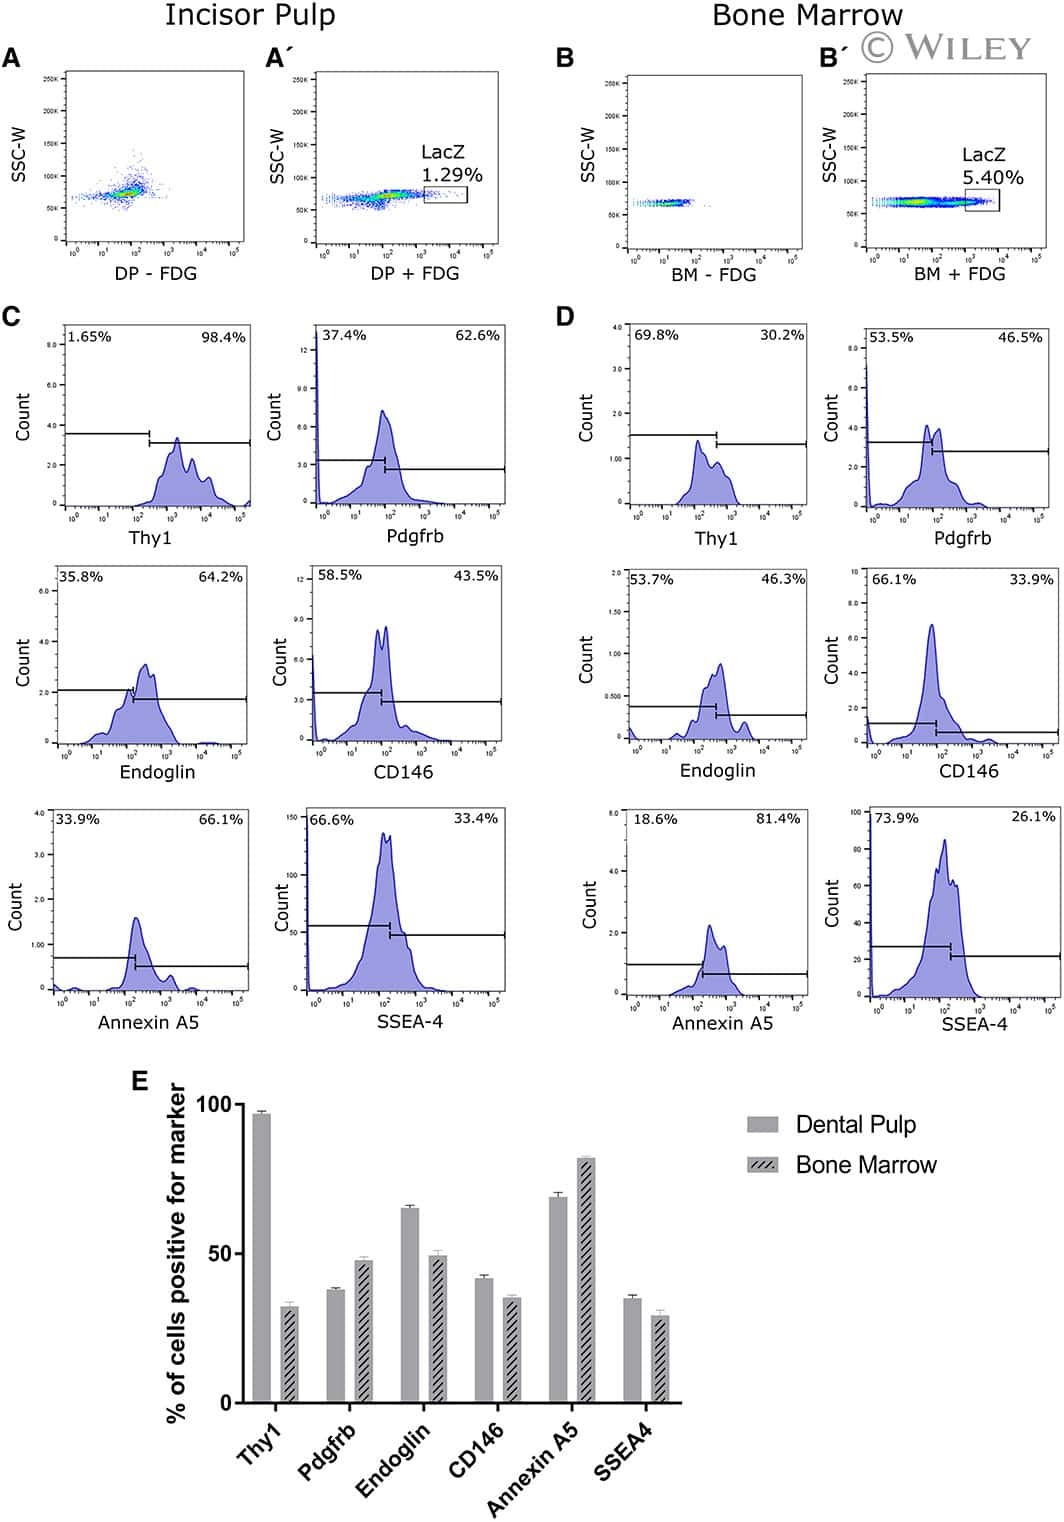
- Fig. 4 IGF-1-dependent induction of cancer stem cell markers CD20, CD133, and CD271 (NGFR) on melanoma cells. a Melanoma cells (WM3749) co-cultured with TAB cells (days 3 and 9) show high expression of CD20 ( middle and right panels ) compared with the control culture ( left panel ) as determined by FACS analysis. Melanoma cells were co-stained with anti-CD146 (MCAM, PE-conjugated) and anti-CD20 (FITC-conjugated) antibodies to distinguish them from B cells, which are CD146-negative;percentages indicate co-expression of both markers on the malignant cells. b Melanoma cells (WM3749) co-cultured with TAB cells (day 6) show high expression of CD20, CD133 and CD271 ( left panel ) compared with minimal or low expression of those markers when tumor cells are co-cultured with NB cells ( right panel ). Co-culture of melanoma cells with TAB cells did not modulate the expression of CD144 (vascular-endothelial cadherin marker) that are normally expressed by aggressive melanomas (data not shown). Induction of CD20, CD133, and CD271 was blocked when anti-IGF-1 neutralizing antibody (10 mug/ml) was used in the co-culture ( middle panel ). Anti-IL-1, anti-PDGF or anti-VEGF antibodies had no effect on CD marker expression (data not shown). Percentages indicate co-expression of CD20, CD133, or CD271on CD146 + melanoma cells. Results are representative of two independent experiments. c Melanoma cells(WM3749, WM989 and 451Lu) cultured in the presence of recombinant IGF-1 (25 ng/ml) for 5 days sh

- Submitted by
- Invitrogen Antibodies (provider)
- Main image
- Experimental details
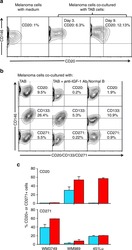
- Figure 1 Characterization of isolated endothelial progenitor cells. Flow cytometric analysis of surface markers of EPCs using FITC-conjugated anti-CD146, PE-conjugated anti-CD34 and PE-Cy5-conjugated anti-CD45 monoclonal antibodies demonstrated that 78% (A) and 80% (B) of the cells were triple positive for the markers. FLI, FL2 and FL3 represent CD146, KDR and CD45 expressive cells, respectively. The percentage of expressing cells was calculated using the cell quest program.
- Submitted by
- Invitrogen Antibodies (provider)
- Main image
- Experimental details
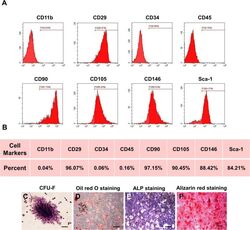
- Fig. 1 Characterization of murine BMMSCs. a , b Flow cytometric analysis of the surface markers showed positive expression of CD29, CD90, CD105, CD146, and Sca-1, and negative expression of hematopoietic markers CD11b, CD34, and CD45. c Representative image of colony formation of murine BMMSCs. d Representative image of Oil Red O staining of murine BMMSCs. e Representative image of ALP staining of murine BMMSCs. f Representative image of Alizarin red staining of murine BMMSCs. Scale bar, 500 mum

- Submitted by
- Invitrogen Antibodies (provider)
- Main image
- Experimental details
- Figure 2 Identification and purification of hPDLSCs by flow cytometry. hPDLSCs, human periodontal ligament stem cells.
- Submitted by
- Invitrogen Antibodies (provider)
- Main image
- Experimental details
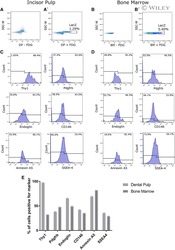
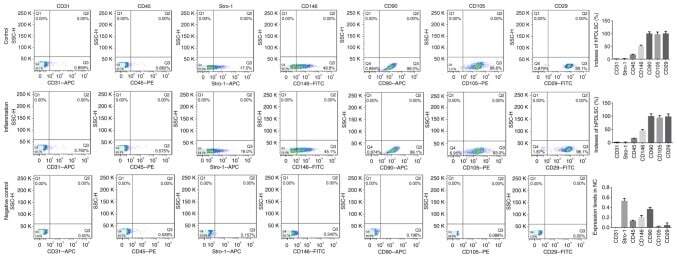
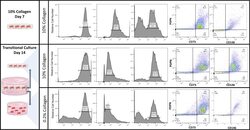
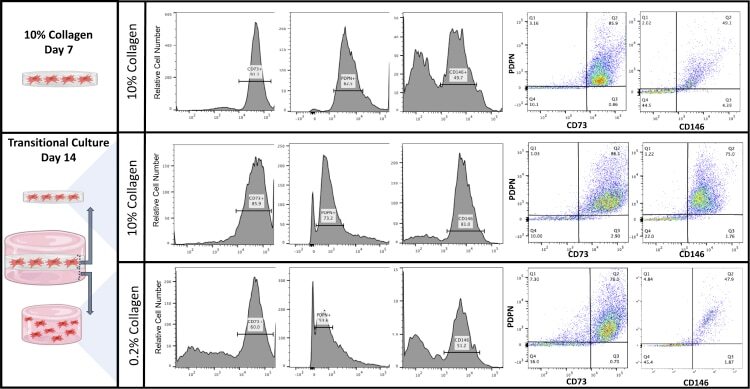
- Cell surface analysis of AMSCs within the transitional culture AMSCs were cultured in a 10% collagen type I gel for 7 days and embedded in a 0.2% collagen type I gel, making up the transitional culture for an additional 14 days. Flow cytometric analysis was conducted for PDPN, CD73, and CD146 (representative data presented).
- Submitted by
- Invitrogen Antibodies (provider)
- Main image
- Experimental details
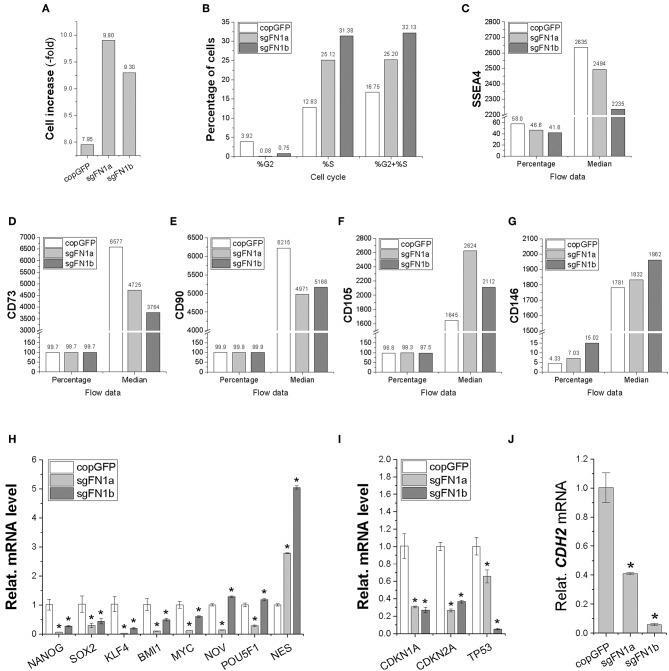
- Figure 2 Cell proliferation capacity in human IPFSCs after FN1-KO. FN1-KO cells were compared with copGFP in cell increase (A) , percentage of cells in the S and G 2 phases (B) , and surface markers [SSEA4 (C) , CD73 (D) , CD90 (E) , CD105 (F) , and CD146 (G) ] by flow cytometry; stemness genes ( NANOG, SOX2, KLF4, BMI1, MYC, NOV, POU5F1 , and NES ) (H) , senescent genes ( CDKN1A, CDKN2A , and TP53 ) (I) , and the mesenchymal condensation gene ( CDH2 ) (J) by qPCR. GAPDH was used as an endogenous control. Data are shown as bar charts. * indicates a significant difference compared to the corresponding copGFP group ( P < 0.05).
- Submitted by
- Invitrogen Antibodies (provider)
- Main image
- Experimental details
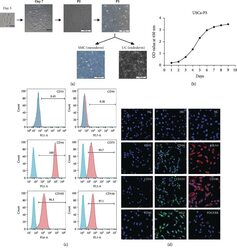
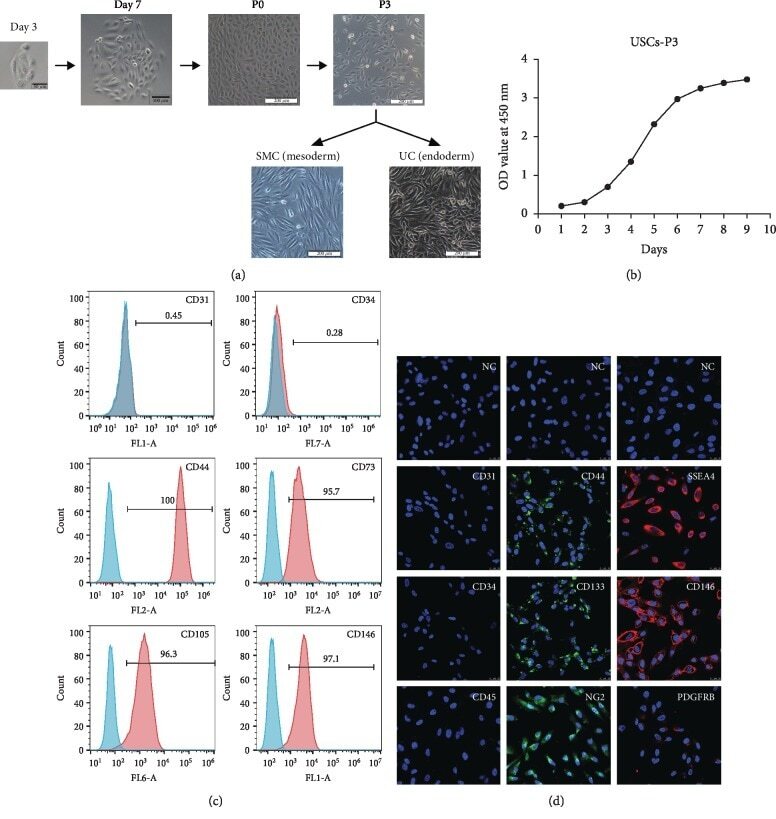
- Figure 1 Growth characteristics of USCs. (a) The morphology of USCs by passage and differentiation. Single, small, compact rice grain-like cells were observed on the third day after initial seeding, and they formed a colony on the seventh day. The cells were considered to be at P0 when the confluence reached 70-80% and were passaged to the next generation. The USCs maintained the rice grain-like morphology after several passages, and USCs from the P3 generation were induced to differentiate into SMCs and UCs. The cells showed an elongated and spindle-shaped morphology after SMC differentiation and a cobblestone-shaped morphology after UC differentiation. Scale bar: 50 mu m, 100 mu m, and 200 mu m. (b) The growth curve of USCs from the P3 generation. (c) Detection of surface markers in USCs using flow cytometry. USCs did not express hematopoietic stem cell markers (CD31: 0.45%, CD34: 0.28%) but expressed MSC markers (CD44: 100%, CD73: 97.1%, and CD105: 96.3%) and pericyte markers (CD146: 95.7%). (d) Detection of surface markers in USCs using IF. USCs did not express hematopoietic stem cell markers (CD31, CD34, and CD45) but did express MSC markers (CD44 and CD133), the ESC marker SSEA4, and pericyte markers (CD146, PDGFRB, and NG2). NC: negative control; PDGFRB: platelet-derived growth factor beta-receptor; NG2: neural/glial antigen 2. Scale bar: 25 mu m.
- Submitted by
- Invitrogen Antibodies (provider)
- Main image

- Experimental details
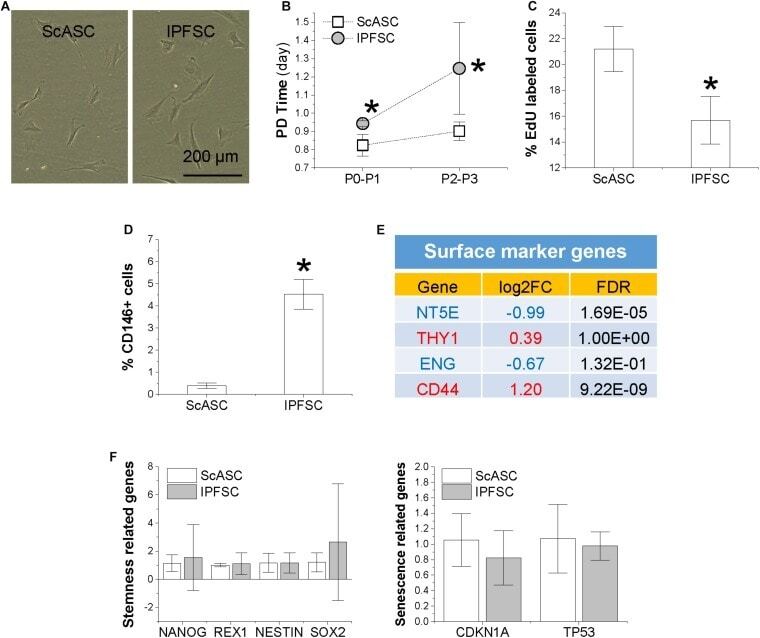
- FIGURE 1 Comparison of proliferation capacity between ScASCs ( n = 4) and donor-matched IPFSCs ( n = 4) in (A) cell morphology; (B) cell population doubling (PD) time calculated by cell counting; (C) relative EdU incorporation; (D) CD146 surface marker expression level evaluated by flow cytometry analysis; (E) other surface marker gene expression levels evaluated by RNA-seq, in which a positive value in log2FC means higher expression in IPFSCs (in red) and a negative value means higher expression in ScASCs (in blue); and (F) stemness-related genes NANOG , REX1 , NESTIN , and SOX2 and senescence-related genes CDKN1A and TP53 measured by qPCR. Data are shown as bar charts. * indicates a significant difference compared to the corresponding control group ( p < 0.05).