Explore
 Validate
 Learn
Learn Flow cytometry
Antibody data
- Antibody Data
- Antigen structure
- References [0]
- Comments [0]
- Validations
- Flow cytometry [1]
- Other assay [19]
Submit
Validation data
Reference
Comment
Report error
- Product number
- 64-9956-42 - Provider product page

- Provider
- Invitrogen Antibodies
- Product name
- HLA-DR Monoclonal Antibody (LN3), Super Bright™ 645, eBioscience™
- Antibody type
- Monoclonal
- Antigen
- Other
- Description
- The LN3 mAb reacts with the human major histocompatibility complex (MHC) class II, HLA-DR. HLA-DR is expressed on the surface of human antigen presenting cells (APC) including B cells, monocytes, macrophages, DCs, and activated T cells. HLA-DR is a heterodimeric transmembrane protein composed of alpha and beta subunits and plays an important role in the presentation of peptides to CD4^+ T lymphocytes. Applications Reported: This LN3 antibody has been reported for use in flow cytometric analysis. Applications Tested: he LN3 antibody has been pre-titrated and tested by flow cytometric analysis of normal human peripheral blood cells. This may be used at 5 µL (0.125 µg) per test. A test is defined as the amount (µg) of antibody that will stain a cell sample in a final volume of 100 µL. Cell number should be determined empirically but can range from 10^5 to 10^8 cells/test. Super Bright 645 is a tandem dye that can be excited with the violet laser line (405 nm) and emits at 645 nm. We recommend using a 660/20 bandpass filter. Please make sure that your instrument is capable of detecting this fluorochrome. When using two or more Super Bright dye-conjugated antibodies in a staining panel, it is recommended to use Super Bright Complete Staining Buffer (Product # SB-4401) to minimize any non-specific polymer interactions. Please refer to the datasheet for Super Bright Staining Buffer for more information. Light sensitivity: This tandem dye is sensitive to photo-induced oxidation. Please protect this vial and stained samples from light. Fixation: Samples can be stored in IC Fixation Buffer (Product # 00-8222) (100 µL of cell sample + 100 µL of IC Fixation Buffer) or 1-step Fix/Lyse Solution (Product # 00-5333) for up to 3 days in the dark at 4°C with minimal impact on brightness and FRET efficiency/compensation. Some generalizations regarding fluorophore performance after fixation can be made, but clone specific performance should be determined empirically. Excitation: 405 nm; Emission: 645 nm; Laser: Violet Laser Super Bright Polymer Dyes are sold under license from Becton, Dickinson and Company.
- Reactivity
- Human
- Host
- Mouse
- Isotype
- IgG
- Antibody clone number
- LN3
- Vial size
- 100 Tests
- Concentration
- 5 µL/Test
- Storage
- 4°C, store in dark, DO NOT FREEZE!
No comments: Submit comment
Supportive validation
- Submitted by
- Invitrogen Antibodies (provider)
- Main image
- Experimental details
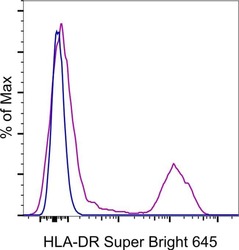
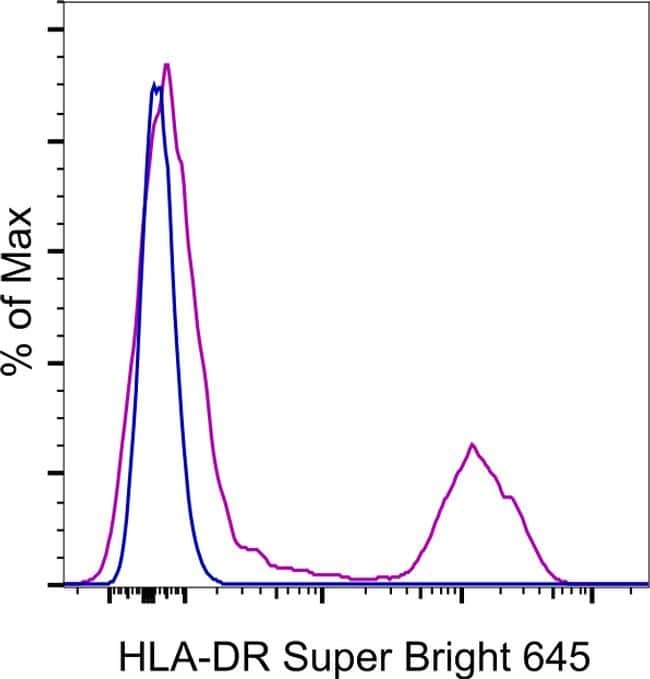
- Normal human peripheral blood cells were stained with HLA-DR Monoclonal Antibody Super Bright 645 (Product # 64-9956-42). Cells in the lymphocyte gate were used for analysis.
Supportive validation
- Submitted by
- Invitrogen Antibodies (provider)
- Main image
- Experimental details
- NULL
- Submitted by
- Invitrogen Antibodies (provider)
- Main image
- Experimental details
- NULL

- Submitted by
- Invitrogen Antibodies (provider)
- Main image
- Experimental details
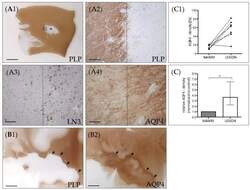
- Figure 2 AQP4 expression in chronic-active multiple sclerosis (MS) lesions. ( A ) Representative MS lesion stained for anti-PLP. The middle part of the image shows a focal white matter demyelinated lesion (star). The area highlighted by the rectangular box in ( A1 ) highlights the border of the white matter lesion and is shown in ( A2 ) in higher magnification. Dotted lines demarcate the border of the lesion. ( A3 ) shows the lesion border of a consecutive section, processed for anti-MHC class II (LN3) immunohistochemistry to label activated microglia and macrophages. ( A4 ) shows the lesion border, processed for anti-AQP4 staining. ( B ) Another representative lesion processed for anti-PLP ( B1 ) and anti-AQP4 ( B2 ) immunohistochemistry. The arrowheads highlight the border of the lesion. Note the highest AQP4 expression levels at the lesion border. Scales: ( A1 , B1 , B2 ) 3 mm, ( A2 - A4 ) 180 um. ( C ) Semi-automated optical density analyses of anti-AQP4 immunoreactivity in demyelinated lesions and normal appearing white matter (NAWM) of the same section. Absolute values are shown in the top row ( C1 ), relative values are shown in the bottom row ( C2 ). Data are shown as median + IQR and tested via Wilcoxon-test; n = 7 per group; ns = not significant, * = p < 0.05.

- Submitted by
- Invitrogen Antibodies (provider)
- Main image
- Experimental details
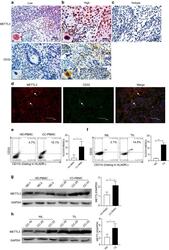
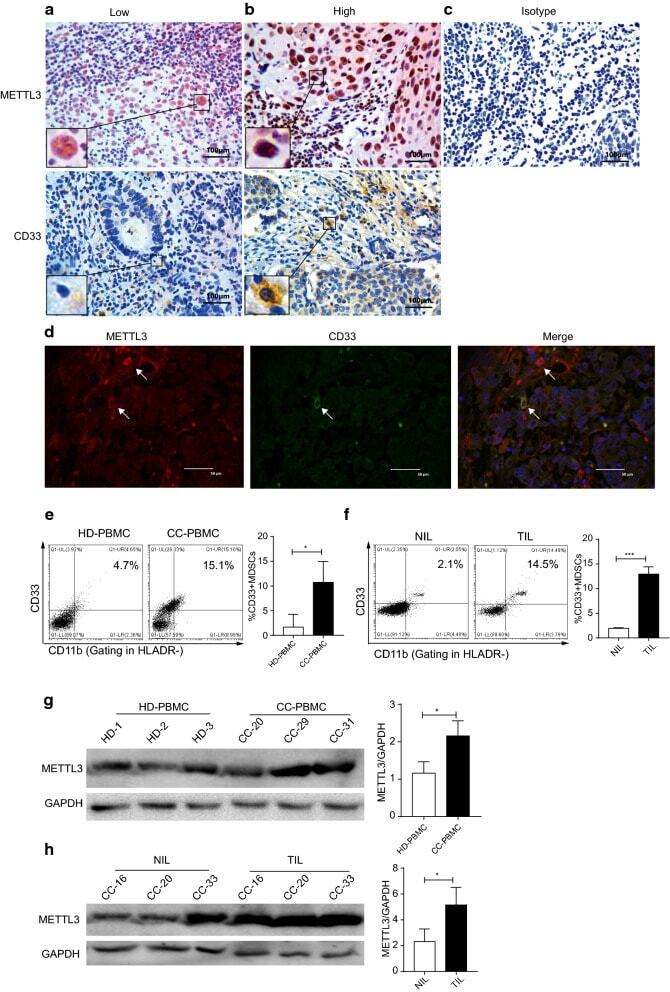
- Fig. 1 METTL3 expression and CD33 + MDSC distribution in patients with CC. a , b The immunohistochemical staining for METL3 and CD33 CC specimens (x 400). c The isotype antibody IgG was included (x 400). d Immunofluorescence staining for METTL3 (red) and CD33 + (green) in CC specimens; the white arrows point to the METTL3 + and CD33 + cells. The images were taken by fluorescence microscope. HLA-DR - CD33 + CD11b + cells were gated by a FACS gating strategy and were defined as MDSCs in this study. e , f Representative density plots showed the MDSC population in the peripheral blood of healthy donors (HD) or CC patients, as well as in the immune cells from tumour tissues (TIL) or tumour-adjacent tissues (NIL). A statistical graph is included for the comparison between the indicated groups. (G-H) Representative immunoblotting shows the expression of METTL3 in the peripheral blood, TILs and NILs. A statistical graph is included for the comparison between the indicated groups. The experiments in e , f were performed at least three times, and the data were plotted as the mean +- SEM. Statistics were conducted with an unpaired Student''s t test, * P < 0.05, and *** P < 0.001 vs. the corresponding control
- Submitted by
- Invitrogen Antibodies (provider)
- Main image
- Experimental details
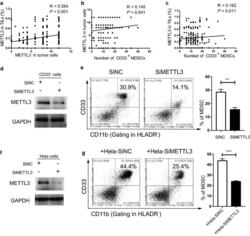
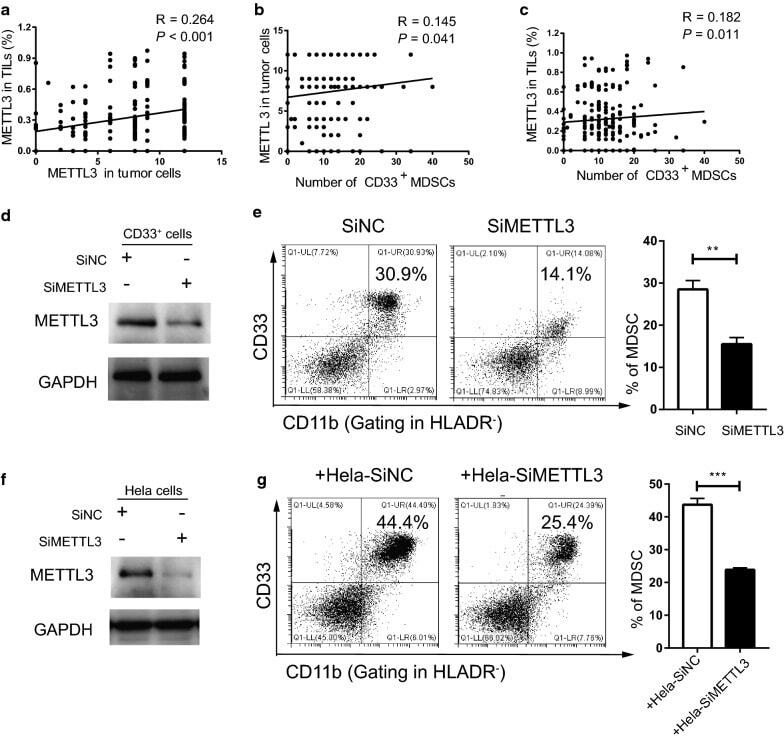
- Fig. 2 Tumour METTL3 level was positively related to intratumoural CD33 + MDSCs in vivo and CC-derived MDSCs in vitro. a The association between METTL3 expression in tumour cells and the expression of METTL3 in TILs (R = 0.264, P < 0.001). b The association between METTL3 expression in tumour cells and intratumoural CD33 + MDSC number (R = 0.145, P = 0.041). c The association between METTL3 expression in TILs and intratumoural CD33 + MDSC number (R = 0.182, P = 0.011). CD33 + cells were isolated from PBMCs of healthy donors with human anti-CD33 beads, and the METTL3 levels in CD33 + cells or HeLa cells were knocked down by siMETTL3. d Immunoblotting showed the METTL3 expression in CD33 + cells with or without METTL3 knockdown. e HLA-DR - CD33 + CD11b + MDSC induction from CD33 + cells in the presence of siMETTL3 or siControl (SiNC). A statistical graph is included for the comparison between the indicated groups. f Immunoblotting showed METTL3 expression in HeLa cells with or without METTL3 knockdown. g Tumour-associated HLA-DR - CD33 + CD11b + MDSC induction from CD33 + cells in coculture with Hela-siMETTL3 or Hela-siControl cells in a Transwell System for 48 h. A statistical graphs is included for the comparison between the indicated groups. Representative flow cytometry density plots (left) and statistical bar chart (right). The statistical analysis was performed using Spearman''s correlation and linear regression. R, Spearman''s correlation, is the correlation coefficient.
- Submitted by
- Invitrogen Antibodies (provider)
- Main image
- Experimental details
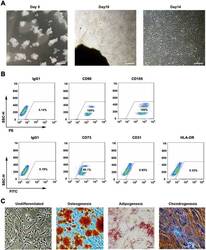
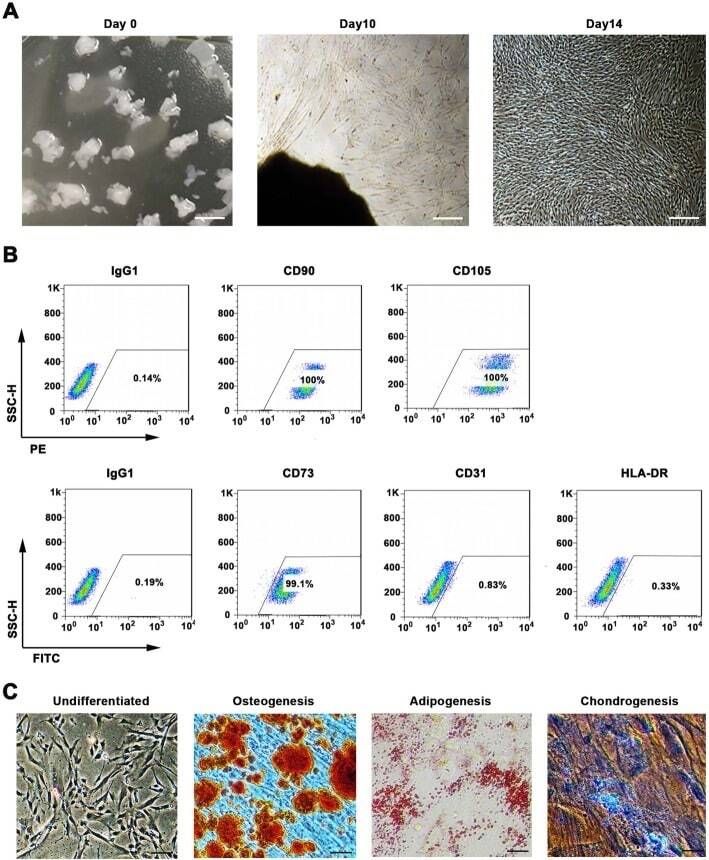
- Fig. 1 WJMSCs isolation and characterization. a Primary cell isolation procedure from Wharton''s jelly tissue. The migrated cells exhibited typical fibroblast-like morphology. Scale bar, 500 mum. b Flow cytometry analysis of P4 cells using mesenchymal stem cell markers (CD90, CD105, CD73), endothelial cell marker (CD31), and MHC class II protein HLA-DR. Isotypic antibodies (IgG1-PE and IgG1-FITC) were used as negative controls. c Representative stained images show that the fourth passage WJMSCs could differentiate into osteocytes (Alizarin Red S), adipocytes (Oil Red O), and chondrocytes (Alcian blue). Scale bar, 100 mum
- Submitted by
- Invitrogen Antibodies (provider)
- Main image
- Experimental details
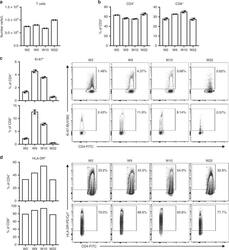
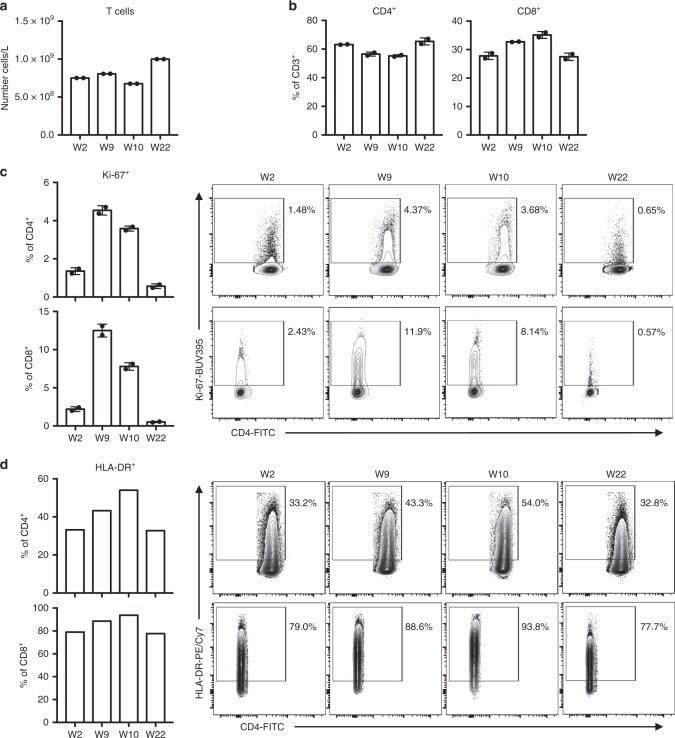
- Fig. 1 T cell activation during allograft loss is ameliorated with ICI-mTORi combination. Peripheral blood mononuclear cells (PBMC) were isolated from the melanoma patient before pembrolizumab therapy and renal transplant rejection (W2), during renal transplant rejection when following two cycles of pembrolizumab therapy (W9), at the height of renal transplant rejection when prednisone therapy was started and pembrolizumab halted (W10), and finally when rejection was resolved, prednisone tapered away and the patient was placed on pembrolizumab and sirolimus combination therapy (W22). PBMC were stained for flow cytometric analysis of various T cells populations. a Total T (CD3 + ) cell numbers in PBMC as determined by flow cytometry are plotted. b Proportions of CD4 + and CD8 + T cells are shown. c , d Proportions of cycling (Ki-67 + ) and activated (HLA-DR + ) cells of CD4 + or CD8 + T cells are shown with the representative flow cytometry plots on the right. a - c were completed in duplicates, mean +- SD are shown. d was completed once
- Submitted by
- Invitrogen Antibodies (provider)
- Main image
- Experimental details
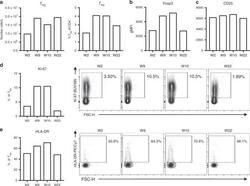
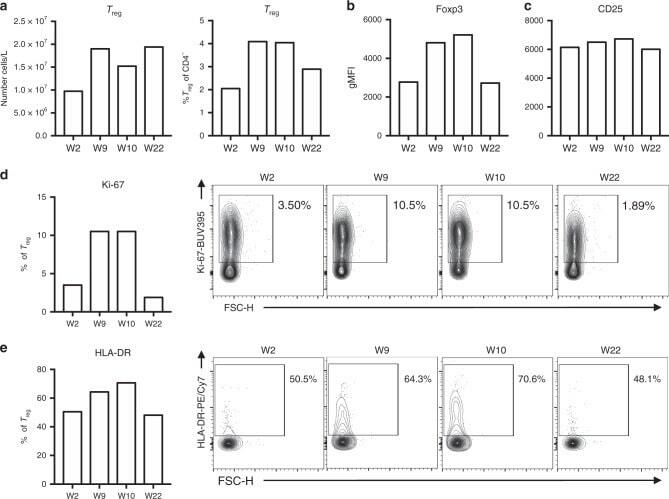
- Fig. 4 Increased T reg cell numbers were maintained in peripheral blood under ICI-mTORi therapy ( a ) T reg cell (CD3 + CD4 + CD25 High CD127 Low Foxp3 + Helios + ) numbers and proportions from total CD4 + T cells in blood are plotted as was determined with flow cytometry. ( b , c ) Geometric mean fluorescence intensity (gMFI) of ( b ) Foxp3 and (C) CD25 on T reg cells are shown. ( d , e ) Proportions of ( d ) cycling (Ki-67 + ) and ( e ) activated (HLA-DR + ) cells of T reg cells are shown with the representative flow cytometry plots on the right. Flow cytometric analyses were completed once
- Submitted by
- Invitrogen Antibodies (provider)
- Main image
- Experimental details
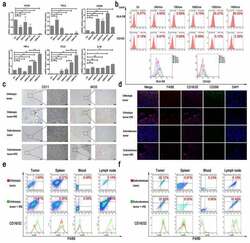
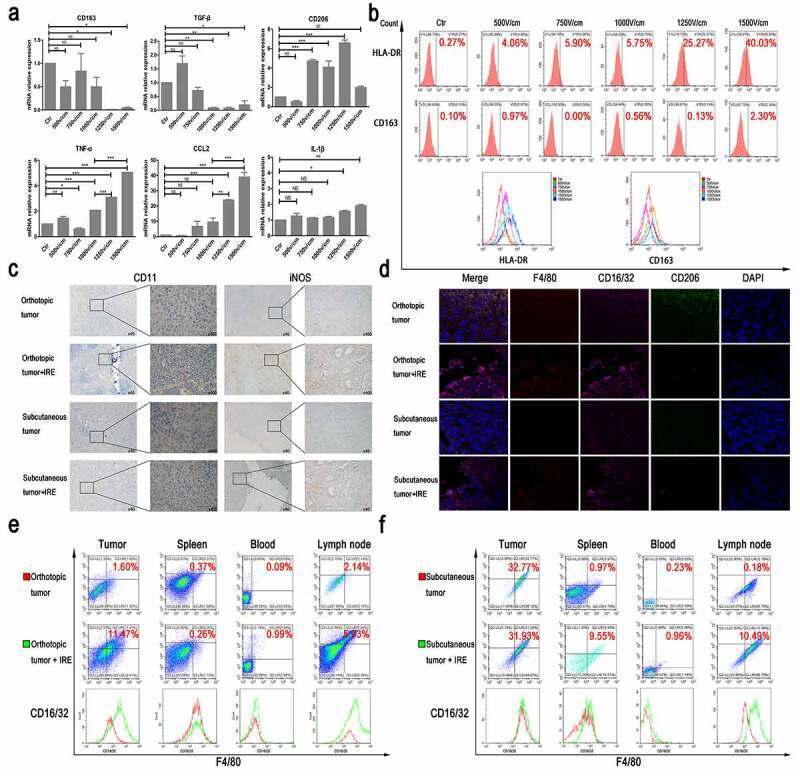
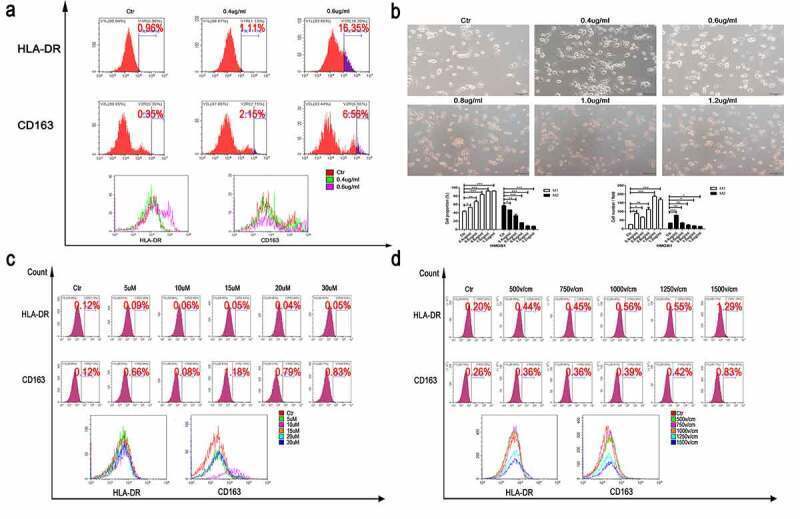
- Figure 2. The effect of TSN on macrophage polarization. (a) The comparisons of mRNA levels of cytokines from THP-1 stimulated by TSN of Panc-1-treated with electric fields. The mRNA levels of M1 markers increased along with the increasing electric fields, while the mRNA levels of M2 markers did not show a continuous increase along with the increasing electric fields. (b) The expression of surface markers of THP-1 stimulated by TSN of Bxpc-3 treated with electric fields. Increased expression of HLA-DR on THP-1 along with the increasing electric fields was observed. (c) IRE could increase infiltration of M1 macrophage in pancreatic tumor tissue (IHC). Orthotopic or subcutaneous tumor tissue was used as control. (d) IRE could increase the expression of CD16/32 in infiltrated macrophages in pancreatic tumor tissue. Orthotopic or subcutaneous tumor tissue was used as control. F4/80 was used to indicate macrophage; CD16/32 was the marker of M1 macrophage; CD206 was the marker of M2 macrophage; DAPI was used to indicate the nuclear of cells. (e) The expression of CD16/32 in macrophage from tumor tissue, spleen, peripheral blood, and lymph node in an orthotopic model of mouse pancreatic cancer after IRE treatment. IRE increased the expression of CD16/32 on the surface of macrophages from these tissues in the orthotopic model of mouse pancreatic cancer. (f) The expression of CD16/32 in macrophages from tumor tissue, spleen, peripheral blood, and lymph node in the subcutaneous model of
- Submitted by
- Invitrogen Antibodies (provider)
- Main image
- Experimental details
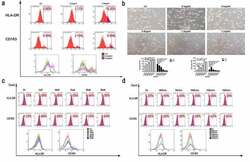
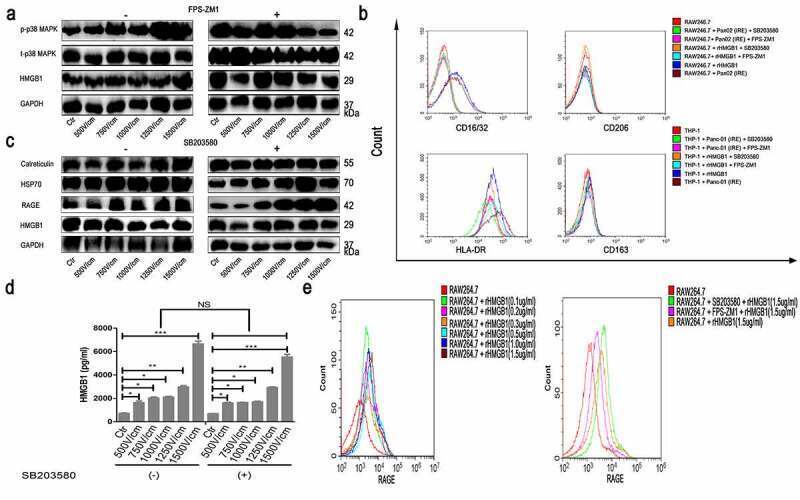
- Figure 3. The effect of rHMGB1 on macrophage polarization. (a) The expression of surface markers of THP-1 stimulated by rHMGB1 with different concentrations for three days. Increased expression of HLA-DR of macrophage under the stimulation of higher doses of rHMGB1, compared with those of lower doses. (b) The morphologic changes of THP-1 stimulated by rHMGB1 with different concentrations for three days. The proportions of round and pancake-like shaped macrophages increased along with the elevated doses of rHMGB1, indicating that HMGB1 could promote the polarization of macrophages. (c) The expression of surface markers of macrophages stimulated by TSN of Panc-1 treated with electric fields after pretreatment with Glycyrrhizic Acid of different concentrations. (d) The expression of surface markers of macrophages stimulated by TSN of Panc-1 treated with electric fields after pretreatment with Glycyrrhizic Acid with a concentration of 10uM. After being treated with Glycyrrhizic Acid with a concentration of 10uM, no significant changes were observed in the expression levels of HLA-DR of macrophages stimulated by TSN of tumor cells treated with electric fields. The inhibitor was added to the cell suspension with the specific concentration 30 minutes prior to electroporation. * p < .05, **, p < .01, ***, p < .001, NS. not significant
- Submitted by
- Invitrogen Antibodies (provider)
- Main image
- Experimental details
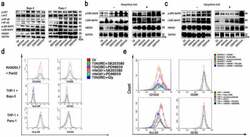
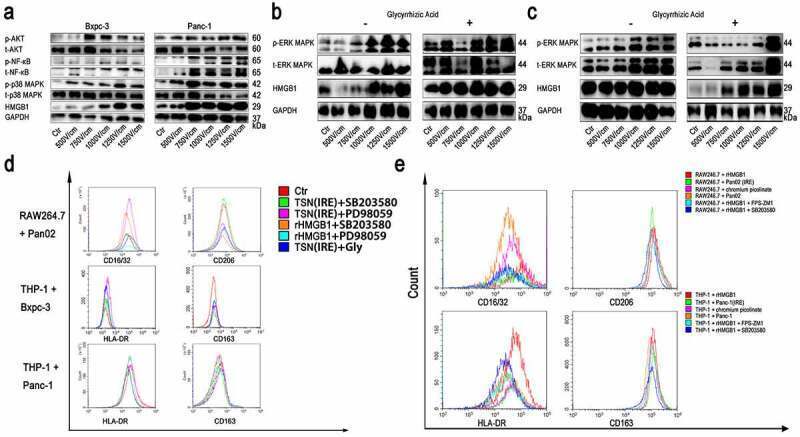
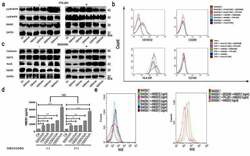
- Figure 4. MAPK-p38 activation is indispensable for the M1 polarization of macrophages. (a) The changes of some signaling pathways of THP-1 stimulated by TSN from Bxpc-3 and Panc-1 treated with electric fields. The western blot analysis demonstrated that expression of MAPK-p38 was increased in THP-1 stimulated by TSN from tumor cells treated with IRE. (b) The changes of MAPK-ERK signaling pathway of THP-1 stimulated by TSN of Panc-1 after the pretreatment with Glycyrrhizic Acid (10uM) or not. The western blot analysis demonstrated that increased expression of MAPK-p38 in THP-1 stimulated by TSN from Panc-1 treated with IRE was inhibited by Glycyrrhizic Acid. (c) The changes of MAPK-ERK signaling pathway of THP-1 stimulated by TSN of Bxpc-3 after the pretreatment with Glycyrrhizic Acid (10uM) or not. The western blot analysis demonstrated that increased expression of MAPK-p38 in THP-1 stimulated by TSN from Bxpc-3 treated with IRE was inhibited by Glycyrrhizic Acid. (d) The expression of surface markers of macrophages stimulated by TSN treated with electric fields after pretreatment with different inhibitors. The increased expression of M1 marker (CD16/32 and HLA-DR) in THP-1 stimulated by rHMGB1 or TSN from tumor cells treated with IRE was inhibited by the inhibitor of MAPK-p38 (SB203580, 10uM), not the inhibitor of MAPK ERK (PD98059, 10uM). (e) The expression of surface markers of macrophages stimulated by chromium picolinate (100 nM). The expression of the M1 marker (CD16/32
- Submitted by
- Invitrogen Antibodies (provider)
- Main image
- Experimental details
- Figure 5. HMGB1 activated MAPK-ERK, inducing increased RAGE expression and release of autocrine HMGB1 in macrophages. (a) The changes of MAPK-p38 signaling pathway of RAW264.7 stimulated by TSN of Pan02 treated with electric fields after pretreatment with FPS-ZM1 (100 nM) or not. The western blot analysis demonstrated that increased expression of MAPK-p38 in THP-1 stimulated by TSN from tumor cells treated with IRE was inhibited by the inhibitor of RAGE (FPS-ZM1, 100 nM). (b) The expression of surface markers of macrophages stimulated by TSN of tumor cells treated with IRE or rHMGB1 after pretreatment with SB203580 or FPS-ZM1. The increased expression of M1 marker (CD16/32 and HLA-DR) in THP-1 stimulated by rHMGB1 or TSN from tumor cells treated with IRE was inhibited by the inhibitor of MAPK-p38 (SB203580, 10uM) and the inhibitor of RAGE (FPS-ZM1, 100 nM). (c) The expression of DAMPs of RAW264.7 stimulated by TSN of Pan02 treated with electric fields after pretreatment with SB203580 or not. The western blot analysis demonstrated that increased expression of RAGE in THP-1 stimulated by TSN from tumor cells treated with IRE was inhibited by the inhibitor of MAPK-p38 (SB203580). (d) The concentration measurement of HMGB1 of THP-1 stimulated by TSN of Panc-1 treated with electric fields after pretreatment with SB203580. The increased self-secretion of HMGB1 of THP-1 stimulated by TSN from tumor cells treated with IRE was not inhibited by the inhibitor of MAPK-p38 (SB203580, 10uM
- Submitted by
- Invitrogen Antibodies (provider)
- Main image
- Experimental details
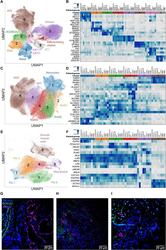
- Fig. 4 Single-cell RNA sequencing of lung tissue from patients with severe COVID-19. ( A , C , and E ) Uniform Manifold Approximation and Projection (UMAP) plots showing individual populations of epithelial cells (A), macrophages (C), and mesenchymal cells (E). ( B , D , and F ) Heatmaps illustrating expression of select marker genes in epithelial cells (B), macrophages (D), and mesenchymal cells (F). Gene expression for the pulmonary fibrosis dataset of Habermann et al. () is shown as an average per condition; gene expression for the end-stage COVID-19 dataset is shown per individual patient. Labels on heatmaps (B, D, and F) correspond to the following samples: Control (H), healthy controls; IPF, idiopathic pulmonary fibrosis samples; Other PF, samples from patients with other forms of pulmonary fibrosis, all from the Habermann et al. dataset. Donor 1, Donor 2, control donor lungs; Case 1, lung transplant case 1; PMB1, PMB2, postmortem lung biopsies from two patients with COVID-19, all from the end-stage COVID-19 dataset. ( G ) Immunofluorescence microscopy revealed KRT17 staining (magenta) of flat epithelial cells resembling alveolar type 1 cells in nonfibrotic lung tissue from a patient who died of COVID-19 (palliative COVID-19). ( H and I ) Immunofluorescence microscopy revealed KRT17 staining (magenta) of distal explanted lung tissue from a patient with COVID-19 undergoing lung transplantation (H) and lung tissue from a patient (PMB1) who died from late-stage severe COVI
- Submitted by
- Invitrogen Antibodies (provider)
- Main image
- Experimental details
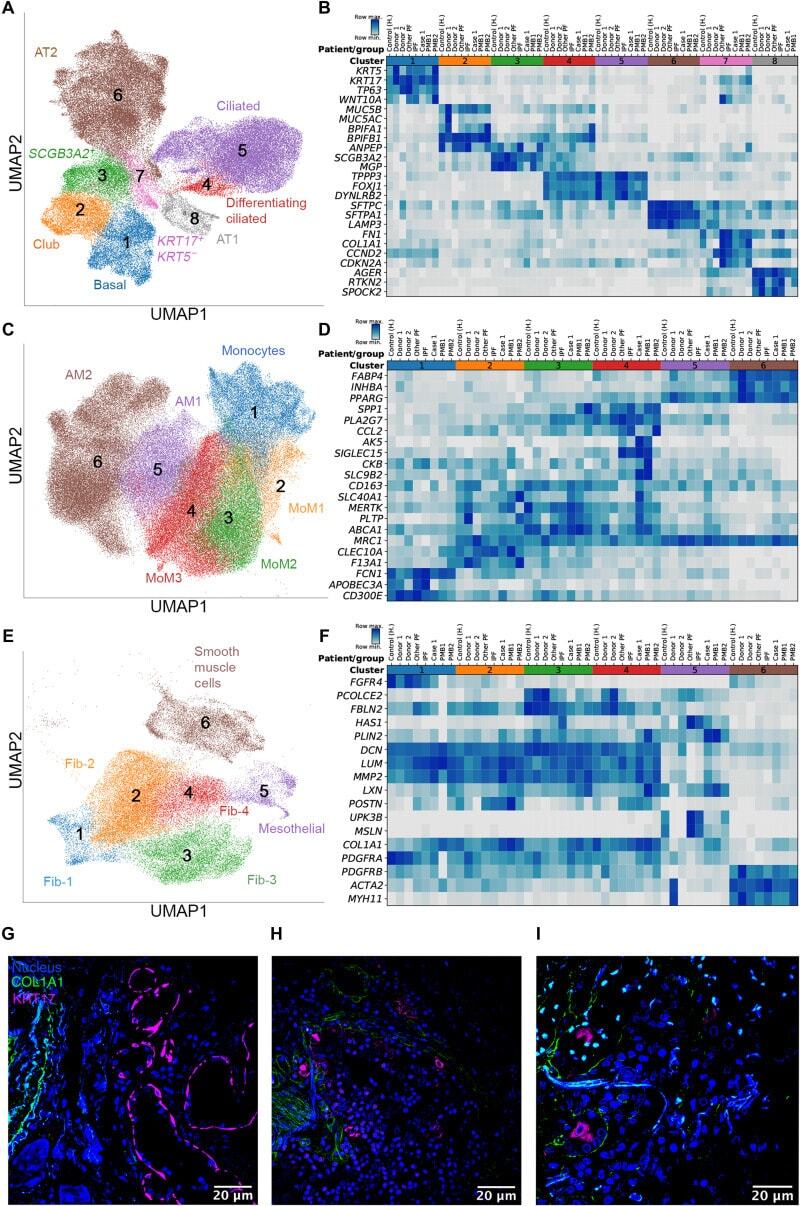
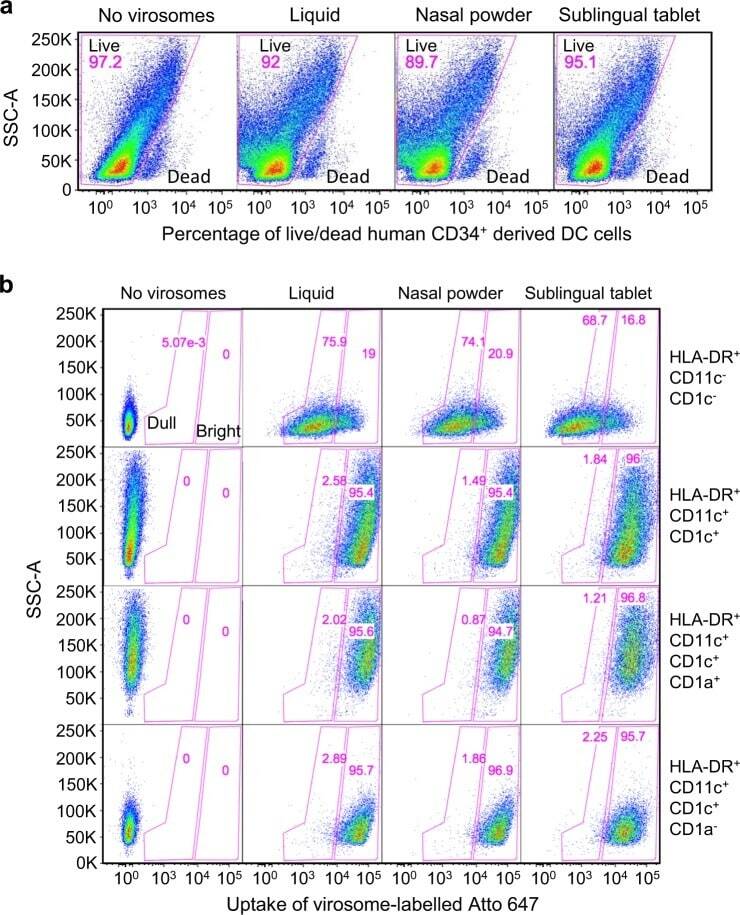
- Fig. 2 In vitro virosome toxicity and uptake by antigen-presenting cells. a Human CD34 + -derived cells in culture were exposed to the various virosome formulations for 1 hour and cells were then stained with LIVE/DEAD dye to determine the percentage of dead cells and cells alive. b Virosomes were labeled with a stable tracer fluorescent lipid labeled with Atto 647 and their uptake after 1 hour by various APC subpopulations defined by markers HLA-DR, CD11c, CD1c, and CD1a were monitored by cytometry, gating on dull and bright virosome signals in pink gates (gating strategy described in Supplementary Methods Fig. 3). Cells that are HLA-DR + CD11c - are not differentiated into dendritic cells and they represent the majority of the population. Cells that are HLA-DR + CD11c + CD1c + CD1a + have a phenotype similar to Langerhans cells, and cells that are HLA-DR + CD11c + CD1c + CD1a - are more similar to dermal DC. The stronger is the fluorescent Atto 647 signal, the more virosome uptake took place. The percentage of Atto 647 positive cells is comparable between cells exposed to the starting liquid formulation and the various solid vaccine dosage forms, suggesting that excipients did not interfere with early virosome uptake by APC. Data are from a representative experiment.
- Submitted by
- Invitrogen Antibodies (provider)
- Main image
- Experimental details
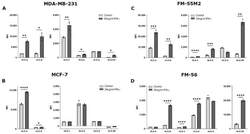
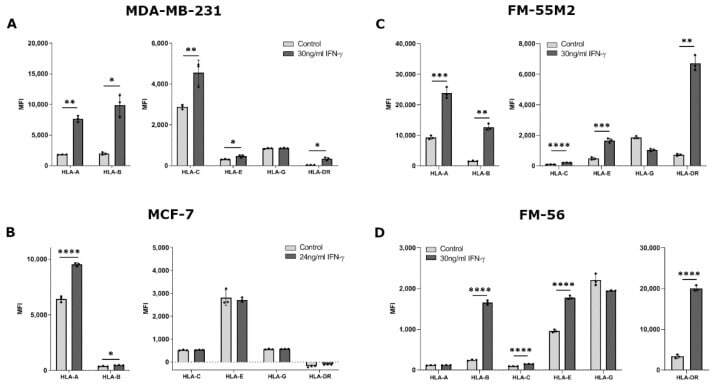
- Figure 2 HLA surface expression on cancer cell lines stimulated with interferon (IFN)-gamma. Flow cytometry analysis of HLA-A, HLA-B, HLA-C, HLA-G, HLA-E, and HLA-DR expression. ( A ) MDA-MB-231 cells treated with 30 ng/mL IFN-gamma for two days. ( B ) MCF-7 cells treated with 24 ng/mL IFN-gamma for two days. ( C ) FM-55M2 cells treated with 30 ng/mL IFN-gamma for two days. ( D ) FM-56 cells treated with 30 ng/mL IFN-gamma for two days. Shown are median fluorescence intensity (MFI) with mean +- SD, each dot represents one sample. All cell lines are HLA-G-negative and the shown MFI level of control samples represent the background. * p < 0.05, ** p < 0.01, *** p < 0.001, **** p < 0.0001 (Student's unpaired t -test with Welch's correction).
- Submitted by
- Invitrogen Antibodies (provider)
- Main image
- Experimental details
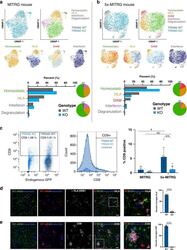
- Fig. 6 Deletion of TREM2 suppresses the development of disease-associated microglia (DAMs) in vivo. UMAP plots from WT and TREM2 knockout microglia transplanted into a a MITRG or b 5x-MITRG mouse. Top left shows the TREM2 genotype of each cell in the plot (gray = WT, blue = TREM2 KO) and the adjacent UMAP shows the clustering of human microglia sub-populations in non-diseased mice. Pie charts highlight the relative distribution of each TREM2 genotype within each cluster. The lower four UMAP plots demonstrate the relative expression of known homeostatic (green), human leukocyte antigen (HLA, yellow), interferon (pink), and DAM (red) markers. Homeostatic: CX3CR1, P2RY12, P2RY13, TMEM119, SALL1. HLA: HLA-DRA, HLA-DRB1, HLA-DRB5, HLA-DPA1, HLA-DPB1, HLA-DMA, HLA-DQA1, HLA-DQA2, HLA-DQB1, CD74. Interferon: IFIT1, IFIT2, ISG15, IFI6, IFITM3, MX1, MX2, STAT1. DAM: CD9, TREM2, SPP1, ITGAX, CD83, APOC1, LGALS3. Bar graphs show relative cluster percentages for each cell type. c Flow cytometry of co-transplanted TREM2 WT and KO microglia. Left dot plot shows GFP positive WT microglia (and GFP negative KO microglia) expression of CD9. Middle plot shows the same data as a histogram pre-split on RFP/GFP expression. As in ( a ), expected % CD9+ cells is around 5-10%. Right plot shows the quantification of all animals n = 6 independent 5x-MITRG mice and 4 MITRG mice. (two way ANOVA with Tukey post hoc test, * p = 0.018; ** p = 0.0099, ns p = 0.916). Data are represented as mean values+-SEM.

- Submitted by
- Invitrogen Antibodies (provider)
- Main image
- Experimental details
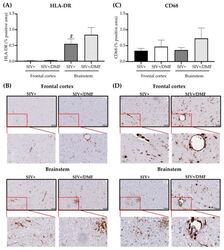
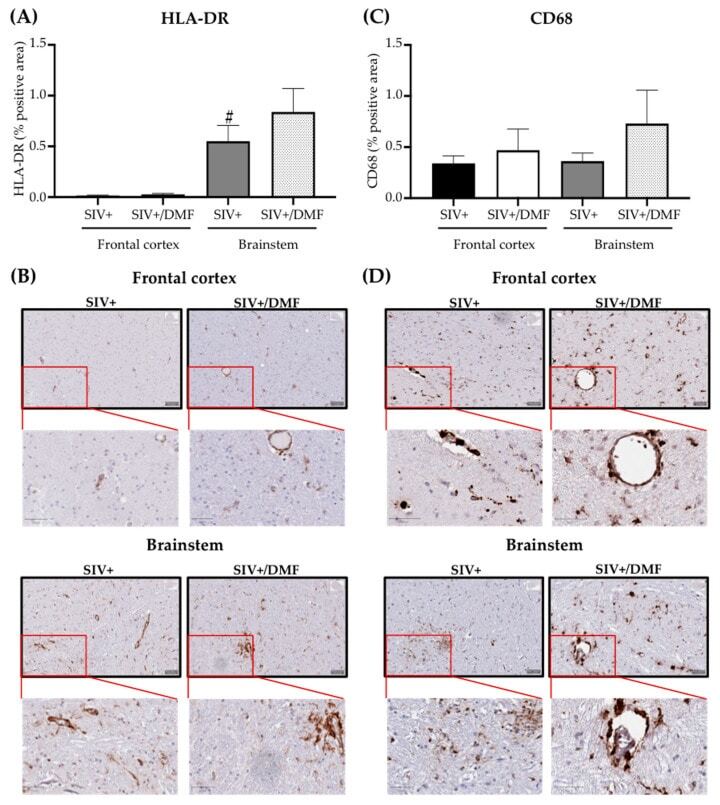
- Figure 13 DMF treatment was not associated with the altered brain expression of HLA-DR (monocyte/microglia activation) or CD68 (monocyte marker). ( A ) Quantification of HLA-DR in the frontal cortex and brainstem. The brainstem showed a higher expression of HLA-DR than the frontal cortex (statistical analysis was done with Student's unpaired t -test, # p < 0.05 comparing the frontal cortex vs. the brainstem in the SIV+ group) and the DMF treatment showed no effect on the HLA-DR expression. ( B ) Representative labeling for HLA-DR in the frontal cortex (top panels) and brainstem (bottom panels). ( C ) Quantification of CD68 in the frontal cortex and brainstem. The DMF treatment showed no effect on the CD68 expression. ( D ) Representative labeling for CD68 in the frontal cortex (top panels) and brainstem (bottom panels). Four contiguous sections from each region were harvested from each animal for labeling with each antibody. Nine SIV-infected rhesus macaques were used in the study (4 untreated animals and 5 DMF-treated (90 mg total DMF daily)). Images from all sections were taken using a digital slide scanner (Aperio AT2, Leica Biosystem, Wetzlar, Germany) at 20x magnification and were analyzed with QuPath software (version 0.2.0-m5), as previously reported []. Quantifications are expressed as the mean percent of positive staining from all the stained areas +- SEM.
- Submitted by
- Invitrogen Antibodies (provider)
- Main image
- Experimental details
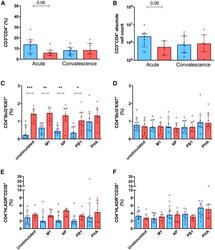
- Figure 2 Peripheral CD4 + T cell profile in the SCs (red, n = 7) and non-SCs (blue, n = 9) during the acute and convalescence phases (A and B) Frequency (A) and (B) number of total CD3 + CD4 + T cells during the acute and convalescence phases. (C-F) Frequency of proliferating (Bcl2 - and Ki67 + ) and activated (HLA-DR + CD38 + ) CD4 + T cells, during the (C and E) acute phase and (D and F) the convalescence phase, respectively. Cells were stimulated overnight with either media (unstimulated), pooled influenza peptides corresponding to the matrix (M1), nucleoprotein (NP), and PB1 protein, or the non-specific mitogen, phytohemagglutinin (PHA). *p < 0.05 and **p < 0.01, ***p < 0.001, by 1-way analysis of variance, with Bonferroni corrections applied for multiple comparisons. Lines and error bars indicate the median and interquartile range.

- Submitted by
- Invitrogen Antibodies (provider)
- Main image
- Experimental details
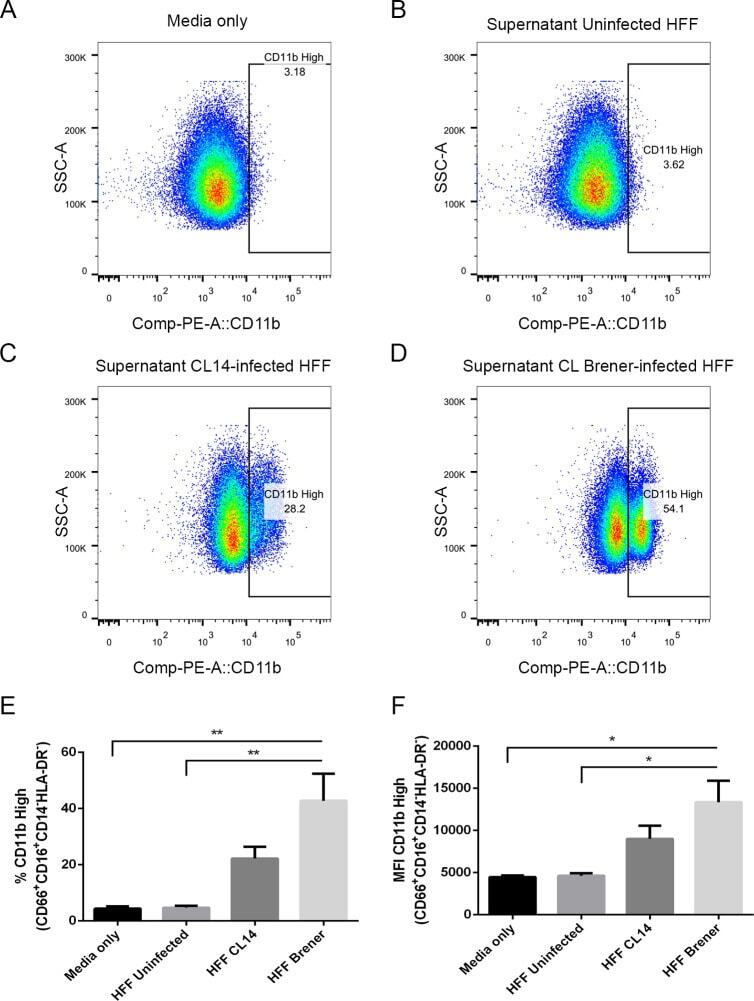
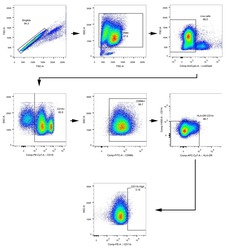
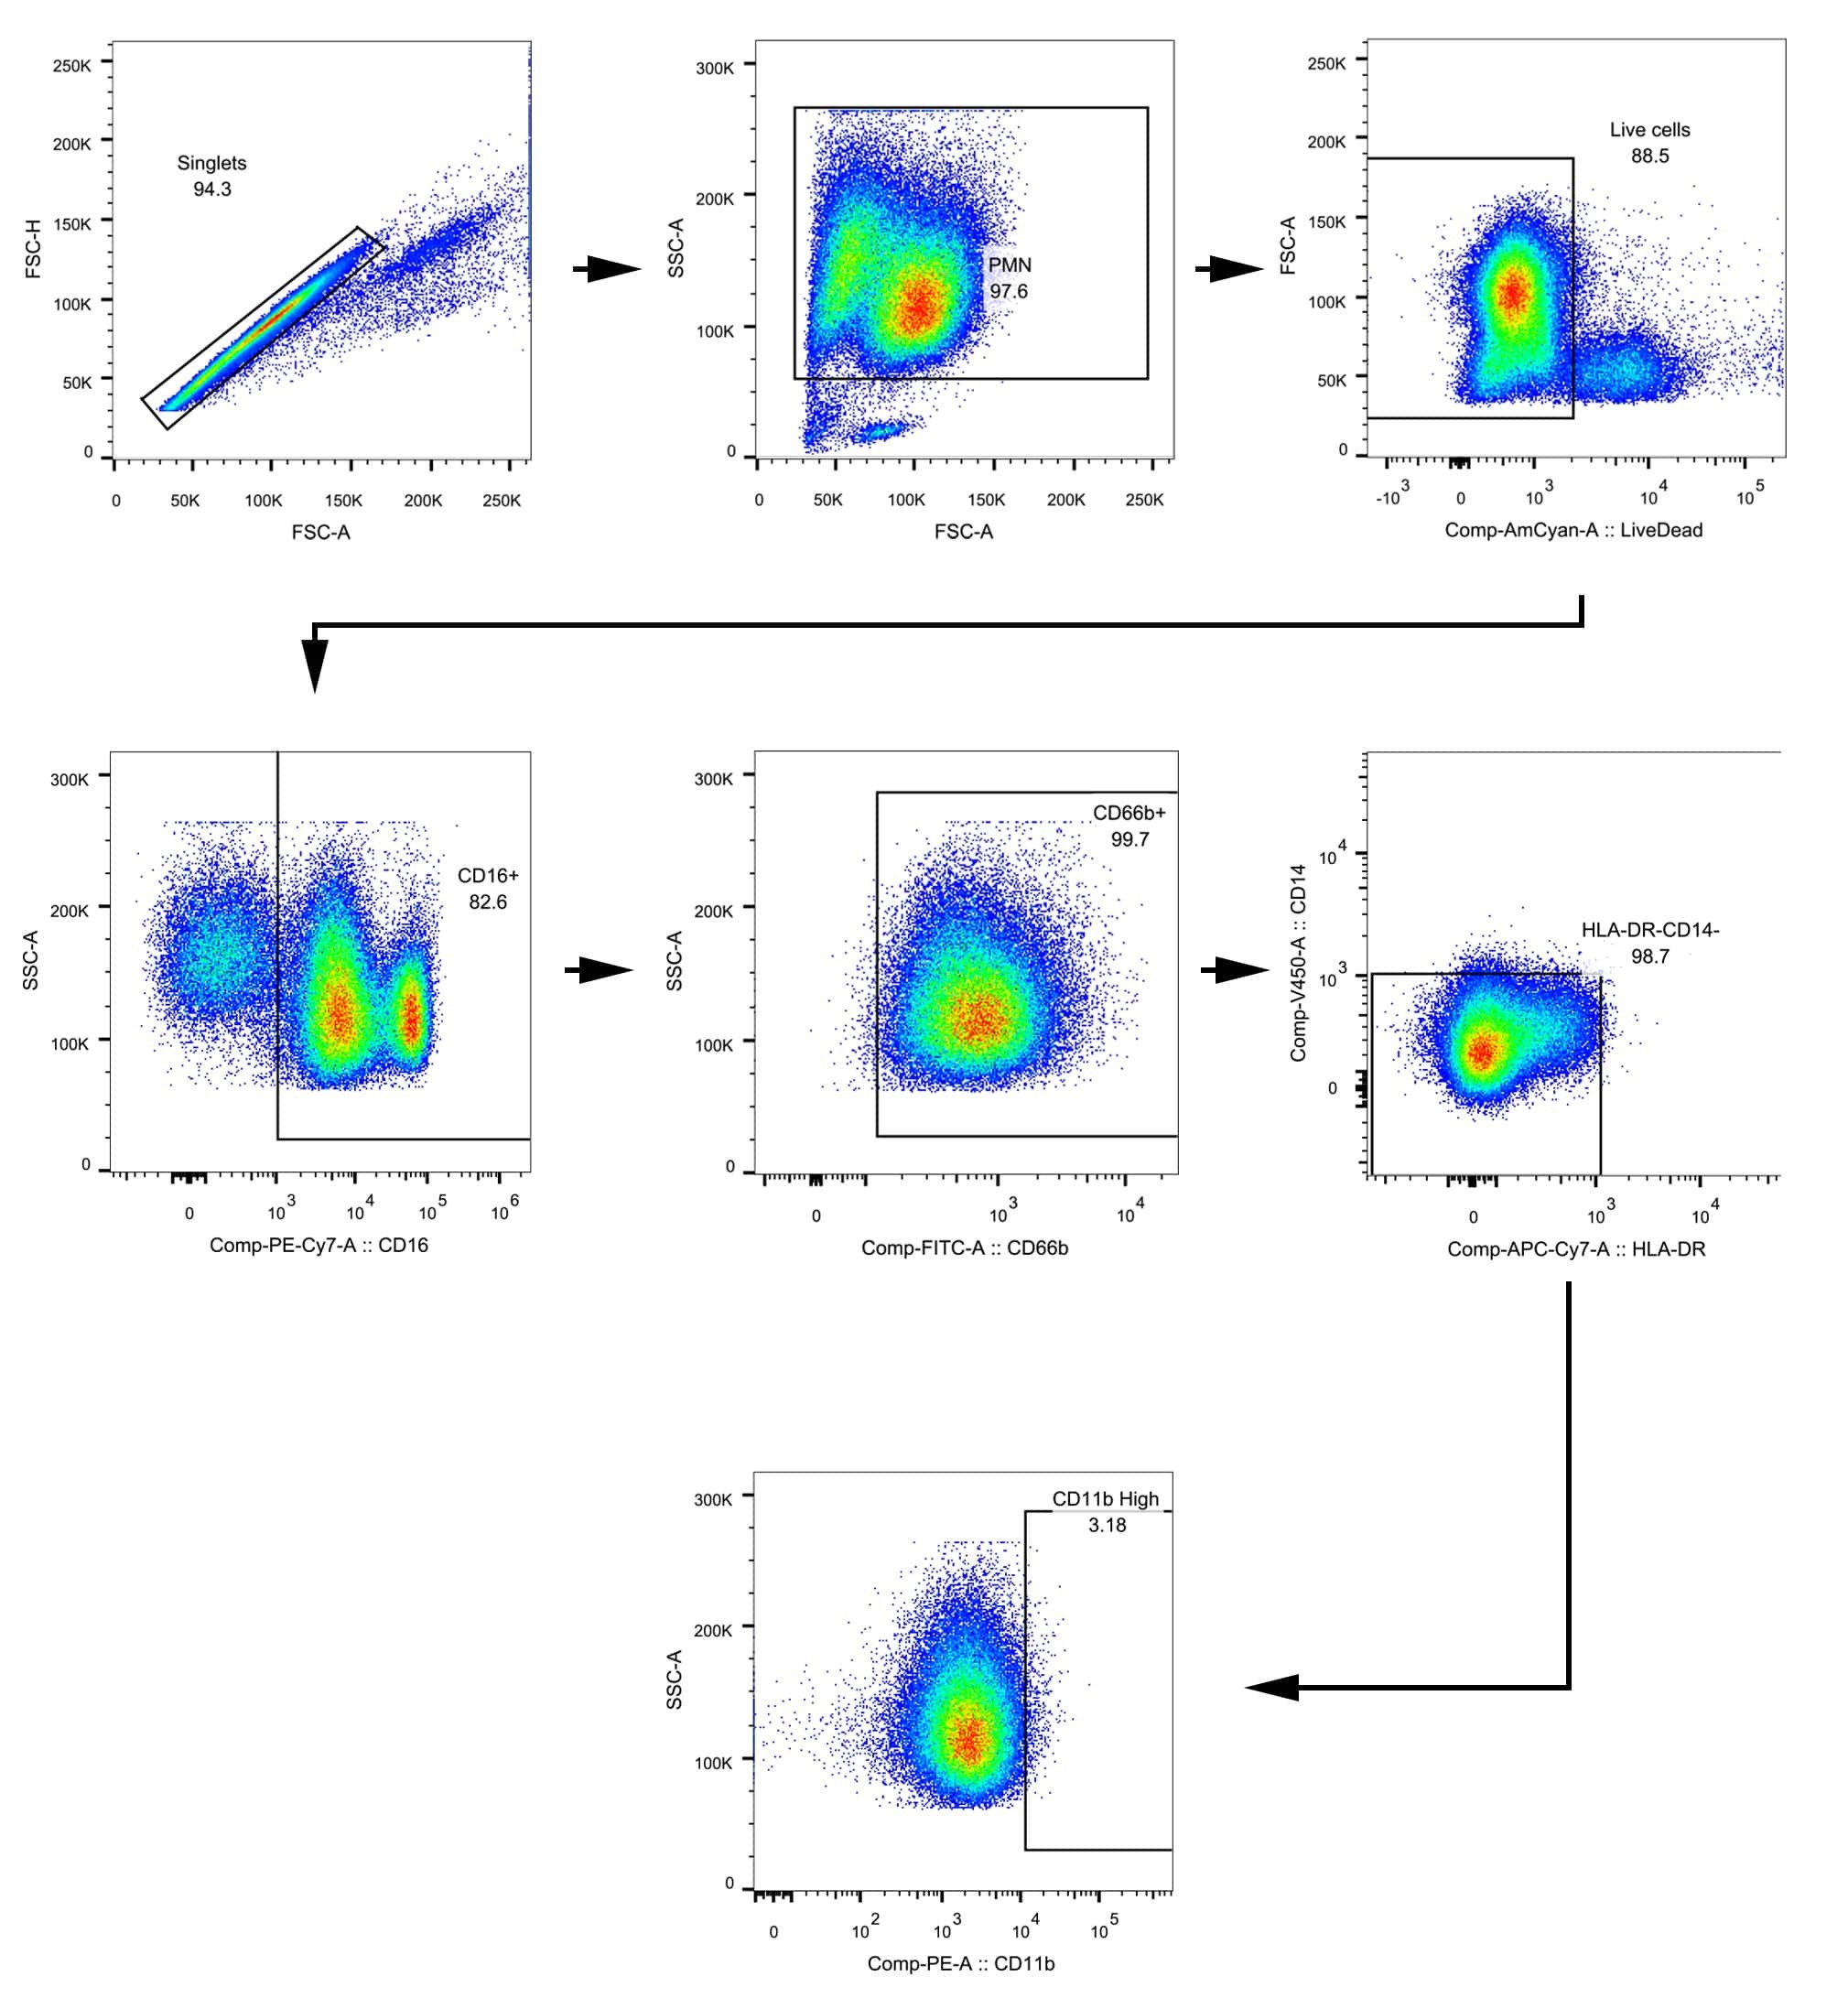
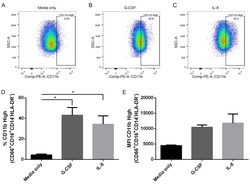
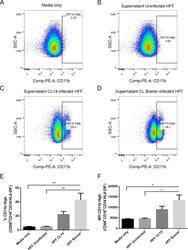
- Fig 6 Human neutrophils incubated with supernatants from T . cruzi -infected HFF cells have enhanced expression of CD11b. Flow cytometry analysis of live neutrophils (CD16 + CD66b + CD14 - HLA-DR - ) incubated for 16 hours with media only (A), supernatants from uninfected HFF cells (B), or supernatants of HFF cells infected for 4 days with T . cruzi CL-14 (C) or CL Brener (D). Percentage of cells expressing high levels of the activation marker CD11b (E) and mean fluorescent intensity (MFI) of CD11b (F). * p < 0.05, ** p < 0.01 (one-way ANOVA with Tukey''s post-test comparing the indicated treatments). (A-D) Images are representative of three independent experiments. (E-F) Data from three independent experiments (mean and s.e.m. ).