Explore
 Validate
 Learn
Learn Flow cytometry
Antibody data
- Antibody Data
- Antigen structure
- References [6]
- Comments [0]
- Validations
- Flow cytometry [1]
- Other assay [2]
Submit
Validation data
Reference
Comment
Report error
- Product number
- 25-2239-42 - Provider product page

- Provider
- Invitrogen Antibodies
- Product name
- CD223 (LAG-3) Monoclonal Antibody (3DS223H), PE-Cyanine7, eBioscience™
- Antibody type
- Monoclonal
- Antigen
- Other
- Description
- Description: This 3DS223H monoclonal antibody recognizes human CD223 also known as Lymphocyte Activation Gene 3 (LAG-3). LAG-3 is a 70-kDa surface glycoprotein belonging to the Ig superfamily with homology to CD4. LAG-3 binds to MHC class II with higher affinity than CD4 and is thought to be involved in the negative regulation of T cell activation and homeostatic proliferation. Surface expression of LAG-3 has been reported on activated T cells (including regulatory T cells) and NK cells. CD8+ T cells usually express LAG-3 at significantly higher levels than CD4+ T cells. Coexpression of LAG-3 and CD49b has been proposed to identify human and mouse Type 1 regulatory T cells (Tr1 cells). This 3DS223H antibody will recognize a formaldehyde-fixed epitope. Applications Reported: This 3DS223H antibody has been reported for use in flow cytometric analysis. Applications Tested: This 3DS223H antibody has been pre-titrated and tested by flow cytometric analysis of stimulated normal human peripheral blood cells. This can be used at 5 µL (0.06 µg) per test. A test is defined as the amount (µg) of antibody that will stain a cell sample in a final volume of 100 µL. Cell number should be determined empirically but can range from 10^5 to 10^8 cells/test. Light sensitivity: This tandem dye is sensitive to photo-induced oxidation. Please protect this vial and stained samples from light. Fixation: Samples can be stored in IC Fixation Buffer (Product # 00-8222) (100 µL of cell sample + 100 µL of IC Fixation Buffer) or 1-step Fix/Lyse Solution (Product # 00-5333) for up to 3 days in the dark at 4°C with minimal impact on brightness and FRET efficiency/compensation. Some generalizations regarding fluorophore performance after fixation can be made, but clone specific performance should be determined empirically. Excitation: 488-561 nm; Emission: 775 nm; Laser: Blue Laser, Green Laser, Yellow-Green Laser. Filtration: 0.2 µm post-manufacturing filtered.
- Reactivity
- Human
- Host
- Mouse
- Isotype
- IgG
- Antibody clone number
- 3DS223H
- Vial size
- 100 Tests
- Concentration
- 5 µL/Test
- Storage
- 4° C, store in dark, DO NOT FREEZE!
Submitted references TIGIT and PD-1 Mark Intratumoral T Cells with Reduced Effector Function in B-cell Non-Hodgkin Lymphoma.
Overcoming Target Driven Fratricide for T Cell Therapy.
OMIP-037: 16-color panel to measure inhibitory receptor signatures from multiple human immune cell subsets.
Differential Inhibitory Receptor Expression on T Cells Delineates Functional Capacities in Chronic Viral Infection.
Exhaustion of Activated CD8 T Cells Predicts Disease Progression in Primary HIV-1 Infection.
Follicular regulatory T cells impair follicular T helper cells in HIV and SIV infection.
Josefsson SE, Beiske K, Blaker YN, Førsund MS, Holte H, Østenstad B, Kimby E, Köksal H, Wälchli S, Bai B, Smeland EB, Levy R, Kolstad A, Huse K, Myklebust JH
Cancer immunology research 2019 Mar;7(3):355-362
Cancer immunology research 2019 Mar;7(3):355-362
Overcoming Target Driven Fratricide for T Cell Therapy.
Breman E, Demoulin B, Agaugué S, Mauën S, Michaux A, Springuel L, Houssa J, Huberty F, Jacques-Hespel C, Marchand C, Marijsse J, Nguyen T, Ramelot N, Violle B, Daro D, De Waele P, Gilham DE, Steenwinckel V
Frontiers in immunology 2018;9:2940
Frontiers in immunology 2018;9:2940
OMIP-037: 16-color panel to measure inhibitory receptor signatures from multiple human immune cell subsets.
Belkina AC, Snyder-Cappione JE
Cytometry. Part A : the journal of the International Society for Analytical Cytology 2017 Feb;91(2):175-179
Cytometry. Part A : the journal of the International Society for Analytical Cytology 2017 Feb;91(2):175-179
Differential Inhibitory Receptor Expression on T Cells Delineates Functional Capacities in Chronic Viral Infection.
Teigler JE, Zelinskyy G, Eller MA, Bolton DL, Marovich M, Gordon AD, Alrubayyi A, Alter G, Robb ML, Martin JN, Deeks SG, Michael NL, Dittmer U, Streeck H
Journal of virology 2017 Dec 1;91(23)
Journal of virology 2017 Dec 1;91(23)
Exhaustion of Activated CD8 T Cells Predicts Disease Progression in Primary HIV-1 Infection.
Hoffmann M, Pantazis N, Martin GE, Hickling S, Hurst J, Meyerowitz J, Willberg CB, Robinson N, Brown H, Fisher M, Kinloch S, Babiker A, Weber J, Nwokolo N, Fox J, Fidler S, Phillips R, Frater J, SPARTAC and CHERUB Investigators
PLoS pathogens 2016 Jul;12(7):e1005661
PLoS pathogens 2016 Jul;12(7):e1005661
Follicular regulatory T cells impair follicular T helper cells in HIV and SIV infection.
Miles B, Miller SM, Folkvord JM, Kimball A, Chamanian M, Meditz AL, Arends T, McCarter MD, Levy DN, Rakasz EG, Skinner PJ, Connick E
Nature communications 2015 Oct 20;6:8608
Nature communications 2015 Oct 20;6:8608
No comments: Submit comment
Supportive validation
- Submitted by
- Invitrogen Antibodies (provider)
- Main image
- Experimental details
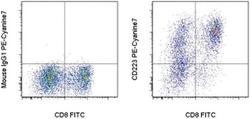
- Normal human peripheral blood cells were stimulated for 3 days with Human IL-2 Recombinant Protein (Product # 14-8029-81), Anti-Human CD3, and Anti-Human CD28 Functional Grade Purifieds (Product # 16-0037-81 and Product # 16-0289-81). These cells were then surface stained with Anti-Human CD8a FITC (Product # 11-0086-42) and Mouse IgG1 K Isotype Control PE-Cyanine7 (Product # 25-4714-80) (left) or Anti-Human CD223 (LAG-3) PE-Cyanine7 (right). Cells in the lymphocyte gate were used for analysis.

Supportive validation
- Submitted by
- Invitrogen Antibodies (provider)
- Main image

- Experimental details
- NULL
- Submitted by
- Invitrogen Antibodies (provider)
- Main image

- Experimental details
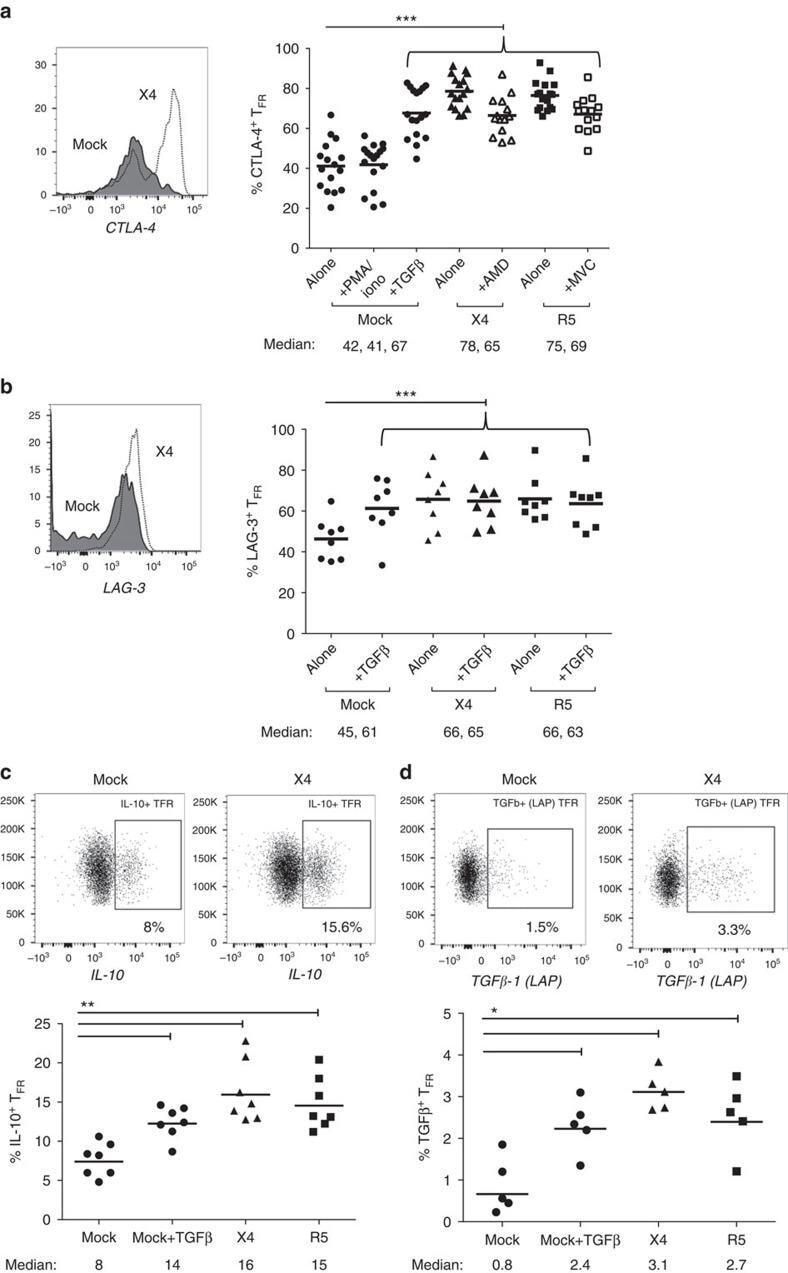
- Figure 6 T FR exhibit an enhanced regulatory phenotype in ex vivo HIV infection. Tonsil cells were mock-, X4-, or R5-spinoculated and cultured under experimental conditions as indicated. T FR were then analysed for expression of regulatory receptors and cytokine production by intracellular cytokine staining. ( a ) Percentage of total (surface and intracellular) T FR CTLA-4 expression ( n =15). ( b ) Percentage of surface T FR LAG-3 expression ( n =8). ( c ) Production of IL-10 by T FR ( n =7). ( d ) Production of TGF-beta-1 (measured as LAP) by T FR ( n =5). The horizontal bars of each graph indicate the median value and are listed where appropriate for clarity. Statistical analyses were performed by Friedman ( a , b ) or Mann-Whitney tests ( c , d ) and significance is denoted by asterisks where * P