Explore
 Validate
 Learn
Learn Other assay
Antibody data
- Antibody Data
- Antigen structure
- References [1]
- Comments [0]
- Validations
- Other assay [3]
Submit
Validation data
Reference
Comment
Report error
- Product number
- PA5-13046 - Provider product page

- Provider
- Invitrogen Antibodies
- Product name
- Phospho-PDX1 (Thr11) Polyclonal Antibody
- Antibody type
- Polyclonal
- Antigen
- Synthetic peptide
- Description
- This antibody is predicted to react with mouse and rat based on sequence homology.
- Reactivity
- Human
- Host
- Rabbit
- Isotype
- IgG
- Vial size
- 400 μL
- Storage
- Store at 4°C short term. For long term storage, store at -20°C, avoiding freeze/thaw cycles.
Submitted references Deficiency in catechol-o-methyltransferase is linked to a disruption of glucose homeostasis in mice.
Kanasaki M, Srivastava SP, Yang F, Xu L, Kudoh S, Kitada M, Ueki N, Kim H, Li J, Takeda S, Kanasaki K, Koya D
Scientific reports 2017 Aug 11;7(1):7927
Scientific reports 2017 Aug 11;7(1):7927
No comments: Submit comment
Supportive validation
- Submitted by
- Invitrogen Antibodies (provider)
- Main image
- Experimental details
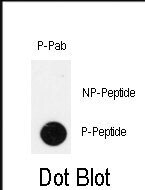
- Dot blot analysis of Phospho-IPF pThr11 polyclonal antibody (Product # PA5-13046) on nitrocellulose membrane. 50 ng of Phospho-peptide or Non Phospho-peptide per dot were adsorbed. Antibody working concentrations are 0.5 µg per mL.

- Submitted by
- Invitrogen Antibodies (provider)
- Main image

- Experimental details
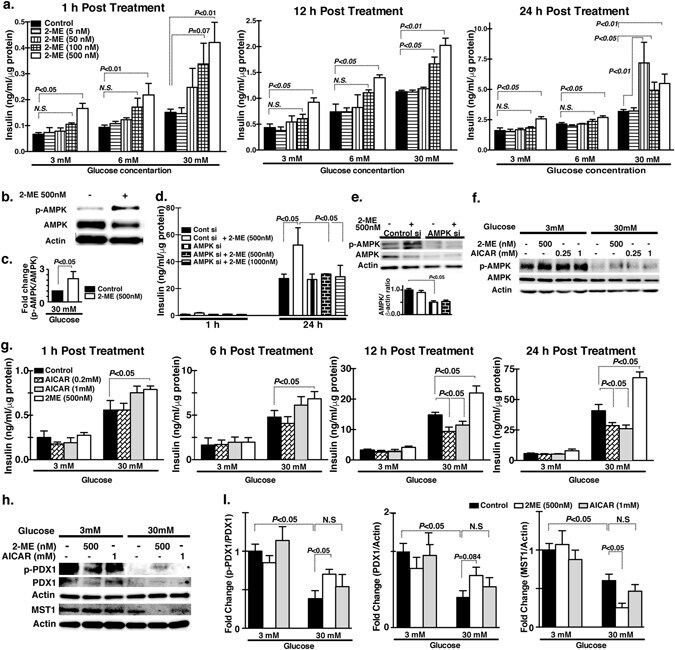
- Figure 6 2-ME induced insulin secretion in MIN6 cells. ( a ) Time-dependent insulin secretion by 2-ME (5, 50, 100 and 500 nM concentrations) at 3 mM, 6 mM and 30 mM medium glucose concentrations. Insulin estimation by the ELISA method performed in triplicate. Three sets of independent experiments were performed. ( b , c ) Western blot data analysis of control and 2-ME-treated MIN6 cells. A representative image of 5 blots is shown. Cropped images were displayed and original blots are shown in the figure Supplementary 14 . Densitometry data were normalized to beta-actin. ( d ) Time-dependent insulin secretion by 2-ME in the scramble and AMPK siRNA transfected MIN6 cells. Scramble and AMPK siRNA were transfected using lipofectamine 2000 at 100 nM concentration in cells. Insulin estimation was performed in triplicate. Three sets of independent experiments were analyzed. ( e ) Western blot analysis of total AMPK and AMPK phosphorylation protein levels in the scramble and AMPK siRNA transfected MIN6 cells. A representative image from 5 blots is shown. Cropped images were displayed and original blots are shown in the figure Supplementary 14 . Densitometry data normalized to beta-actin. ( f ) Western blot analysis of total AMPK and AMPK phosphorylation after treatment with 2-ME and AICAR at 3 mM glucose and 30 mM glucose concentration. A representative image from 4 blots is shown. Cropped images were displayed and original blots are shown in the figure Supplementary 15 . ( g ) Tim
- Submitted by
- Invitrogen Antibodies (provider)
- Main image

- Experimental details
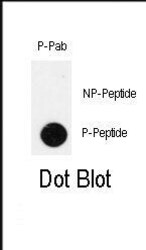
- Dot blot analysis of Phospho-PDX1 (Thr11). Samples were incubated with Phospho-PDX1 (Thr11) polyclonal antibody (Product # PA5-13046) using a dilution of 0.5 µg/mL. 50 ng of Phospho-peptide or Non Phospho-peptide per dot were adsorbed on nitrocellulose membrane.