Explore
 Validate
 Learn
Learn Western blot
 Other assay
Antibody data
- Antibody Data
- Antigen structure
- References [1]
- Comments [0]
- Validations
- Other assay [1]
Submit
Validation data
Reference
Comment
Report error
- Product number
- PA5-22966 - Provider product page

- Provider
- Invitrogen Antibodies
- Product name
- GLUT9 Polyclonal Antibody
- Antibody type
- Polyclonal
- Antigen
- Synthetic peptide
- Description
- Cross-reactivity with human samples is very low. Suggested positive control: human kidney membrane protein.
- Reactivity
- Human, Mouse
- Host
- Rabbit
- Isotype
- IgG
- Vial size
- 100 µL
- Concentration
- 1 mg/mL
- Storage
- Store at 4°C short term. For long term storage, store at -20°C, avoiding freeze/thaw cycles.
Submitted references Hereditary hemochromatosis disrupts uric acid homeostasis and causes hyperuricemia via altered expression/activity of xanthine oxidase and ABCG2.
Ristic B, Sivaprakasam S, Narayanan M, Ganapathy V
The Biochemical journal 2020 Apr 30;477(8):1499-1513
The Biochemical journal 2020 Apr 30;477(8):1499-1513
No comments: Submit comment
Supportive validation
- Submitted by
- Invitrogen Antibodies (provider)
- Main image

- Experimental details
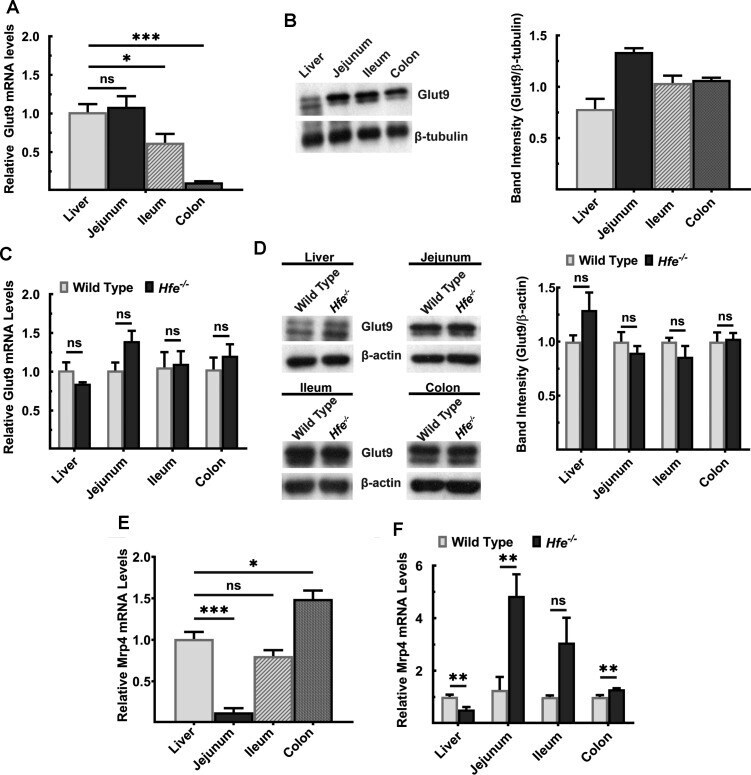
- Figure 3. Expression of Glut9 and MRP4 in wild type and Hfe -/- mouse liver and intestinal tract. ( A ) Quantitative PCR analysis of Glut9 mRNA in liver and intestinal segments of wild-type mouse. Data show mean values +- SEM relative to liver, which is taken as 1. * P < 0.05; *** P < 0.001. ( B ) Western blot for Glut9 protein levels in liver and intestinal segments of the wild-type mouse. Western blot band intensities were estimated using ImageJ software and the band intensities were normalized to the respective beta-tubulin band intensities. Please see Supplementary Figures S5 and S10 for full blot images. ( C ) Quantitative PCR of Glut9 mRNA in liver, jejunum, ileum, and colon of Hfe -/- mice and wild-type mice. Data show mean values of three mice per group +- SEM relative to control mice. ( D ) Western blot for Glut9 protein levels in Hfe -/- mouse and wild-type mouse liver, jejunum, ileum, and colon. Western blot band intensities were estimated using ImageJ software and the band intensities were normalized to the respective beta-actin band intensities. Please see Supplementary Figures S8, S9, and S11 for full blot images. ( E ) Quantitative PCR analysis of Mrp4 mRNA in liver and intestinal segments of wild-type mouse. Data show mean values +- SEM relative to liver, which is taken as 1. * P < 0.05; *** P < 0.001. ( F ) Quantitative PCR analysis of Mrp4 mRNA in liver, jejunum, ileum, and colon of Hfe -/- mice and wild-type mice. Data show mean values of three mice per gro