 Explore
 Validate
 Learn
Learn Western blot
 Immunohistochemistry
Antibody data
- Antibody Data
- Antigen structure
- References [2]
- Comments [0]
- Validations
- Immunohistochemistry [3]
- Other assay [5]
Submit
Validation data
Reference
Comment
Report error
- Product number
- PA5-43160 - Provider product page

- Provider
- Invitrogen Antibodies
- Product name
- GADD45B Polyclonal Antibody
- Antibody type
- Polyclonal
- Antigen
- Synthetic peptide
- Description
- Peptide sequence: FCCDNDINIV RVSGMQRLAQ LLGEPAETQG TTEARDLHCL LVTNPHTDAW Sequence homology: Cow: 100%; Dog: 100%; Guinea Pig: 92%; Horse: 100%; Human: 100%; Mouse: 100%; Pig: 100%; Rat: 100%
- Reactivity
- Human, Mouse
- Host
- Rabbit
- Isotype
- IgG
- Vial size
- 100 μL
- Concentration
- 0.5 mg/mL
- Storage
- -20°C, Avoid Freeze/Thaw Cycles
Submitted references GADD45B Promotes Glucose-Induced Renal Tubular Epithelial-Mesenchymal Transition and Apoptosis via the p38 MAPK and JNK Signaling Pathways.
Gadd45b Acts as Neuroprotective Effector in Global Ischemia-Induced Neuronal Death.
Xue M, Sun H, Xu R, Wang Y, Guo J, Li X, Cheng Y, Xu C, Tang C, Sun B, Chen L
Frontiers in physiology 2020;11:1074
Frontiers in physiology 2020;11:1074
Gadd45b Acts as Neuroprotective Effector in Global Ischemia-Induced Neuronal Death.
Cho CH, Byun HR, Jover-Mengual T, Pontarelli F, Dejesus C, Cho AR, Zukin RS, Hwang JY
International neurourology journal 2019 Feb;23(Suppl 1):S11-21
International neurourology journal 2019 Feb;23(Suppl 1):S11-21
No comments: Submit comment
Supportive validation
- Submitted by
- Invitrogen Antibodies (provider)
- Main image
- Experimental details
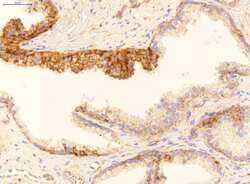
- Immunohistochemistry analysis of human prostate cancer cells using an anti-GADD45B polyclonal antibody (Product # PA5-43160). Primary Antibody Dilution: 2 µg/mL.

- Submitted by
- Invitrogen Antibodies (provider)
- Main image
- Experimental details
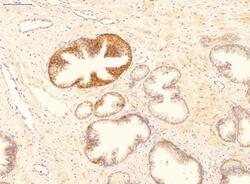
- Immunohistochemistry analysis of human prostate cancer cells using an anti-GADD45B polyclonal antibody (Product # PA5-43160). Primary Antibody Dilution: 2 µg/mL.

- Submitted by
- Invitrogen Antibodies (provider)
- Main image

- Experimental details
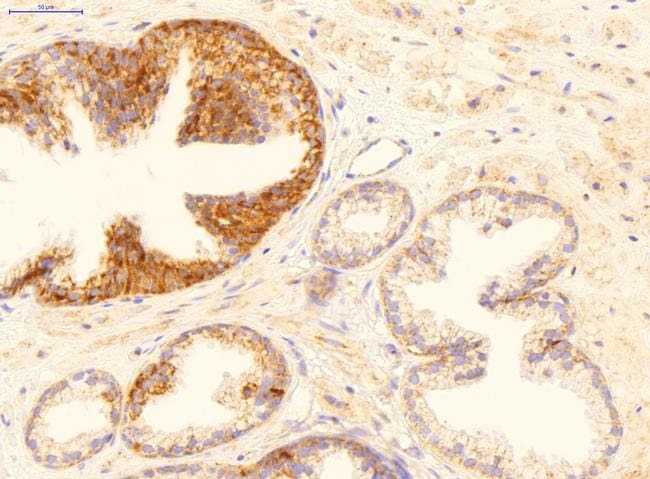
- Immunohistochemistry analysis of human prostate cancer cells using an anti-GADD45B polyclonal antibody (Product # PA5-43160). Primary Antibody Dilution: 2 µg/mL.
Supportive validation
- Submitted by
- Invitrogen Antibodies (provider)
- Main image

- Experimental details
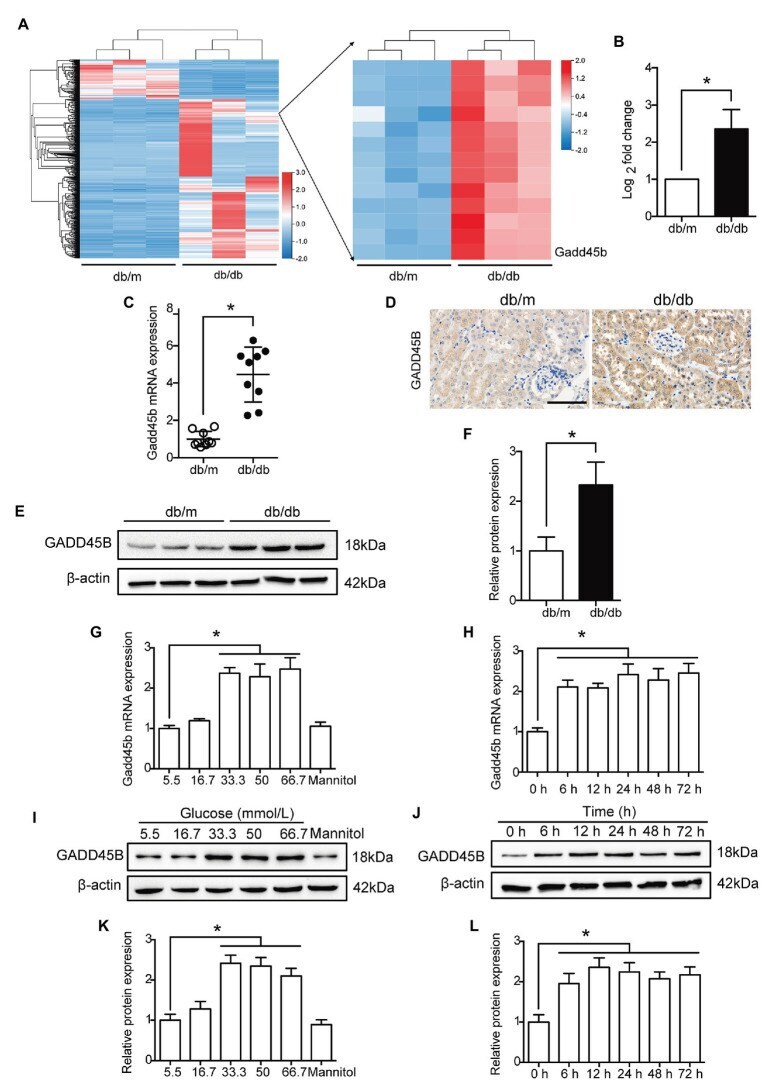
- Figure 2 The expression of growth arrest and DNA damage-inducible beta (GADD45B) was increased in the kidneys of db/db mice and HG-induced HK-2 cells. (A) Heat map of the 1,194 differentially expressed genes (the logarithm of the fold change to base 2 > 2) and the right part is the enlarged view containing GADD45B. (B) The logarithm of the fold change to base 2 of GADD45B expression was determined by RNA sequencing analysis. (C) Real-time PCR (RT-PCR) analysis of GADD45B messenger RNA (mRNA) expression in kidney samples, N = 9. (D) Representative images of immunohistochemical staining of GADD45B in kidney sections. Original magnification = 400. Scale bar = 100 mum. (E,F) Western blot bands and quantitative analysis of GADD45B protein expression in kidney samples, N = 6. (G,H) RT-PCR analysis of GADD45B mRNA expression in HK-2 cells, N = 3. (I-L) Western blot bands and quantitative analysis of GADD45B protein expression in HK-2 cells, N = 3. The data are presented as the mean +- SD. * p < 0.05.
- Submitted by
- Invitrogen Antibodies (provider)
- Main image
- Experimental details
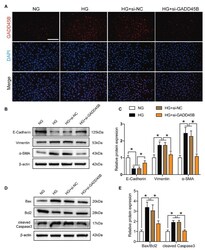
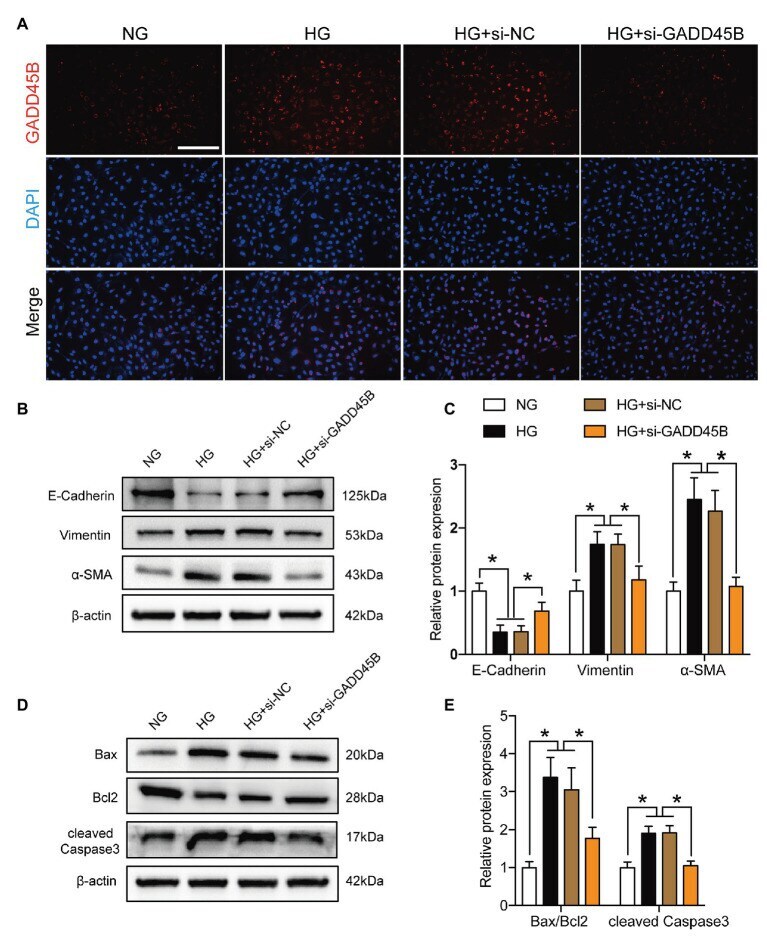
- Figure 3 Effects of GADD45B knockdown on renal tubular epithelial-mesenchymal transition (EMT) and apoptosis in HK-2 cells under high glucose (HG) conditions. (A) Representative images of immunofluorescence staining of GADD45B in HK-2 cells. Original magnification = 200. Scale bar = 200 mum. (B) Western blot bands showing E-cadherin, Vimentin, and alpha-smooth muscle actin (alpha-SMA) protein expression in HK-2 cells. (C) Quantitative analysis of (B) , N = 3. (D) Western blot bands showing Bax, Bcl2, and cleaved Caspase 3 protein expression in HK-2 cells. (E) Quantitative analysis of (D) , N = 3. The data are presented as the mean +- SD. * p < 0.05.
- Submitted by
- Invitrogen Antibodies (provider)
- Main image
- Experimental details
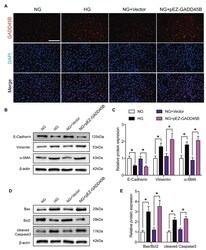
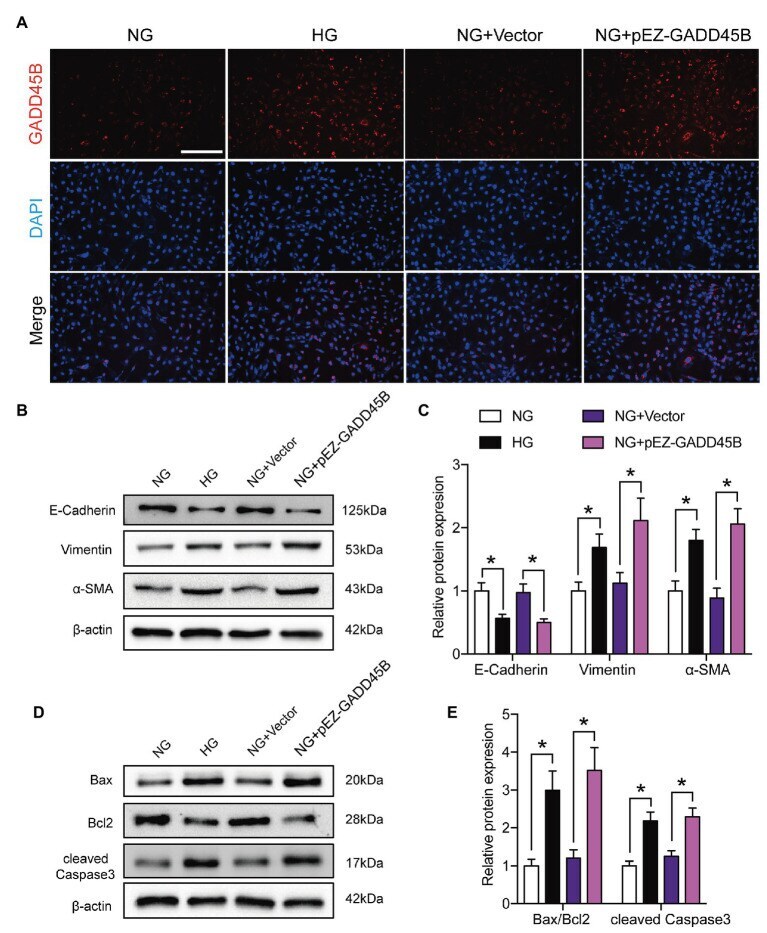
- Figure 4 Effects of GADD45B overexpression on renal tubular EMT and apoptosis in HK-2 cells. (A) Representative images of immunofluorescence staining of GADD45B in HK-2 cells. Original magnification = 200. Scale bar = 200 mum. (B) Western blot bands showing E-cadherin, Vimentin, and alpha-SMA protein expression in HK-2 cells. (C) Quantitative analysis of (B) , N = 4. (D) Western blot bands showing Bax, Bcl2, and cleaved Caspase 3 protein expression in HK-2 cells. (E) Quantitative analysis of (D), N = 4. The data are presented as the mean +- SD. * p < 0.05.
- Submitted by
- Invitrogen Antibodies (provider)
- Main image

- Experimental details
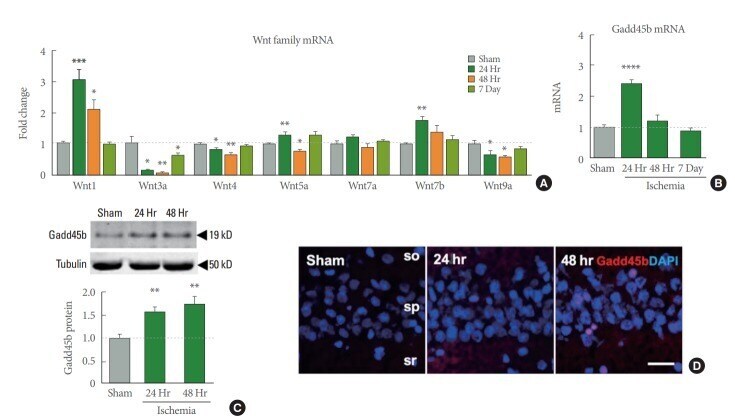
- Fig. 4. Changes of neuroprotective molecules after global ischemia. (A) Wnt family mRNA expression showing time-dependent alterations in ischemia hippocampal CA1 regions as determined by quantitative real time-polymerase chain reaction (qRT-PCR). (B) Growth arrest and DNA-damage-inducible protein 45 beta (Gadd45b) mRNA expression quantified by qRT-PCR. (C) Representative immunoblot images of Gadd45b in hippocampal CA1 with complementary quantifications normalized by tubulin (n=7 for sham, 4 for ischemia 24- and 48-hour animals). Values represent mean +-standard error of the mean (*P
- Submitted by
- Invitrogen Antibodies (provider)
- Main image
- Experimental details
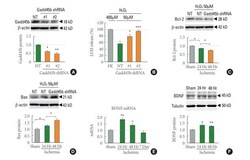
- Fig. 5. Knockdown of growth arrest and DNA-damage-inducible protein 45 beta (Gadd45b) accelerates neuronal cell death and mitochondrial dysfunction. (A) Validation of knockdown efficiency for Gadd45b shRNA in cortical neurons by immunoblotting. (B) Summary data of lactate dehydrogenase (LDH) activity assay for cortical neurons treated with 50uM H 2 O 2 (2 hours) in the presence of nontargeting (NT) or Gadd45b shRNA. LDH activity values are normalized to the value of cells exposed to 400muM H 2 O 2 (100%, FK; full kill) after subtracting the value of control cells (0%). (C) Representative immunoblot images showing Bcl-2. (D) Bax expression level in cortical neurons treated with 50uM H 2 O 2 (2 hours) in the presence of NT or Gadd45b shRNA. (E) Quantitative real timepolymerase chain reaction data showing brain-derived neurotrophic factor (BDNF) mRNA expression at indicated time periods after ischemia. (F) Representative immunoblot images Gadd45b in hippocampal CA1 and summary data. (n=7 for sham, 4 for ischemia 24- and 48-hour animals). Values represent mean+-standard error of themean. *P
