Explore
 Validate
 Learn
Learn Western blot
 Immunocytochemistry
Antibody data
- Antibody Data
- Antigen structure
- References [2]
- Comments [0]
- Validations
- Immunocytochemistry [2]
- Immunohistochemistry [2]
- Other assay [3]
Submit
Validation data
Reference
Comment
Report error
- Product number
- PA5-29488 - Provider product page

- Provider
- Invitrogen Antibodies
- Product name
- HMGCS1 Polyclonal Antibody
- Antibody type
- Polyclonal
- Antigen
- Recombinant full-length protein
- Description
- Recommended positive controls: 293T, A431, HeLa, HepG2, Mouse liver. Predicted reactivity: Mouse (97%), Rat (97%), Pig (95%), Chicken (82%), Rhesus Monkey (99%), Bovine (96%). Store product as a concentrated solution. Centrifuge briefly prior to opening the vial.
- Reactivity
- Human, Mouse
- Host
- Rabbit
- Isotype
- IgG
- Vial size
- 100 μL
- Concentration
- 0.39 mg/mL
- Storage
- Store at 4°C short term. For long term storage, store at -20°C, avoiding freeze/thaw cycles.
Submitted references Transcriptional and Histochemical Signatures of Bone Marrow Mononuclear Cell-Mediated Resolution of Synovitis.
The thrombin receptor links brain derived neurotrophic factor to neuron cholesterol production, resiliency and repair after spinal cord injury.
Menarim BC, El-Sheikh Ali H, Loux SC, Scoggin KE, Kalbfleisch TS, MacLeod JN, Dahlgren LA
Frontiers in immunology 2021;12:734322
Frontiers in immunology 2021;12:734322
The thrombin receptor links brain derived neurotrophic factor to neuron cholesterol production, resiliency and repair after spinal cord injury.
Triplet EM, Kim HN, Yoon H, Radulovic M, Kleppe L, Simon WL, Choi CI, Walsh PJ, Dutton JR, Scarisbrick IA
Neurobiology of disease 2021 May;152:105294
Neurobiology of disease 2021 May;152:105294
No comments: Submit comment
Supportive validation
- Submitted by
- Invitrogen Antibodies (provider)
- Main image

- Experimental details
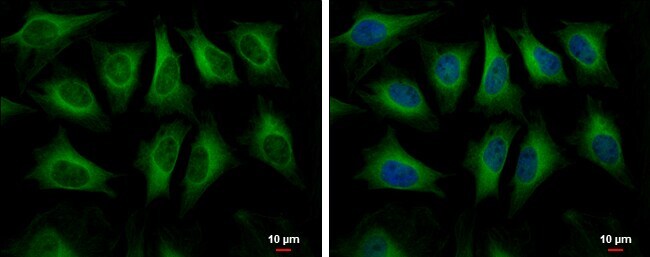
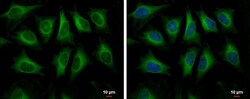
- Immunocytochemistry-Immunofluorescence analysis of HMGCS1 was performed in HeLa cells fixed in 4% paraformaldehyde at RT for 15 min. Green: HMGCS1 Polyclonal Antibody (Product # PA5-29488) diluted at 1:500. Blue: Hoechst 33342 staining. Scale bar = 10 µm.
- Submitted by
- Invitrogen Antibodies (provider)
- Main image
- Experimental details
- Immunocytochemistry-Immunofluorescence analysis of HMGCS1 was performed in HeLa cells fixed in 4% paraformaldehyde at RT for 15 min. Green: HMGCS1 Polyclonal Antibody (Product # PA5-29488) diluted at 1:500. Blue: Hoechst 33342 staining. Scale bar = 10 µm.

Supportive validation
- Submitted by
- Invitrogen Antibodies (provider)
- Main image

- Experimental details
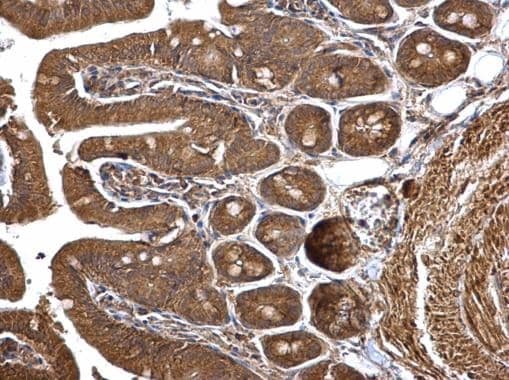
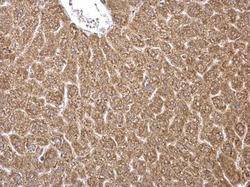
- HMGCS1 Polyclonal Antibody detects HMGCS1 protein at cytosol on mouse intestine by immunohistochemical analysis. Sample: Paraffin-embedded mouse intestine. HMGCS1 Polyclonal Antibody (Product # PA5-29488) dilution: 1:500. Antigen Retrieval: EDTA based buffer, pH 8.0, 15 min.
- Submitted by
- Invitrogen Antibodies (provider)
- Main image
- Experimental details
- HMGCS1 Polyclonal Antibody detects HMGCS1 protein at cytosol on mouse intestine by immunohistochemical analysis. Sample: Paraffin-embedded mouse intestine. HMGCS1 Polyclonal Antibody (Product # PA5-29488) dilution: 1:500. Antigen Retrieval: EDTA based buffer, pH 8.0, 15 min.

Supportive validation
- Submitted by
- Invitrogen Antibodies (provider)
- Main image
- Experimental details
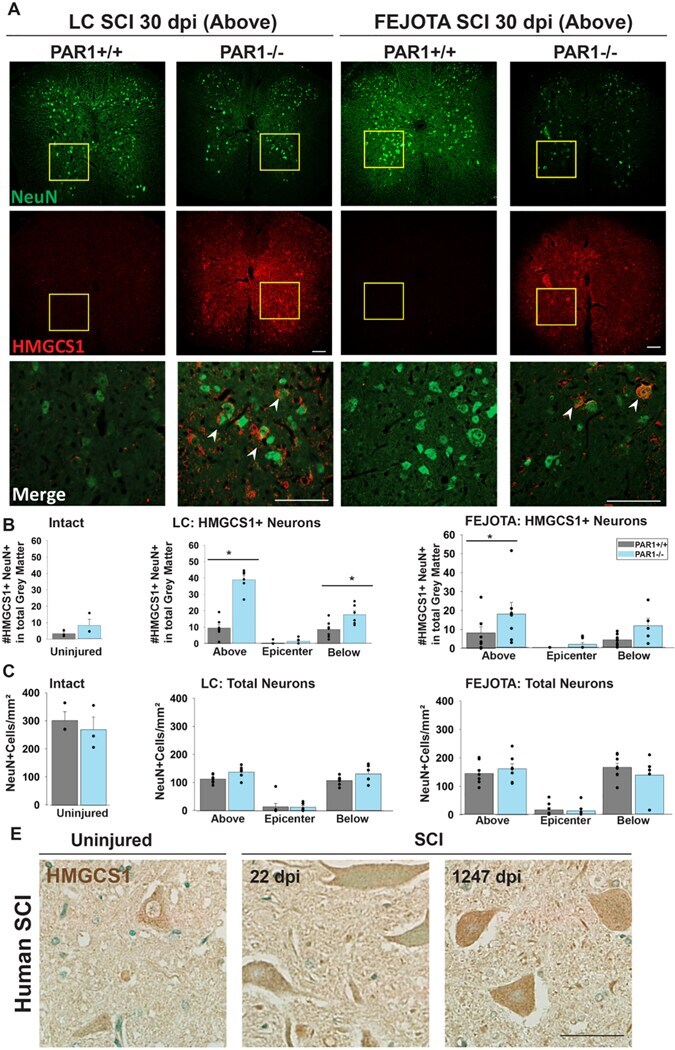
- Fig. 2. PAR1 knockout promotes increased expression of cholesterol synthesis intermediates by neurons in the injured spinal cord. (A) Immunofluorescent images show co-labeling for NeuN (neuron marker) and HMGCS1 in spinal segments above the injury epicenter 30 d after 0.25 mm lateral compression or FEJOTA clip SCI in wild type (PAR1+/+) and PAR1-/- mice. The merged images show higher power views of boxed areas to demonstrate increases in neuronal HMGCS1 expression in PAR1-/- compared to controls after SCI (arrow heads indicate HMGCS1 + NeuN+ ventral horn neurons). (B) Histogram shows significant elevations in the number of HMGCS1+ neurons 30 dpi in spinal segments above and below the injury epicenter ( p < 0.001 Above, p = 0.002 Below) in LC and Above ( p = 0.04) in FEJOTA. Few HMGCS1+ neurons are present in the intact spinal cord (uninjured). (C) In contrast, the total number of neurons in the spinal cord did not significantly differ by genotype in either model. (D) Expression of HMGCS1 by ventral horn motoneurons was also documented in the intact in human spinal cord and at subacute and chronic time points after traumatic SCI. Differences between genotypes were measured by two-tailed Student's t -test (uninjured) or Two-Way Repeated Measures ANOVA with Student-Newman-Keuls pairwise comparisons (SCI), * p < 0.05. For immunostaining, n = 7 PAR1+/+ and 6 PAR1-/- female mice for LC, n = 8 PAR1+/+ and 7 PAR1-/- for FEJOTA, n = 3 each genotype for uninjured. Co-expression between
- Submitted by
- Invitrogen Antibodies (provider)
- Main image

- Experimental details
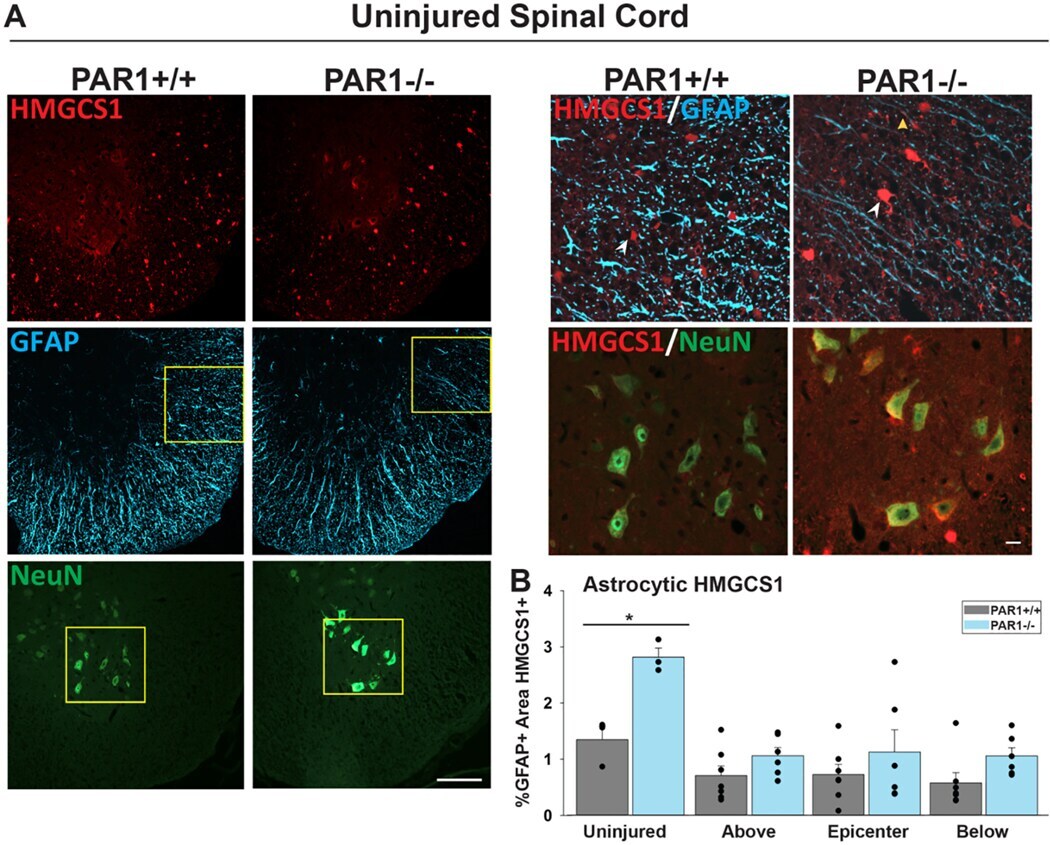
- Fig. 3. PAR1 knockout promotes increased expression of the cholesterol synthesis intermediate HMGCS1 by astrocytes in the intact spinal cord. (A) Immunofluorescent images show co-labeling for HMGCS1, GFAP (astrocyte marker), and NeuN (neuron marker) in the ventrolateral region of the intact spinal cord. (B) Histogram shows quantification of the percentage of total GFAP+ area also positive for HMGCS1. Astrocytes in PAR1-/- mice expressed 2-fold more HMGCS1 compared to wild-type mice ( p = 0.007, two-tailed Student's t) in the intact cord. Astrocyte HMGCS1 expression was decreased at 30 dpi across the injury epicenter and spinal segments above and below compared to the intact cord in both PAR1+/+ and PAR1-/- mice (LC SCI tissue averaged across all levels, p = 0.02 for PAR1+/+ and p < 0.001 for PAR1-/- by Two-Way ANOVA). There was a trend toward increased co-expression of HMGCS1 in PAR1-/- mice in neurons ( p = 0.07) in the intact spinal cord, with increased neuronal expression of HMGCS1 following SCI (see Fig. 2 ). Arrow heads point to non-GFAP+ white matter glia (likely oligodendrocytes) also expressing HMGCS1, small yellow arrow denotes area of GFAP-HMGCS1 co-expression. Difference between genotypes assessed by two-tailed Student's t-test (uninjured) and Two-Way Repeated Measures ANOVA (levels within SCI). Co-expression between uninjured and SCI (average of all segments) was also assessed by Two-Way ANOVA. * p < 0.05, n = 3 each for uninjured, n = 7 PAR1+/+ and n = 6 PAR1-/-
- Submitted by
- Invitrogen Antibodies (provider)
- Main image
- Experimental details
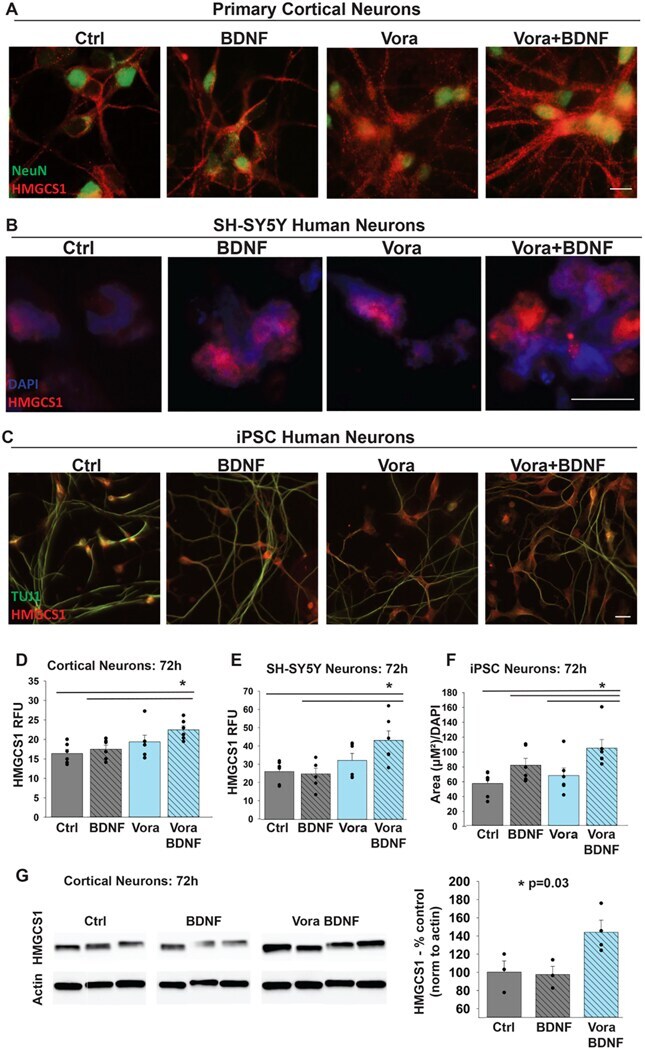
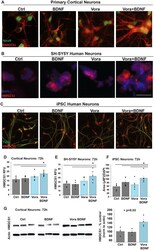
- Fig. 5. PAR1 inhibition augments BDNF-mediated HMGCS1 production by murine and human neurons in vitro . Immunofluorescent (IF) images show staining for HMGCS1 (red) and neuronal marker NeuN (green) in primary murine cortical neurons treated with low-dose BDNF (1 ng/mL), the PAR1 inhibitor vorapaxar (100 nM) or a combination for 72 h. (D) The intensity of HMGCS1 in relative fluorescence units (RFU) was increased by Vora+BDNF at 72 h ( p = 0.01 compared to control, p = 0.03 relative to BDNF alone). HMGCS1 staining was also performed in human neurons, in both the SH-SY5Y cell line (B) and induced pluripotent stem cells differentiated into a spinal cord neuron phenotype (C) after treatment with vorapaxar (100 nM SH-SY5Y, 50 nM iPSC), BDNF (1 ng/mL), or combination for 72 h. Combination Vora+BDNF increased HMGCS1 fluorescence intensity relative to control and BDNF alone (D) ( p == 0.01 for each) in SH-SY5Y neurons (E) and increased HMGCS1 expression relative to control, BDNF, and vorapaxar alone ( p = 0.02, 0.01, and 0.01, respectively) in iPSC-derived human spinal cord neurons (F). (G) Increased HMGCS1 protein levels in cortical neurons with combined vorapaxar and BDNF over control or BDNF alone confirmed by Western blotting ( p = 0.03 overall, paired post-tests not statistically significant). Statistical significance determined by One-Way ANOVA on Ranks (iPSC neurons, due to unequal variance) or One-Way ANOVA (all other analyses) with Student-Newman-Keuls pairwise comparisons, *