Explore
 Validate
 Learn
Learn Western blot
 Immunocytochemistry
Antibody data
- Antibody Data
- Antigen structure
- References [26]
- Comments [0]
- Validations
- Immunocytochemistry [4]
- Flow cytometry [1]
- Other assay [20]
Submit
Validation data
Reference
Comment
Report error
- Product number
- PA1-920A - Provider product page

- Provider
- Invitrogen Antibodies
- Product name
- alpha-ENaC Polyclonal Antibody
- Antibody type
- Polyclonal
- Antigen
- Synthetic peptide
- Description
- PA1-920A detects alpha-epithelial sodium channel (alpha-ENaC) from human, mouse, and rat tissues and cells. PA1-920A has been successfully used in Western blot procedures. By Western blot, this antibody specifically detects a ~97 kDa band representing glycosylated alpha-ENaC from NIH-3T3 cells, and a ~75 kDa band representing the unglycosylated alpha-ENaC protein from human brain samples. The PA1-920A immunizing peptide is a synthetic peptide corresponding to residues 20-42 from human alpha-ENaC. This sequence is 82%, 73%, 64%, and 59% conserved in the rat and rabbit, mouse, guinea pig, and cow, respectively. PA1-920A immunizing peptide (Cat. # PEP-088) is available for use in neutralization and control experiments.
- Reactivity
- Human, Mouse, Rat
- Host
- Rabbit
- Isotype
- IgG
- Vial size
- 100 μg
- Concentration
- 1 mg/mL
- Storage
- -20°C, Avoid Freeze/Thaw Cycles
Submitted references A Mathematical Model of Salivary Gland Duct Cells.
The microbiota-gut-kidney axis mediates host osmoregulation in a small desert mammal.
VX-809 mitigates disease in a mouse model of autosomal dominant polycystic kidney disease bearing the R3277C human mutation.
Ferulic acid ameliorates lipopolysaccharide-induced tracheal injury via cGMP/PKGII signaling pathway.
Melatonin Attenuates Sepsis-Induced Acute Lung Injury Through Improvement of Epithelial Sodium Channel-Mediated Alveolar Fluid Clearance Via Activation of SIRT1/SGK1/Nedd4-2 Signaling Pathway.
Bone marrow mesenchymal stem cell-conditioned medium facilitates fluid resolution via miR-214-activating epithelial sodium channels.
Bone marrow mesenchymal stem cells derived miRNA-130b enhances epithelial sodium channel by targeting PTEN.
Upregulation of the WNK4 Signaling Pathway Inhibits Epithelial Sodium Channels of Mouse Tracheal Epithelial Cells After Influenza A Infection.
Patient-derived pancreas-on-a-chip to model cystic fibrosis-related disorders.
The Epithelial Sodium Channel (αENaC) Is a Downstream Therapeutic Target of ASCL1 in Pulmonary Neuroendocrine Tumors.
Amiloride Improves Endothelial Function and Reduces Vascular Stiffness in Female Mice Fed a Western Diet.
Novel mechanisms for crotonaldehyde-induced lung edema.
An angiotensin II type 1 receptor binding molecule has a critical role in hypertension in a chronic kidney disease model.
Dexmedetomidine enhances human lung fluid clearance through improving alveolar sodium transport.
Formaldehyde impairs transepithelial sodium transport.
Regulation of mechanosensitive biliary epithelial transport by the epithelial Na(+) channel.
Endothelial Gata5 transcription factor regulates blood pressure.
Renal tubule angiotensin II type 1 receptor-associated protein promotes natriuresis and inhibits salt-sensitive blood pressure elevation.
Deletion of the angiotensin II type 1 receptor-associated protein enhances renal sodium reabsorption and exacerbates angiotensin II-mediated hypertension.
Cholera toxin enhances Na(+) absorption across MCF10A human mammary epithelia.
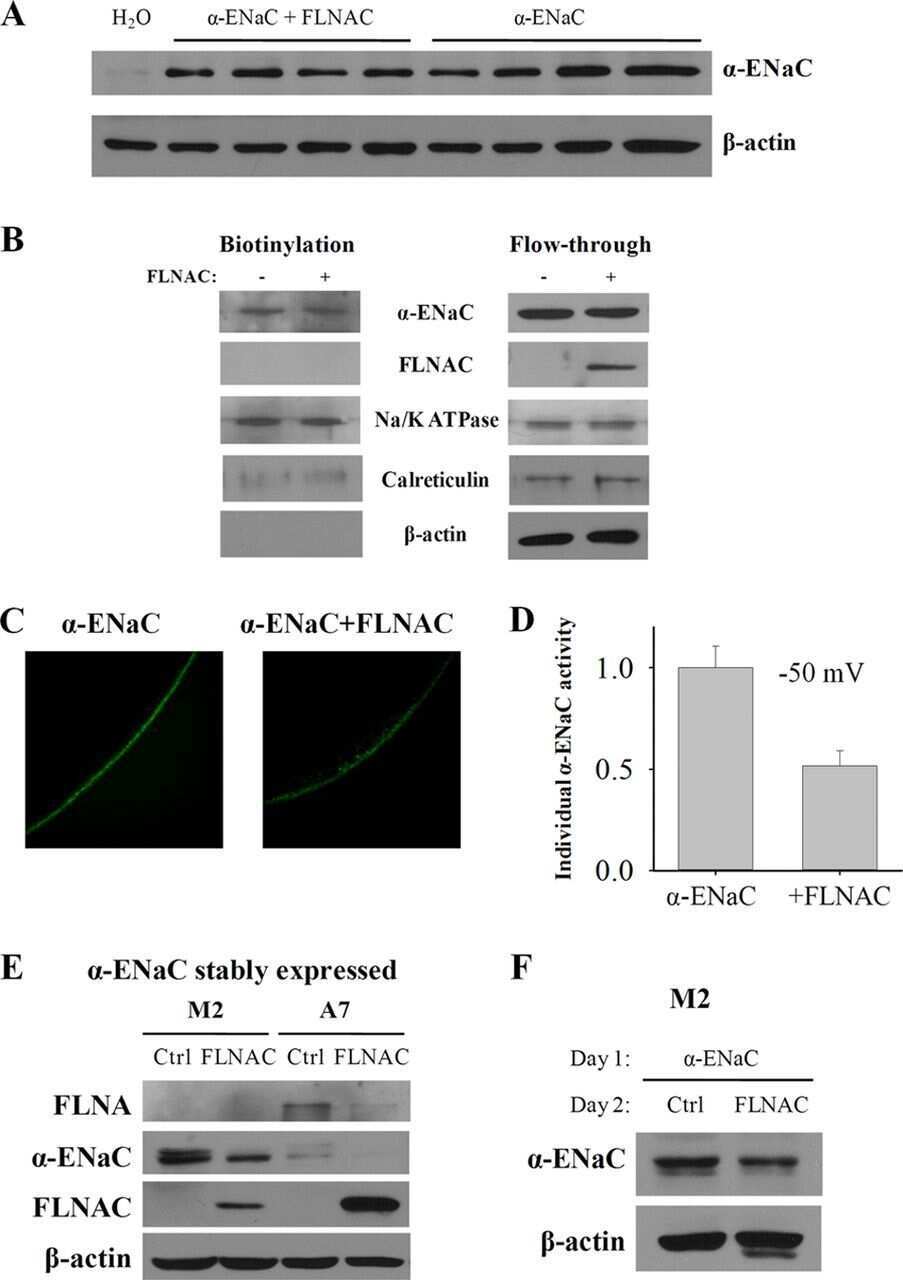
Filamin interacts with epithelial sodium channel and inhibits its channel function.
Enhancement of alveolar epithelial sodium channel activity with decreased cystic fibrosis transmembrane conductance regulator expression in mouse lung.
Regulation of endogenous ENaC functional expression by CFTR and ΔF508-CFTR in airway epithelial cells.
Long-term terbutaline exposure stimulates alpha1-Na+-K+-ATPase expression at posttranscriptional level in rat fetal distal lung epithelial cells.
Interleukin-6 stimulates epithelial sodium channels in mouse cortical collecting duct cells.
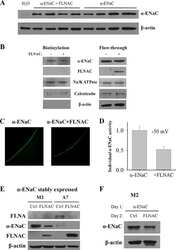
The carboxyl terminus of the alpha-subunit of the amiloride-sensitive epithelial sodium channel binds to F-actin.
Su S, Rugis J, Wahl A, Doak S, Li Y, Suresh V, Yule D, Sneyd J
Bulletin of mathematical biology 2022 Jul 7;84(8):84
Bulletin of mathematical biology 2022 Jul 7;84(8):84
The microbiota-gut-kidney axis mediates host osmoregulation in a small desert mammal.
Nouri Z, Zhang XY, Khakisahneh S, Degen AA, Wang DH
NPJ biofilms and microbiomes 2022 Apr 4;8(1):16
NPJ biofilms and microbiomes 2022 Apr 4;8(1):16
VX-809 mitigates disease in a mouse model of autosomal dominant polycystic kidney disease bearing the R3277C human mutation.
Yanda MK, Cebotaru L
FASEB journal : official publication of the Federation of American Societies for Experimental Biology 2021 Nov;35(11):e21987
FASEB journal : official publication of the Federation of American Societies for Experimental Biology 2021 Nov;35(11):e21987
Ferulic acid ameliorates lipopolysaccharide-induced tracheal injury via cGMP/PKGII signaling pathway.
Xie X, Yu T, Hou Y, Han A, Ding Y, Nie H, Cui Y
Respiratory research 2021 Dec 4;22(1):308
Respiratory research 2021 Dec 4;22(1):308
Melatonin Attenuates Sepsis-Induced Acute Lung Injury Through Improvement of Epithelial Sodium Channel-Mediated Alveolar Fluid Clearance Via Activation of SIRT1/SGK1/Nedd4-2 Signaling Pathway.
Li J, Liu L, Zhou X, Lu X, Liu X, Li G, Long J
Frontiers in pharmacology 2020;11:590652
Frontiers in pharmacology 2020;11:590652
Bone marrow mesenchymal stem cell-conditioned medium facilitates fluid resolution via miR-214-activating epithelial sodium channels.
Ding Y, Cui Y, Hou Y, Nie H
MedComm 2020 Dec;1(3):376-385
MedComm 2020 Dec;1(3):376-385
Bone marrow mesenchymal stem cells derived miRNA-130b enhances epithelial sodium channel by targeting PTEN.
Zhang H, Ding Y, Hou Y, Liu Y, Zhou Z, Nie H
Respiratory research 2020 Dec 11;21(1):329
Respiratory research 2020 Dec 11;21(1):329
Upregulation of the WNK4 Signaling Pathway Inhibits Epithelial Sodium Channels of Mouse Tracheal Epithelial Cells After Influenza A Infection.
Hou Y, Cui Y, Zhou Z, Liu H, Zhang H, Ding Y, Nie H, Ji HL
Frontiers in pharmacology 2019;10:12
Frontiers in pharmacology 2019;10:12
Patient-derived pancreas-on-a-chip to model cystic fibrosis-related disorders.
Shik Mun K, Arora K, Huang Y, Yang F, Yarlagadda S, Ramananda Y, Abu-El-Haija M, Palermo JJ, Appakalai BN, Nathan JD, Naren AP
Nature communications 2019 Jul 16;10(1):3124
Nature communications 2019 Jul 16;10(1):3124
The Epithelial Sodium Channel (αENaC) Is a Downstream Therapeutic Target of ASCL1 in Pulmonary Neuroendocrine Tumors.
He M, Liu S, Gallolu Kankanamalage S, Borromeo MD, Girard L, Gazdar AF, Minna JD, Johnson JE, Cobb MH
Translational oncology 2018 Apr;11(2):292-299
Translational oncology 2018 Apr;11(2):292-299
Amiloride Improves Endothelial Function and Reduces Vascular Stiffness in Female Mice Fed a Western Diet.
Martinez-Lemus LA, Aroor AR, Ramirez-Perez FI, Jia G, Habibi J, DeMarco VG, Barron B, Whaley-Connell A, Nistala R, Sowers JR
Frontiers in physiology 2017;8:456
Frontiers in physiology 2017;8:456
Novel mechanisms for crotonaldehyde-induced lung edema.
Li Y, Chang J, Cui Y, Zhao R, Ding Y, Hou Y, Zhou Z, Ji HL, Nie H
Oncotarget 2017 Oct 13;8(48):83509-83522
Oncotarget 2017 Oct 13;8(48):83509-83522
An angiotensin II type 1 receptor binding molecule has a critical role in hypertension in a chronic kidney disease model.
Kobayashi R, Wakui H, Azushima K, Uneda K, Haku S, Ohki K, Haruhara K, Kinguchi S, Matsuda M, Ohsawa M, Toya Y, Nishiyama A, Yamashita A, Tanabe K, Maeshima Y, Umemura S, Tamura K
Kidney international 2017 May;91(5):1115-1125
Kidney international 2017 May;91(5):1115-1125
Dexmedetomidine enhances human lung fluid clearance through improving alveolar sodium transport.
Cui Y, Ding Y, Chen L, Li Y, Li YC, Nie H
Fundamental & clinical pharmacology 2017 Aug;31(4):429-437
Fundamental & clinical pharmacology 2017 Aug;31(4):429-437
Formaldehyde impairs transepithelial sodium transport.
Cui Y, Li H, Wu S, Zhao R, Du D, Ding Y, Nie H, Ji HL
Scientific reports 2016 Oct 20;6:35857
Scientific reports 2016 Oct 20;6:35857
Regulation of mechanosensitive biliary epithelial transport by the epithelial Na(+) channel.
Li Q, Kresge C, Bugde A, Lamphere M, Park JY, Feranchak AP
Hepatology (Baltimore, Md.) 2016 Feb;63(2):538-49
Hepatology (Baltimore, Md.) 2016 Feb;63(2):538-49
Endothelial Gata5 transcription factor regulates blood pressure.
Messaoudi S, He Y, Gutsol A, Wight A, Hébert RL, Vilmundarson RO, Makrigiannis AP, Chalmers J, Hamet P, Tremblay J, McPherson R, Stewart AFR, Touyz RM, Nemer M
Nature communications 2015 Nov 30;6:8835
Nature communications 2015 Nov 30;6:8835
Renal tubule angiotensin II type 1 receptor-associated protein promotes natriuresis and inhibits salt-sensitive blood pressure elevation.
Wakui H, Uneda K, Tamura K, Ohsawa M, Azushima K, Kobayashi R, Ohki K, Dejima T, Kanaoka T, Tsurumi-Ikeya Y, Matsuda M, Haruhara K, Nishiyama A, Yabana M, Fujikawa T, Yamashita A, Umemura S
Journal of the American Heart Association 2015 Mar 19;4(3):e001594
Journal of the American Heart Association 2015 Mar 19;4(3):e001594
Deletion of the angiotensin II type 1 receptor-associated protein enhances renal sodium reabsorption and exacerbates angiotensin II-mediated hypertension.
Ohsawa M, Tamura K, Wakui H, Maeda A, Dejima T, Kanaoka T, Azushima K, Uneda K, Tsurumi-Ikeya Y, Kobayashi R, Matsuda M, Uchida S, Toya Y, Kobori H, Nishiyama A, Yamashita A, Ishikawa Y, Umemura S
Kidney international 2014 Sep;86(3):570-81
Kidney international 2014 Sep;86(3):570-81
Cholera toxin enhances Na(+) absorption across MCF10A human mammary epithelia.
Wang Q, Schultz BD
American journal of physiology. Cell physiology 2014 Mar 1;306(5):C471-84
American journal of physiology. Cell physiology 2014 Mar 1;306(5):C471-84
Filamin interacts with epithelial sodium channel and inhibits its channel function.
Wang Q, Dai XQ, Li Q, Tuli J, Liang G, Li SS, Chen XZ
The Journal of biological chemistry 2013 Jan 4;288(1):264-73
The Journal of biological chemistry 2013 Jan 4;288(1):264-73
Enhancement of alveolar epithelial sodium channel activity with decreased cystic fibrosis transmembrane conductance regulator expression in mouse lung.
Lazrak A, Jurkuvenaite A, Chen L, Keeling KM, Collawn JF, Bedwell DM, Matalon S
American journal of physiology. Lung cellular and molecular physiology 2011 Oct;301(4):L557-67
American journal of physiology. Lung cellular and molecular physiology 2011 Oct;301(4):L557-67
Regulation of endogenous ENaC functional expression by CFTR and ΔF508-CFTR in airway epithelial cells.
Rubenstein RC, Lockwood SR, Lide E, Bauer R, Suaud L, Grumbach Y
American journal of physiology. Lung cellular and molecular physiology 2011 Jan;300(1):L88-L101
American journal of physiology. Lung cellular and molecular physiology 2011 Jan;300(1):L88-L101
Long-term terbutaline exposure stimulates alpha1-Na+-K+-ATPase expression at posttranscriptional level in rat fetal distal lung epithelial cells.
Rahman MS, Gandhi S, Otulakowski G, Duan W, Sarangapani A, O'Brodovich H
American journal of physiology. Lung cellular and molecular physiology 2010 Jan;298(1):L96-L104
American journal of physiology. Lung cellular and molecular physiology 2010 Jan;298(1):L96-L104
Interleukin-6 stimulates epithelial sodium channels in mouse cortical collecting duct cells.
Li K, Guo D, Zhu H, Hering-Smith KS, Hamm LL, Ouyang J, Dong Y
American journal of physiology. Regulatory, integrative and comparative physiology 2010 Aug;299(2):R590-5
American journal of physiology. Regulatory, integrative and comparative physiology 2010 Aug;299(2):R590-5
The carboxyl terminus of the alpha-subunit of the amiloride-sensitive epithelial sodium channel binds to F-actin.
Mazzochi C, Bubien JK, Smith PR, Benos DJ
The Journal of biological chemistry 2006 Mar 10;281(10):6528-38
The Journal of biological chemistry 2006 Mar 10;281(10):6528-38
No comments: Submit comment
Supportive validation
- Submitted by
- Invitrogen Antibodies (provider)
- Main image

- Experimental details
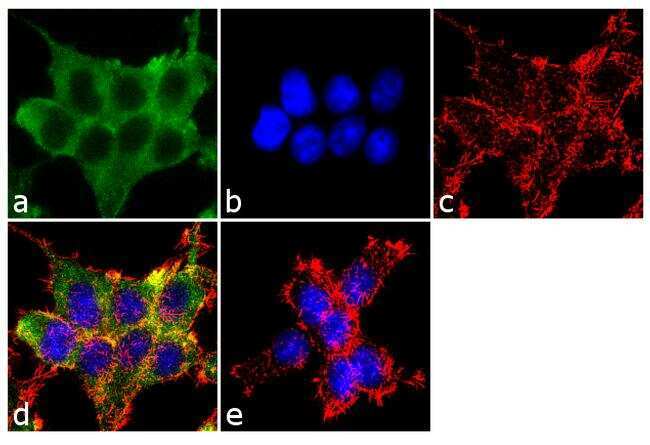
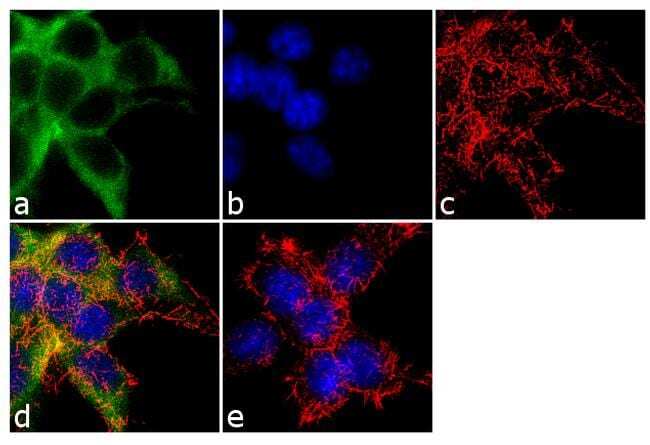
- Immunofluorescence analysis of alpha ENaC was performed using 70% confluent log phase HEK-293 cells. The cells were fixed with 4% paraformaldehyde for 10 minutes, permeabilized with 0.1% Triton™ X-100 for 10 minutes, and blocked with 1% BSA for 1 hour at room temperature. The cells were labeled with alpha ENaC Rabbit Polyclonal Antibody (Product # PA1-920A) at 2 µg/mL in 0.1% BSA and incubated for 3 hours at room temperature and then labeled with Goat anti-Rabbit IgG (H+L) Superclonal™ Secondary Antibody, Alexa Fluor® 488 conjugate (Product # A27034) a dilution of 1:2000 for 45 minutes at room temperature (Panel a: green). Nuclei (Panel b: blue) were stained with SlowFade® Gold Antifade Mountant with DAPI (Product # S36938). F-actin (Panel c: red) was stained with Alexa Fluor® 555 Rhodamine Phalloidin (Product # R415, 1:300). Panel d represents the merged image showing cytoplasmic localization. Panel e shows the no primary antibody control. The images were captured at 60X magnification.
- Submitted by
- Invitrogen Antibodies (provider)
- Main image
- Experimental details
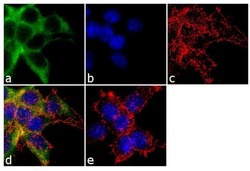
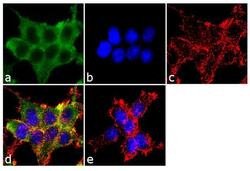
- Immunofluorescence analysis of alpha ENaC was performed using 70% confluent log phase HEK 293 cells. The cells were fixed with 4% paraformaldehyde for 10 minutes, permeabilized with 0.1% Triton™ X-100 for 10 minutes, and blocked with 1% BSA for 1 hour at room temperature. The cells were labeled with alpha ENaC Rabbit Polyclonal Antibody (Product # PA1-920A) at 2µg/mL in 0.1% BSA and incubated for 3 hours at room temperature and then labeled with Goat anti-Rabbit IgG (H+L) Superclonal™ Secondary Antibody, Alexa Fluor® 488 conjµgate (Product # A27034) at a dilution of 1:2000 for 45 minutes at room temperature (Panel a: green). Nuclei (Panel b: blue) were stained with SlowFade® Gold Antifade Mountant with DAPI (Product # S36938). F-actin (Panel c: red) was stained with Alexa Fluor® 555 Rhodamine Phalloidin (Product # R415, 1:300). Panel d represents the merged image showing cytoplasmic localization. Panel e shows the no primary antibody control. The images were captured at 60X magnification.

- Submitted by
- Invitrogen Antibodies (provider)
- Main image
- Experimental details
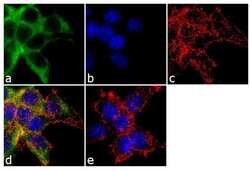
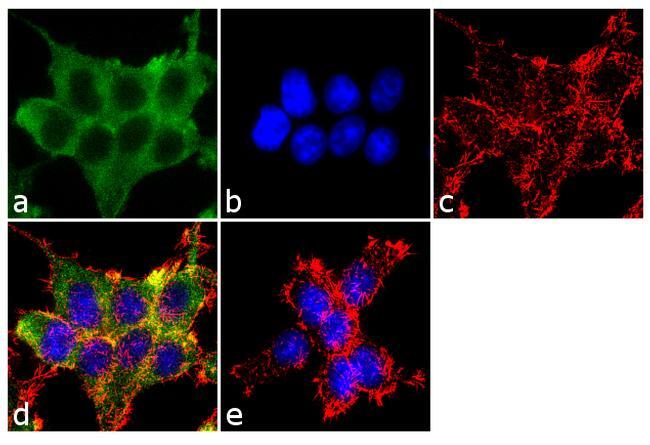
- Immunofluorescence analysis of alpha ENaC was performed using 70% confluent log phase HEK 293 cells. The cells were fixed with 4% paraformaldehyde for 10 minutes, permeabilized with 0.1% Triton™ X-100 for 10 minutes, and blocked with 1% BSA for 1 hour at room temperature. The cells were labeled with alpha ENaC Rabbit Polyclonal Antibody (Product # PA1-920A) at 2µg/mL in 0.1% BSA and incubated for 3 hours at room temperature and then labeled with Goat anti-Rabbit IgG (Heavy Chain) Superclonal™ Secondary Antibody, Alexa Fluor® 488 conjµgate (Product # A27034) at a dilution of 1:2000 for 45 minutes at room temperature (Panel a: green). Nuclei (Panel b: blue) were stained with SlowFade® Gold Antifade Mountant with DAPI (Product # S36938). F-actin (Panel c: red) was stained with Alexa Fluor® 555 Rhodamine Phalloidin (Product # R415, 1:300). Panel d represents the merged image showing cytoplasmic localization. Panel e shows the no primary antibody control. The images were captured at 60X magnification.
- Submitted by
- Invitrogen Antibodies (provider)
- Main image
- Experimental details
- Immunofluorescence analysis of alpha ENaC was performed using 70% confluent log phase HEK-293 cells. The cells were fixed with 4% paraformaldehyde for 10 minutes, permeabilized with 0.1% Triton™ X-100 for 10 minutes, and blocked with 1% BSA for 1 hour at room temperature. The cells were labeled with alpha ENaC Rabbit Polyclonal Antibody (Product # PA1-920A) at 2 µg/mL in 0.1% BSA and incubated for 3 hours at room temperature and then labeled with Goat anti-Rabbit IgG (Heavy Chain) Superclonal™ Secondary Antibody, Alexa Fluor® 488 conjugate (Product # A27034) a dilution of 1:2000 for 45 minutes at room temperature (Panel a: green). Nuclei (Panel b: blue) were stained with SlowFade® Gold Antifade Mountant with DAPI (Product # S36938). F-actin (Panel c: red) was stained with Alexa Fluor® 555 Rhodamine Phalloidin (Product # R415, 1:300). Panel d represents the merged image showing cytoplasmic localization. Panel e shows the no primary antibody control. The images were captured at 60X magnification.
Supportive validation
- Submitted by
- Invitrogen Antibodies (provider)
- Main image
- Experimental details
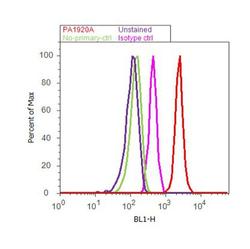
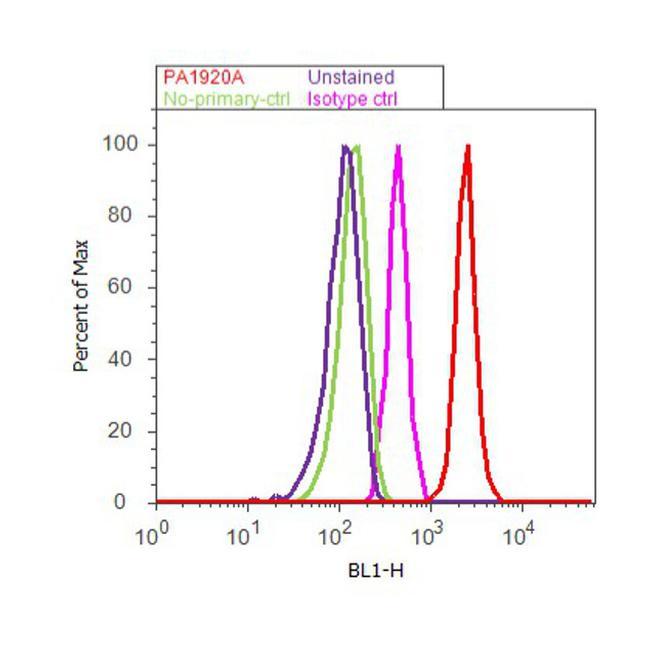
- Flow cytometry analysis of alpha ENaC was done on HEK-293 cells. Cells were fixed with 70% ethanol for 10 minutes, permeabilized with 0.25% Triton™ X-100 for 20 minutes, and blocked with 5% BSA for 30 minutes at room temperature. Cells were labeled with alpha ENaC Rabbit Polyclonal Antibody (Product # PA1-920A, red histogram) or with rabbit isotype control (pink histogram) at 3-5 µg/million cells in 2.5% BSA. After incubation at room temperature for 2 hours, the cells were labeled with Alexa Fluor® 488 Goat Anti-Rabbit Secondary Antibody (Product # A11008) at a dilution of 1:400 for 30 minutes at room temperature. The representative 10,000 cells were acquired and analyzed for each sample using an Attune® Acoustic Focusing Cytometer. The purple histogram represents unstained control cells and the green histogram represents no-primary-antibody control..
Supportive validation
- Submitted by
- Invitrogen Antibodies (provider)
- Main image

- Experimental details
- NULL
- Submitted by
- Invitrogen Antibodies (provider)
- Main image
- Experimental details
- NULL
- Submitted by
- Invitrogen Antibodies (provider)
- Main image
- Experimental details
- NULL
- Submitted by
- Invitrogen Antibodies (provider)
- Main image

- Experimental details
- NULL
- Submitted by
- Invitrogen Antibodies (provider)
- Main image
- Experimental details
- NULL
- Submitted by
- Invitrogen Antibodies (provider)
- Main image
- Experimental details
- NULL
- Submitted by
- Invitrogen Antibodies (provider)
- Main image
- Experimental details
- NULL
- Submitted by
- Invitrogen Antibodies (provider)
- Main image

- Experimental details
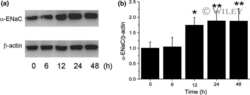
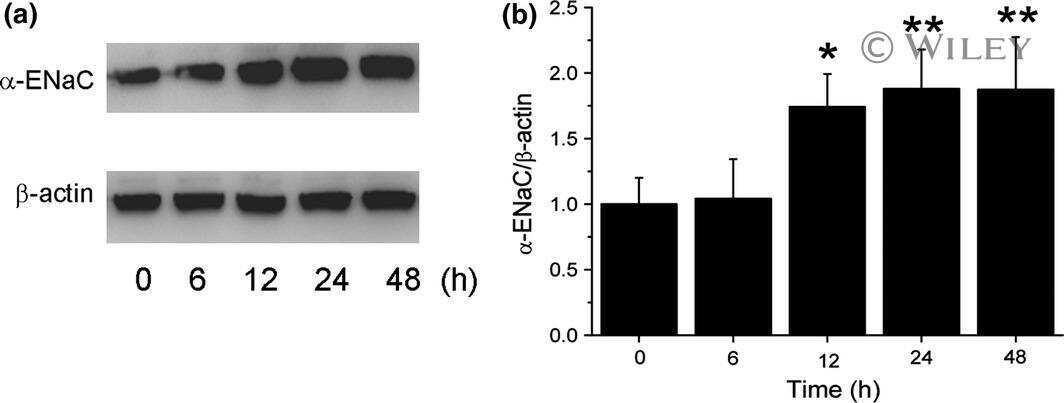
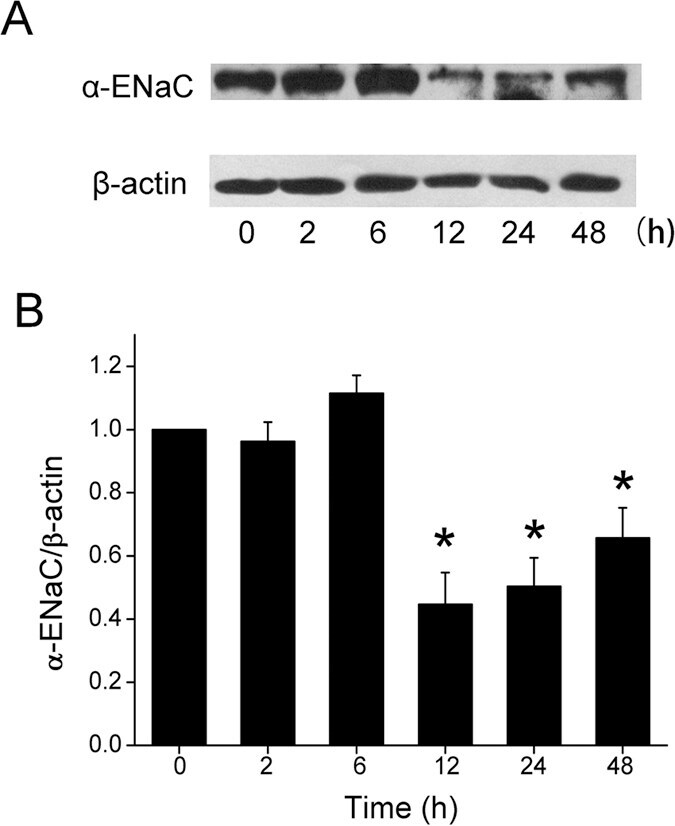
- Figure 3 Effect of formaldehyde on alpha-ENaC protein level in H441 cells. ( A ) Representative western blot of alpha-ENaC protein extracted from H441 cells exposed to 200 muM formaldehyde for 0-48 h. Blots were immunostained with antibody to alpha-ENaC, or to beta-actin as a loading control. ( B ) Graphical representation of data obtained from three sets of western blots and quantified using gray analysis (alpha-ENaC/beta-actin). Data are shown as the mean +- SE, * P < 0.05, compared with control.
- Submitted by
- Invitrogen Antibodies (provider)
- Main image
- Experimental details
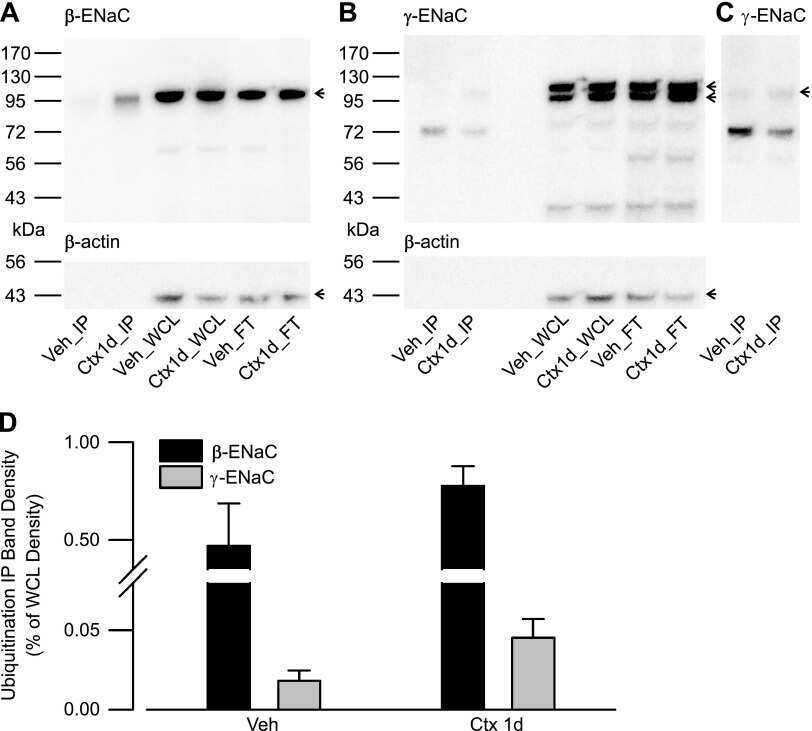
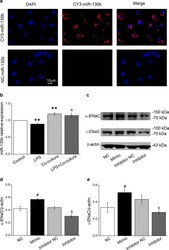
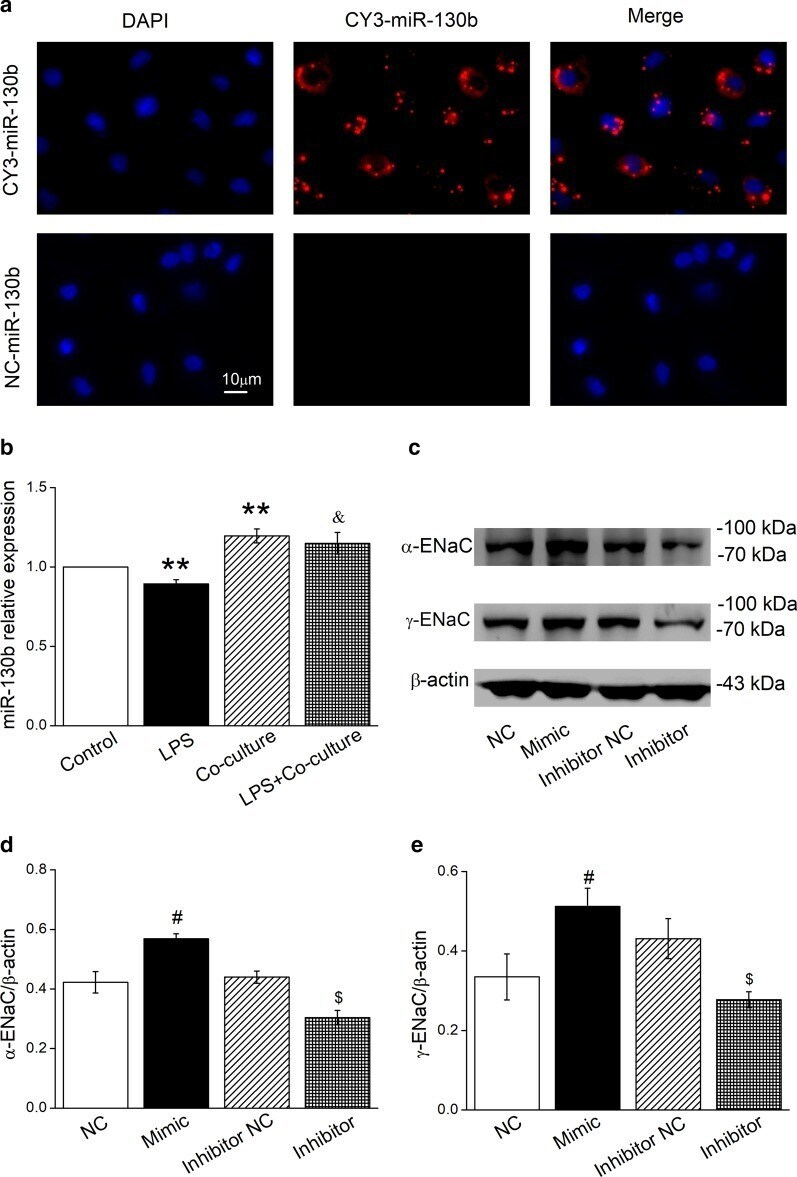
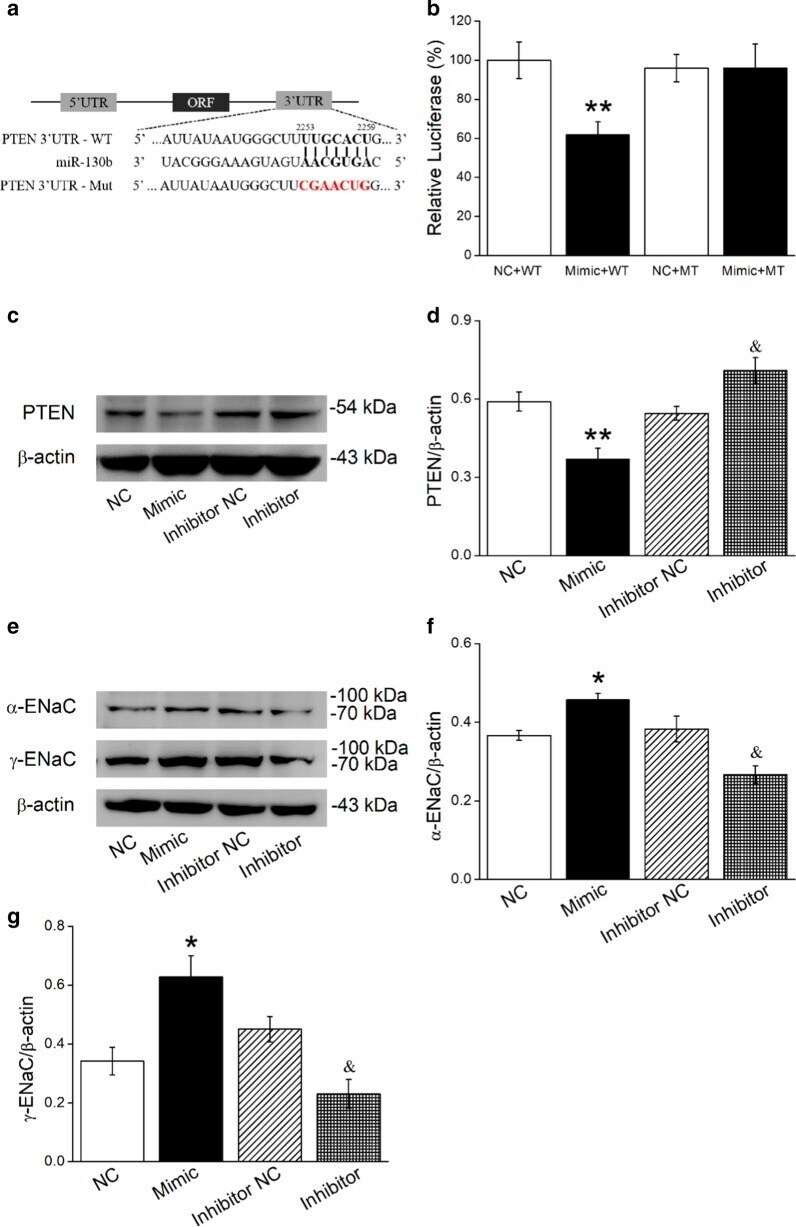
- Fig. 3 MiR-130b can be transferred into AT2 cells co-cultured with BMSCs and increases protein level alpha/gamma-ENaC in AT2 cells. a Transfected miR-130b labelled with Cy3 was localized in AT2 cells co-cultured with BMSCs for 24 h. BMSCs were transiently transfected with Cy3-miR-130b after which they were co-cultured with mouse AT2 cells and then fixed. Nuclei were counterstained by 4,6-diamidino-2-phenylindole (DAPI, blue; left panel), and the representative staining images were shown in CY3-miR-130b positive AT2 cells (red; middle panel). The merged images were seen (right panel). Scale bar, 10 mum. b The result of real-time PCR assays shows miR-130b level in AT2 cells treated with LPS for 12 h and/or co-cultured with BMSCs for 24 h. The relative level of miR-130b were calculated as miR-130b/U6 ratio. c Representative Western blot bands of alpha- and gamma-ENaC protein expression in AT2 cells transfected with miR-130b mimic/inhibitor for 72 h. Blots for beta-actin were used as internal controls. d , e Graphical representation of data obtained from Western blot assays for alpha- and gamma-ENaC subunits. Bands were quantified using gray analysis (alpha-ENaC/beta-actin and gamma-ENaC/beta-actin). ** P < 0.01, compared with control; & P < 0.05, compared with LPS; # P < 0.05, compared with miR-130b mimic negative control (NC); $ P < 0.05, compared with miR-130b inhibitor negative control (Inhibitor NC), n = 4-6
- Submitted by
- Invitrogen Antibodies (provider)
- Main image
- Experimental details
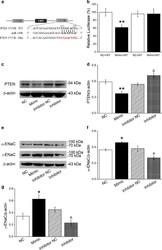
- Fig. 5 MiR-130b directly targets PTEN and BMSCs transfected with miR-130b mimic/miR-130b inhibitor affect protein expressions of PTEN and alpha/gamma-ENaC in AT2 cells. a The potential binding sites for miR-130b on the 3'-UTRs of PTEN. b Dual luciferase assay for miR-130b binding with PTEN in H441 cells. H441 cells were co-transfected with miR-130b mimic negative control (NC) or miR-130b mimic (Mimic) together with pmirGLO-PTEN (WT or MT) for 24 h. c , e Representative Western blot bands of PTEN and alpha/gamma-ENaC protein expression in AT2 cells co-cultured with BMSCs that were transfected with miR-130b mimic/inhibitor. d , f and g Graphical representation of data obtained from Western blot assays for PTEN and alpha/gamma-ENaC. Bands were quantified using gray analysis (PTEN/beta-actin, alpha-ENaC/beta-actin and gamma-ENaC/beta-actin). * P < 0.05, ** P < 0.01, compared with miR-130b mimic negative control or plus wild-type pmirGLO-PTEN (NC or NC + WT); & P < 0.05, compared with miR-130b inhibitor negative control (Inhibitor NC), n = 4
- Submitted by
- Invitrogen Antibodies (provider)
- Main image
- Experimental details
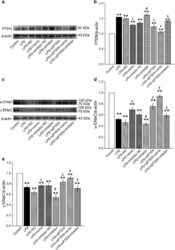
- Fig. 6 PTEN gene knockdown enhanced the protein expression of alpha/gamma-ENaC in AT2 cells. a , c Representative Western blot bands of PTEN and alpha/gamma-ENaC protein expression in LPS-treated AT2 cells transfected with miR-130b mimic/inhibitor or siPTEN. b , d and e Graphical representation of data obtained from Western blot assays for PTEN and alpha/gamma-ENaC. Bands were quantified using gray analysis (PTEN/beta-actin, alpha-ENaC/beta-actin and gamma-ENaC/beta-actin). ** P < 0.01, compared with control; & P < 0.05, compared with LPS + miR-130b mimic negative control (NC); # P < 0.05, compared with LPS + miR-130b inhibitor negative control (Inhibitor NC); $ P < 0.05, compared with LPS + siPTEN, n = 4-6
- Submitted by
- Invitrogen Antibodies (provider)
- Main image
- Experimental details
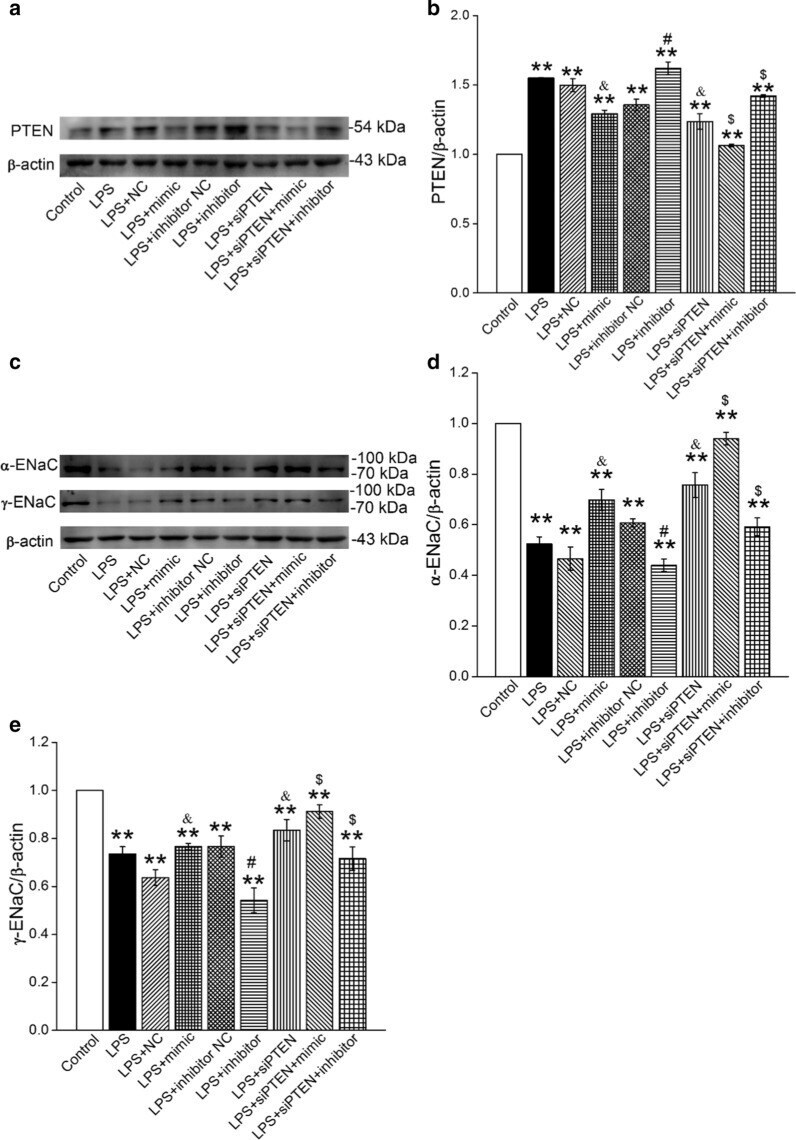
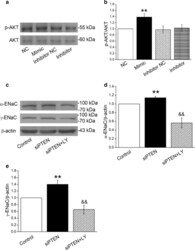
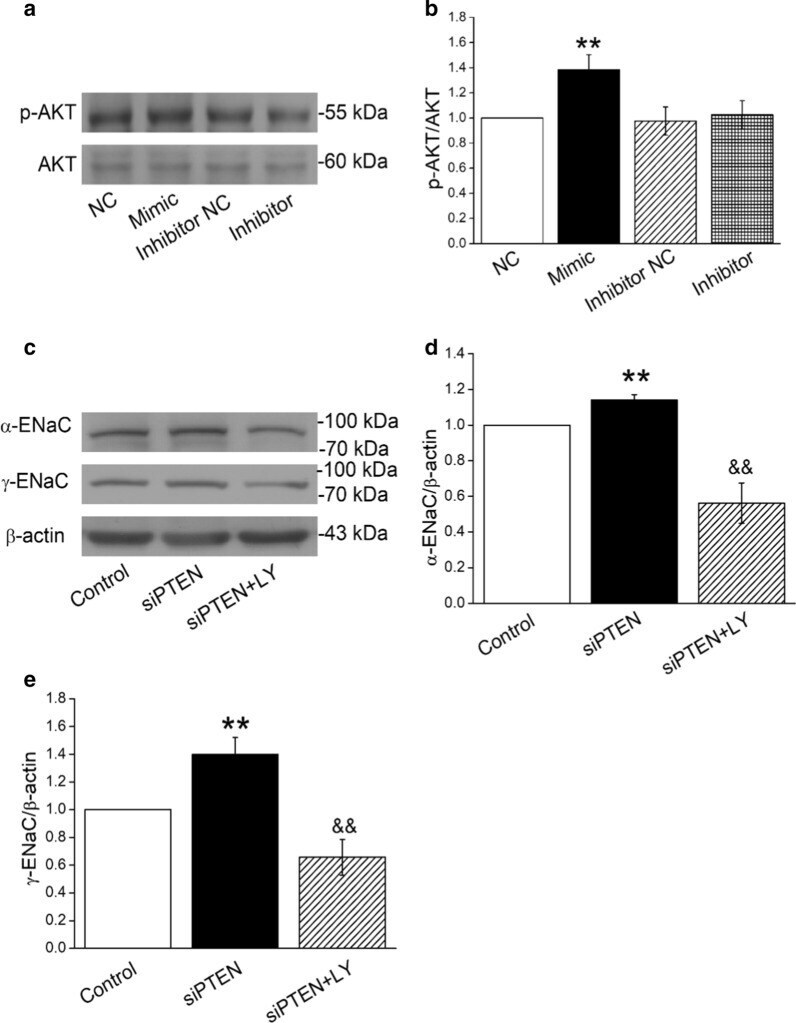
- Fig. 7 MiR-130b and PTEN regulate alpha/gamma-ENaC through PI3K/AKT pathway in AT2 cells. a Representative Western blot bands of p-AKT/AKT protein expression in AT2 cells that were transfected with miR-130b mimic/inhibitor. c Representative Western blot bands of alpha/gamma-ENaC protein expression in AT2 cells that were treated with 10 uM PI3K/AKT inhibitor (LY294002) and/or siPTEN for 30 min. b , d and e Graphical representation of data obtained from Western blot assays for p-AKT/AKT and alpha/gamma-ENaC. Bands were quantified using gray analysis (p-AKT/AKT, alpha-ENaC/beta-actin, and gamma-ENaC/beta-actin). ** P < 0.01, compared with Control or miR-130b mimic negative control (NC); && P < 0.01, compared with siPTEN group, n = 4
- Submitted by
- Invitrogen Antibodies (provider)
- Main image
- Experimental details
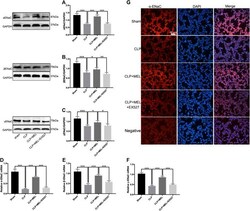
- FIGURE 4 Melatonin enhanced ENaC expression in CLP-induced ALI. The protein expressions of alpha-ENaC (A) , beta-ENaC (B) and gamma-ENaC (C) in ALI mouse were determined by western blot using GAPDH as a loading control. Results obtained by densitometry ratios of target proteins to GAPDH. The mRNA expressions of alpha-ENaC (D) , beta-ENaC (E) and gamma-ENaC (F) in ALI mouse were tested by real-time PCR. Gene expression was normalized with GAPDH as the housekeeping gene, and the relative expression of genes was calculated using the 2 -^^ Ct method. (G) The distribution and protein expression of alpha-ENaC was examined by immunofluorescence. All values are means +- SD ( n = 6). *** p < 0.001; ** p < 0.01; * p < 0.05 (one-way ANOVA followed by Turkey post hoc test).

- Submitted by
- Invitrogen Antibodies (provider)
- Main image
- Experimental details
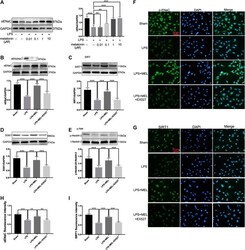
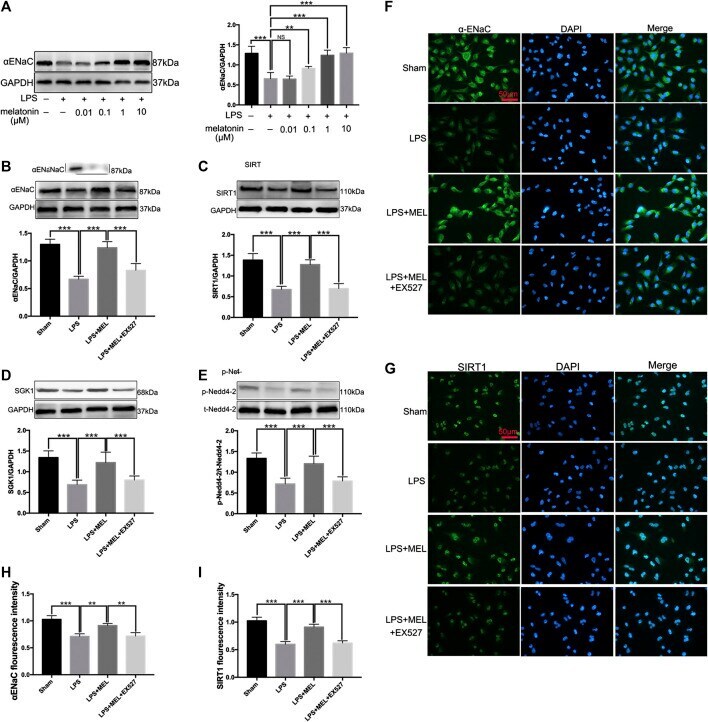
- FIGURE 6 Melatonin up-regulated ENaC protein expression through SIRT1/SGK1/Nedd4-2 pathway in A549 cells. (A) A549 Cells were stimulated by LPS (1 mug/mL) with different concentrations of melatonin (10, 100 nM, 1 and 10 muM) for 24 h (B-G) A549 cells were treated with LPS in the presence or absence of melatonin (1 µM) for 24 h. Inhibitor of SIRT1, EX527 (1 µM) was administrated 1 h before melatonin. (B-E) The protein expression levels of alphaENaC, SIRT1, SGK1 and Nedd4-2 were measured by western blot using GAPDH as a loading control. Results obtained by densitometry ratios of target proteins to GAPDH. All values are means +- SD (n = 6). NS, no significance, *** p < 0.001; ** p < 0.01; * p < 0.05 (one-way ANOVA followed by Turkey post hoc test). (F, G) alphaENaC and SIRT1 were determined by immunofluorescence (H, I) Fluorescence intensity of SIRT1 and alpha-ENaC was determined by using ImageJ software (version 1.46, NIH, Bethesda, MD, USA, and all values were normalized to sham. All values are means +- SD ( n = 4). *** p < 0.001; ** p < 0.01; * p < 0.05 (one-way ANOVA followed by Turkey post hoc test).
- Submitted by
- Invitrogen Antibodies (provider)
- Main image

- Experimental details
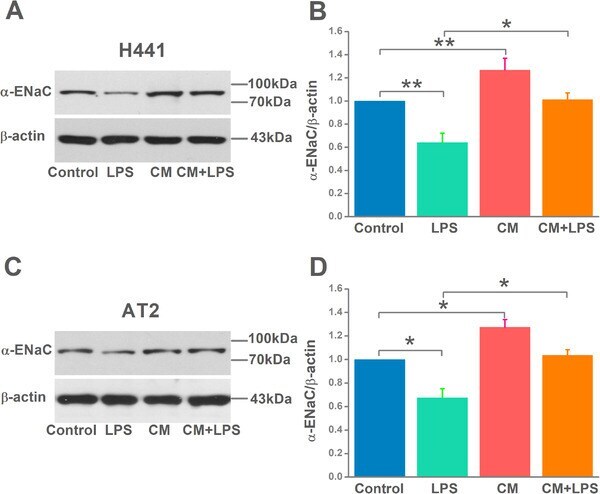
- FIGURE 3 Mesenchymal stem cell-conditioned medium (MSC-CM) increases alpha-epithelial sodium channel (alpha-ENaC) protein level in H441 and alveolar type 2 epithelial (AT2) cells. A and C, Representative western blot measurement of alpha-ENaC from H441 and AT2 cells treated with LPS (15 mug/mL) for 12 hours and/or MSC-CM for 24 hours. B and D, Semi-quantitation of western blots (alpha-ENaC/beta-actin). n = 4-5. * P < .05; ** P < .01
- Submitted by
- Invitrogen Antibodies (provider)
- Main image
- Experimental details
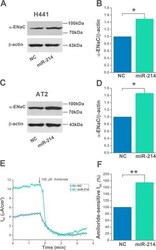
- FIGURE 5 Activation of epithelial sodium channel (ENaC) by mesenchymal stem cell-conditioned medium (MSC-CM) through regulating miR-214 levels. A and C, Representative western blot measurement of alpha-ENaC protein in H441 and AT2 cells transfected with miR-214 negative control (NC) or miR-214 mimic. B and D, Representative graphical representation of alpha-ENaC expression in H441 and AT2 cells, n = 4. E, Representative I sc traces recorded in H441 monolayers transfected with NC or miR-124 mimic. F, Average amiloride-sensitive I sc . n = 6. * P < .05; ** P < .01

- Submitted by
- Invitrogen Antibodies (provider)
- Main image
- Experimental details
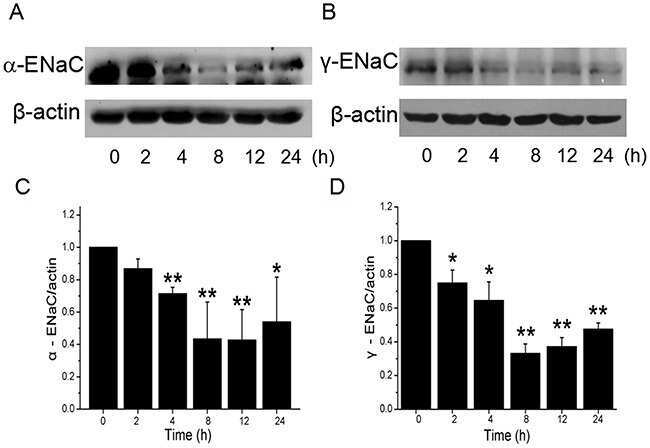
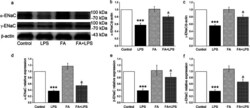
- Fig. 2 Effects of FA on the proteins and transcriptional expression level of ENaC in the trachea of mice. A C57BL/J male mice were treated intraperitoneally with normal saline or FA (100 mg/kg) 12 h before and 12 h after intratracheal administration of LPS (5 mg/kg), subsequently the proteins were extracted and analyzed by Western blot. The typical bands of alpha- and gamma-ENaC protein expression and beta-actin were used as internal controls. B and C Graphical representation of data obtained from Western blot assays for alpha- and gamma-ENaC subunits, which were quantified using gray analysis (alpha-ENaC/beta-actin and gamma-ENaC/beta-actin). D - F mRNA samples were isolated from mouse models of tracheal injury. Relative levels of mRNA were calculated as alpha- or beta- or gamma-ENaC/GAPDH ratios. *** P < 0.001, compared with Control group, & P < 0.05, compared with LPS group, n = 4-5

- Submitted by
- Invitrogen Antibodies (provider)
- Main image

- Experimental details
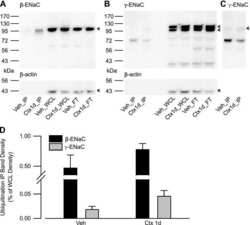
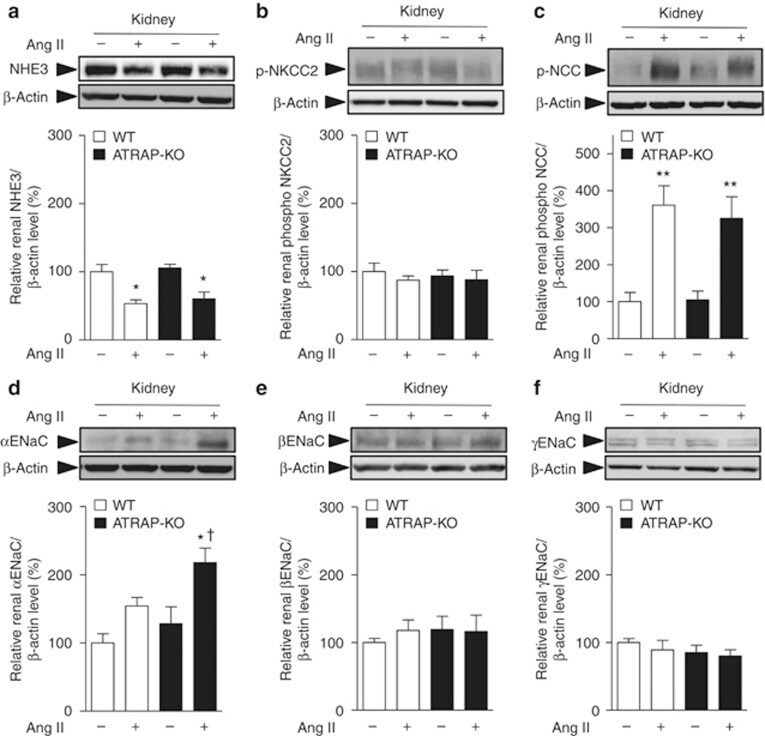
- Figure 6 Angiotensin II type 1 receptor (AT1R)-associated protein (ATRAP) deficiency enhances upregulation of renal alpha-subunit of the epithelial sodium channel (alphaENaC) protein expression by chronic angiotensin II (Ang II) infusion. Effects of Ang II (2000 ng/kg/min) infusion for 14 days on protein expression of the major sodium transporters ( a , sodium-proton antiporter 3 (NHE3); b , phosphorylated sodium-potassium-two chloride cotransporter (NKCC2) on Thr96; c , phosphorylated Na + -Cl - cotransporter (NCC) on Ser71; d , alphaENaC; e , betaENaC; and f , gammaENaC) in the kidneys of wild-type (WT) and ATRAP-knockout (KO) mice. Values are expressed as mean+-s.e. ( n =6-8 in each group). * P
- Submitted by
- Invitrogen Antibodies (provider)
- Main image
- Experimental details
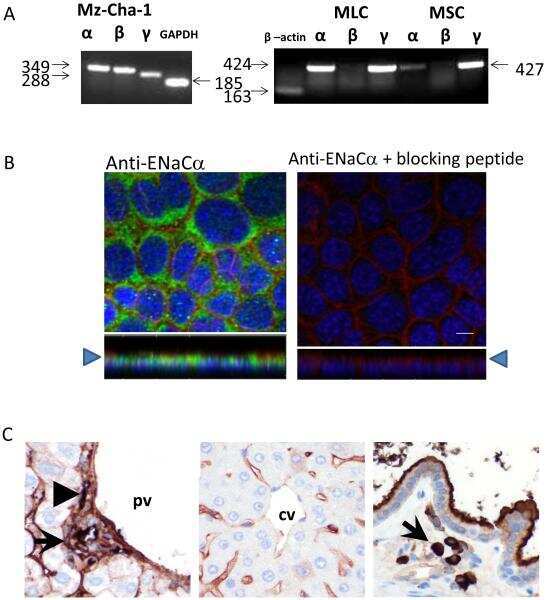
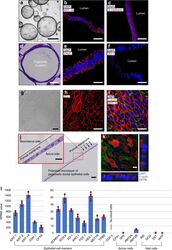
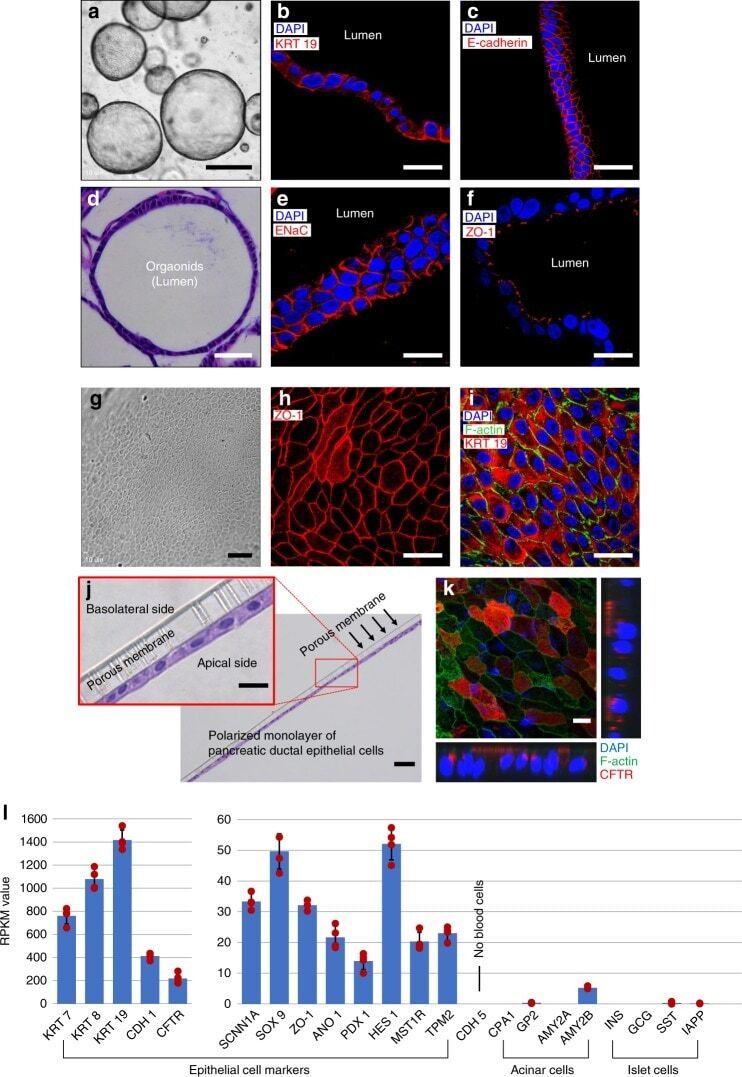
- Fig. 2 Characterization of pancreatic ductal epithelial cells. ( a - f , l : Characterization of organoids). a Characterization of pancreatic ductal organoids using epithelial cell markers, b cytokeratin 19 (KRT 19, c E-cadherin, e sodium transport channel (ENaC), and f ZO-1. d Hematoxylin and eosin (H&E) image shows the orientation of pancreatic ductal epithelial cells in spheroid of the organoid. ( g - k : Characterization of monolayer of pancreatic ductal epithelial cells (PDECs)). g Phase contrast and j H&E images show monolayer of PDECs formed from the organoids. Monolayer of PDECs showed positivity for tight junction h ZO-1, i F-actin and KRT 19, and k cystic fibrosis transmembrane conductance regulator (CFTR). l RNA-sequencing data was obtained from the pancreatic ductal organoids and verified the PDEC origin ( n = 4 sample preparation from the same patient). Data are mean +- SD. Scale bars: 10 um ( k ), 20 um ( b , c , e , f , h - j enlarge), 50 um ( d , g , j ), and 500 um ( a )
- Submitted by
- Invitrogen Antibodies (provider)
- Main image
- Experimental details
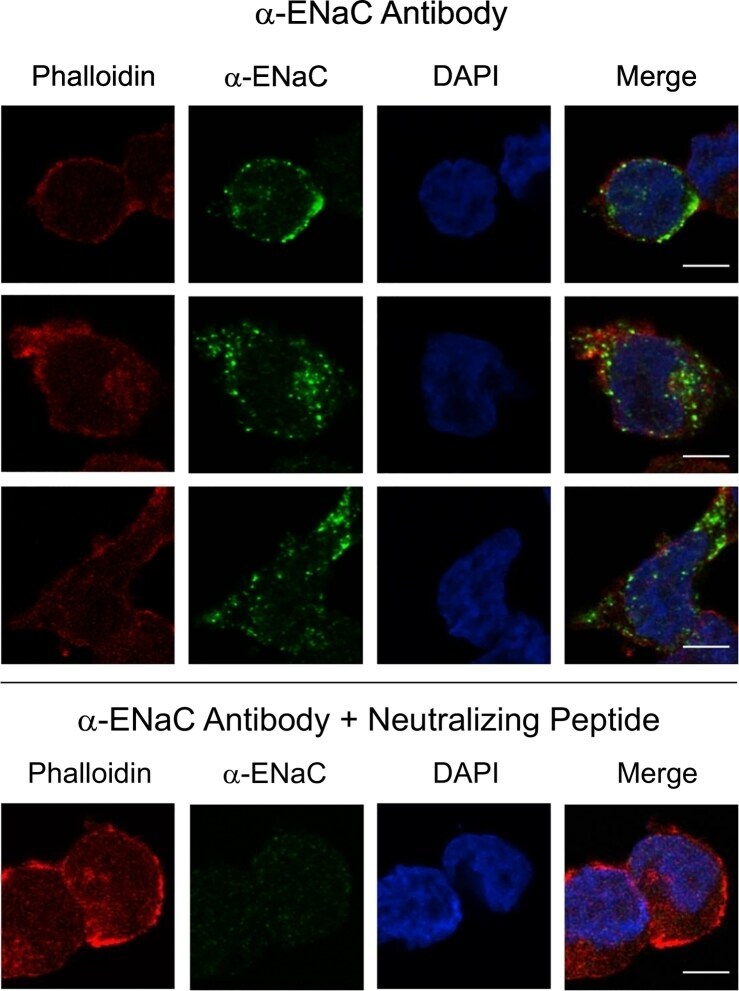
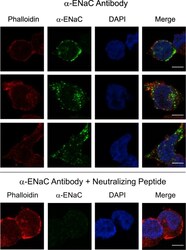
- Figure 3 Glass coverslips in six-well dishes were coated with Cultrex diluted 1:20 with PBS. The excess was removed, and H889 cells were plated on the coverslips. The following day, cells were fixed and subsequently analyzed by immunofluorescence with an antibody to alphaENaC. Phalloidin was used to identify the cell periphery and DAPI to locate nuclei. (Top) Three sets of images are shown without the neutralizing peptide, and (bottom) one set of images is shown with the peptide. The signal was specific also based on minimal background staining by omitting the primary antibody (not shown). Scale bars, 5 mum. Figure 3