Explore
 Validate
 Learn
Learn Western blot
 Immunocytochemistry
 Immunoprecipitation
Antibody data
- Antibody Data
- Antigen structure
- References [1]
- Comments [0]
- Validations
- Immunocytochemistry [2]
- Other assay [3]
Submit
Validation data
Reference
Comment
Report error
- Product number
- PA5-19617 - Provider product page

- Provider
- Invitrogen Antibodies
- Product name
- EEF2 Polyclonal Antibody
- Antibody type
- Polyclonal
- Antigen
- Synthetic peptide
- Description
- Heat mediated antigen retrieval recommended prior to tissue staining. This antibody is predicted to react with chicken, hamster, cow and Xenopus laevis based on sequence homology.
- Reactivity
- Human, Mouse, Rat, Zebrafish
- Host
- Rabbit
- Isotype
- IgG
- Vial size
- 100 μg
- Concentration
- 1 mg/mL
- Storage
- Store at 4°C short term. For long term storage, store at -20°C, avoiding freeze/thaw cycles.
Submitted references SIRT1 Protects the Heart from ER Stress-Induced Injury by Promoting eEF2K/eEF2-Dependent Autophagy.
Pires Da Silva J, Monceaux K, Guilbert A, Gressette M, Piquereau J, Novotova M, Ventura-Clapier R, Garnier A, Lemaire C
Cells 2020 Feb 12;9(2)
Cells 2020 Feb 12;9(2)
No comments: Submit comment
Supportive validation
- Submitted by
- Invitrogen Antibodies (provider)
- Main image

- Experimental details
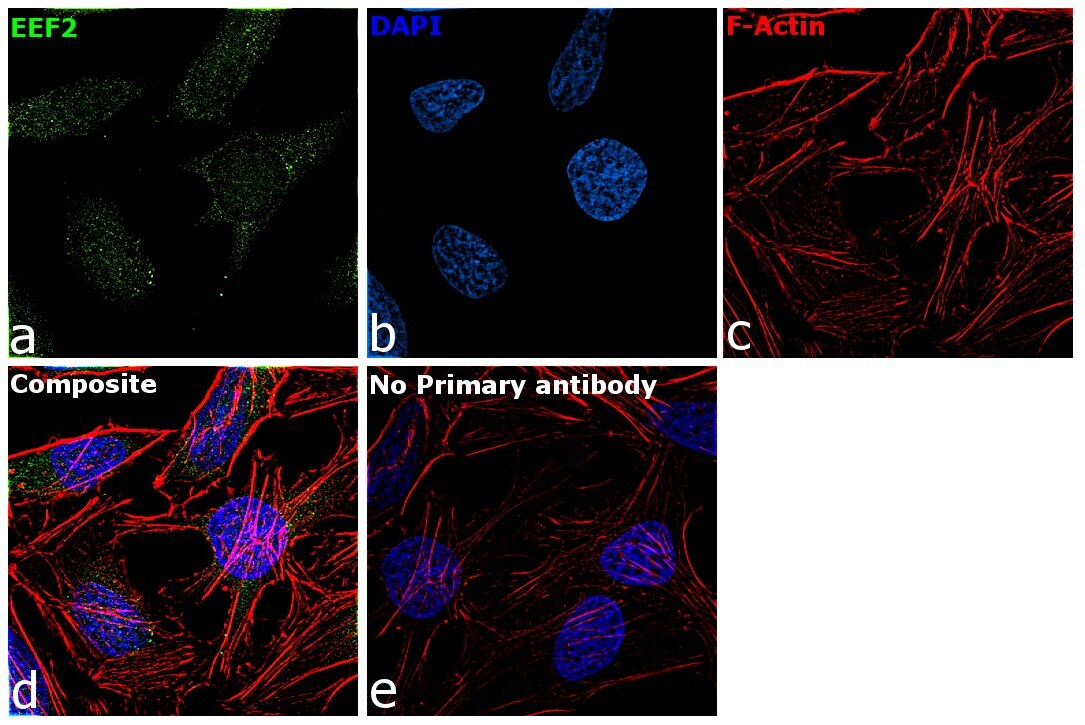
- Immunofluorescence analysis of EEF2 was performed using 70% confluent log phase HeLa cells. The cells were fixed with 4% paraformaldehyde for 10 minutes, permeabilized with 0.1% Triton™ X-100 for 10 minutes, and blocked with 2% BSA for 45 minutes at room temperature. The cells were labeled with EEF2 Polyclonal Antibody (Product # PA5-19617) at a concentration of 5 µg/mL in 0.1% BSA, incubated at 4 degree celsius overnight and then labeled with Donkey anti-Rabbit IgG (H+L) Highly Cross-Adsorbed Secondary Antibody, Alexa Fluor Plus 488 (Product # A32790), (1:2000 dilution), for 45 minutes at room temperature (Panel a: Green). Nuclei (Panel b:Blue) were stained with ProLong™ Diamond Antifade Mountant with DAPI (Product # P36962). F-actin (Panel c: Red) was stained with Rhodamine Phalloidin (Product # R415, 1:300 dilution). Panel d represents the merged image showing cytoplasmic localization. Panel e represents control cells with no primary antibody to assess background. The images were captured at 60X magnification.

- Submitted by
- Invitrogen Antibodies (provider)
- Main image

- Experimental details
- Immunofluorescence analysis of EEF2 was performed using 70% confluent log phase HeLa cells. The cells were fixed with 4% paraformaldehyde for 10 minutes, permeabilized with 0.1% Triton™ X-100 for 10 minutes, and blocked with 2% BSA for 45 minutes at room temperature. The cells were labeled with EEF2 Polyclonal Antibody (Product # PA5-19617) at a concentration of 5 µg/mL in 0.1% BSA, incubated at 4 degree celsius overnight and then labeled with Donkey anti-Rabbit IgG (H+L) Highly Cross-Adsorbed Secondary Antibody, Alexa Fluor Plus 488 (Product # A32790), (1:2000 dilution), for 45 minutes at room temperature (Panel a: Green). Nuclei (Panel b:Blue) were stained with ProLong™ Diamond Antifade Mountant with DAPI (Product # P36962). F-actin (Panel c: Red) was stained with Rhodamine Phalloidin (Product # R415, 1:300 dilution). Panel d represents the merged image showing cytoplasmic localization. Panel e represents control cells with no primary antibody to assess background. The images were captured at 60X magnification.
Supportive validation
- Submitted by
- Invitrogen Antibodies (provider)
- Main image
- Experimental details
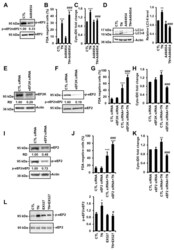
- Figure 6 SIRT1 activates eEF2K/eEF2-dependent autophagy in response to ER stress. ( A ) H9c2 cells were treated with 10 uM A484954 for 4 h (eEF2K inhibitor) and the level of phospho-eEF2 (p-eEF2) was analyzed by Western blot (n = 7). The ratio of p-eEF2 vs. total eEF2 is presented. ( B ) H9c2 cells were left untreated or treated with 10 mug/mL tunicamycin (TN) for 48 h +- 10 uM A484954, and cell viability was determined by Fluorescein Diacetate (FDA) assay. Results presented in the bar graph are expressed as mean +- S.E.M. of percentages of dead cells (FDA negative cells, n = 11). ( C ) Autophagy was monitored by flow cytometry after Cyto-ID (r) staining of H9c2 cells untreated or treated with 10 ug/mL tunicamycin (TN) for 24 h +- 10 uM A484954 (n = 11). ( D ) Cells were left untreated or treated with 10 mug/mL tunicamycin (TN) for 24 h +- 10 uM A484954 and the levels of LC3-II were analyzed by Western blot. Actin was used as a loading control. The relative mean expression level of LC3-II is presented in the bar graph. Error bars, S.E.M. (n = 5). ( E , F , I ) H9c2 cells were transfected with control, eEF2K or eEF2 siRNA, and eEF2K ( E ) or eEF2 ( I ) expression and eEF2 phosphorylation ( F , I ) were assessed after 24 h by Western blot. ( G , J ) H9c2 cells were transfected with control, eEF2K ( G ), or eEF2 ( J ) siRNA for 24 h, then treated for 48 h with tunicamycin (TN) and cell death (FDA negative cells) was measured by flow cytometry. Data in the bar graphs represent

- Submitted by
- Invitrogen Antibodies (provider)
- Main image

- Experimental details
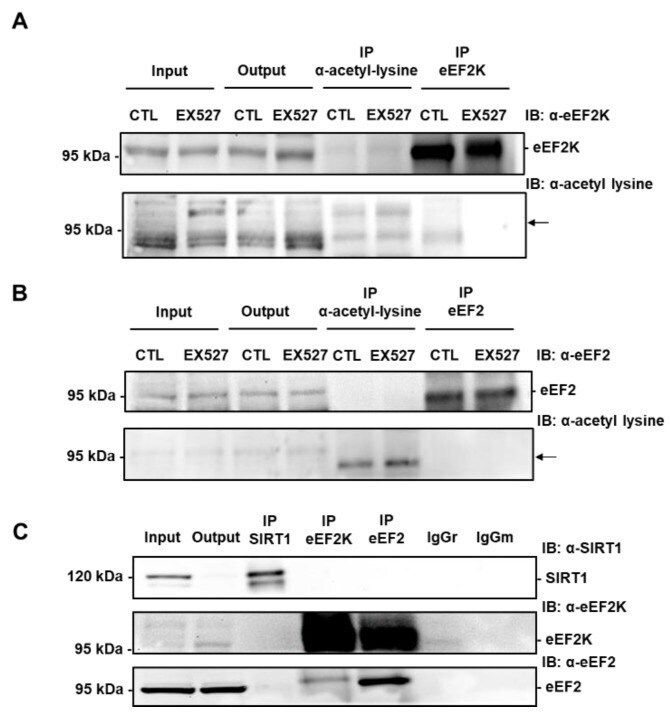
- Figure 7 eEF2K and eEF2 are not acetylated on lysine and do not co-immunoprecipitate with SIRT1 in H9c2 cells. ( A ) Immunoprecipitation of lysine-acetylated proteins or eEF2K from lysates of H9c2 cells treated or not with 50 uM EX527 (SIRT1 inhibitor) followed by immunoblotting with anti-eEF2K or anti-acetyl lysine antibodies (n = 3). ( B ) eEF2 was immunoprecipitated from lysates of H9c2 cells treated or not with 50 uM EX527 and its level of acetylation was analyzed by immunoblotting with anti-acetyl lysine antibodies (n = 3). The location of eEF2K and eEF2 is shown by an arrow. ( C ) The physical interaction between endogenous SIRT1 and eEF2K or eEF2 was analyzed by co-immunoprecipitation. Either SIRT1 or eEF2K or eEF2 was immunoprecipitated from H9c2 lysates and the presence of SIRT1, eEF2K and eEF2 was analyzed by Western blot in each precipitate. Input: Input fraction; Output: Supernatant after immunoprecipitation; IP: Immunoprecipitate. Negative controls: IgGr: Rabbit IgG; IgGm: Mouse IgG (n = 3).
- Submitted by
- Invitrogen Antibodies (provider)
- Main image

- Experimental details
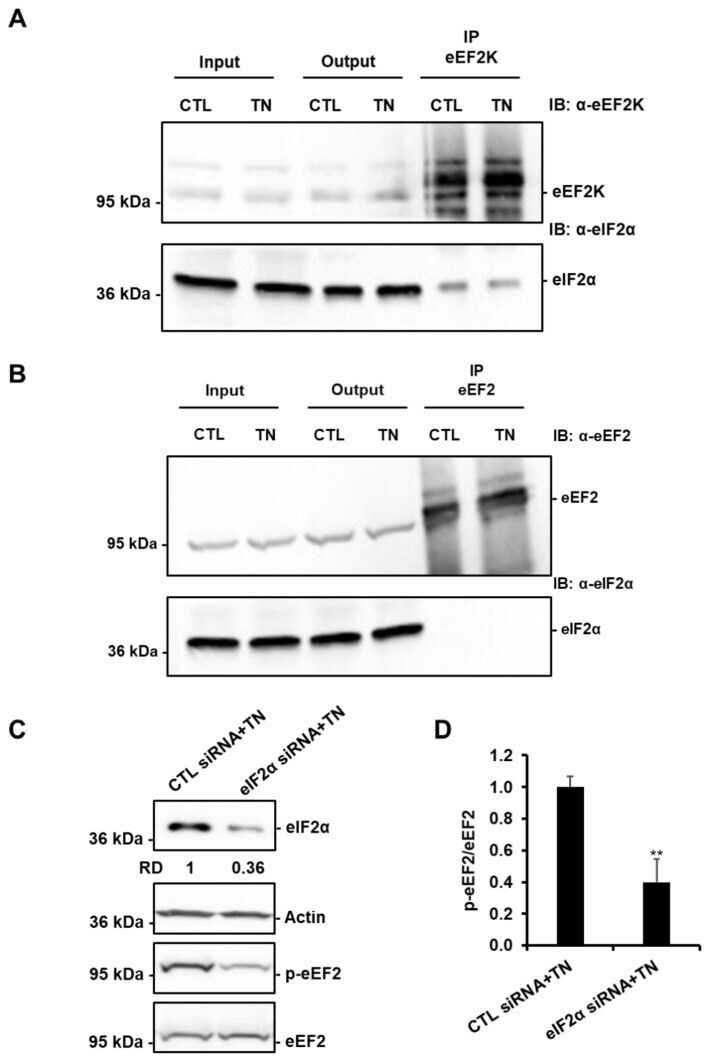
- Figure 8 eIF2alpha is involved in the regulation of eEF2 phosphorylation in response to ER stress. eEF2K ( A ) and eEF2 ( B ) were immunoprecipitated from lysates of H9c2 cells treated or not with 10 mug/mL tunicamycin (TN), and the presence of eEF2K or eEF2 and eIF2alpha were analyzed by Western blot (n = 3). ( C , D ) H9c2 cells were transfected with control or eIF2alpha siRNA for 24 h, treated with tunicamycin (TN) for 1h30, and the level of eIF2alpha or phospho-eEF2 was analyzed by Western blot (RD: Relative density). The ratio of p-eEF2 vs. total eEF2 is presented in the bar graph. Error bars, S.E.M. (n = 4). ** P < 0.01 versus CTL siRNA+TN.