Explore
 Validate
 Learn
LearnPA5-20077
antibody from Invitrogen Antibodies
Targeting: IL1RL1
DER4, FIT-1, IL33R, ST2, ST2L, ST2V, T1
 Western blot
Antibody data
- Antibody Data
- Antigen structure
- References [5]
- Comments [0]
- Validations
- Western blot [2]
- Immunocytochemistry [2]
- Immunohistochemistry [5]
- Other assay [4]
Submit
Validation data
Reference
Comment
Report error
- Product number
- PA5-20077 - Provider product page

- Provider
- Invitrogen Antibodies
- Product name
- ST2 Polyclonal Antibody
- Antibody type
- Polyclonal
- Antigen
- Synthetic peptide
- Description
- The immunogenic sequence is common to all three known ST2 isoforms. A suggested positive control is 293 cell lysate. PA5-20077 can be used with blocking peptide PEP-0195.
- Reactivity
- Human, Mouse
- Host
- Rabbit
- Isotype
- IgG
- Vial size
- 100 μg
- Concentration
- 1 mg/mL
- Storage
- Maintain refrigerated at 2-8°C for up to 3 months. For long term storage store at -20°C
Submitted references Type 2 Innate Lymphoid Cells Accumulate in the Brain After Hypoxia-Ischemia but Do Not Contribute to the Development of Preterm Brain Injury.
Epidermal Growth Factor Receptor Expression Licenses Type-2 Helper T Cells to Function in a T Cell Receptor-Independent Fashion.
Expression of interleukin-33 and its receptor ST2 in periapical granulomas and radicular cysts.
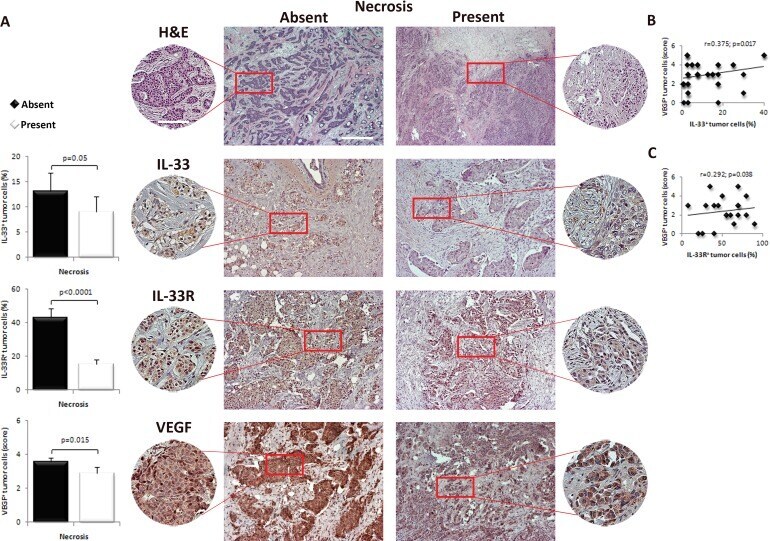
Deletion of IL-33R attenuates VEGF expression and enhances necrosis in mammary carcinoma.
ST2 deletion increases inflammatory bone destruction in experimentally induced periapical lesions in mice.
Zelco A, Rocha-Ferreira E, Nazmi A, Ardalan M, Chumak T, Nilsson G, Hagberg H, Mallard C, Wang X
Frontiers in cellular neuroscience 2020;14:249
Frontiers in cellular neuroscience 2020;14:249
Epidermal Growth Factor Receptor Expression Licenses Type-2 Helper T Cells to Function in a T Cell Receptor-Independent Fashion.
Minutti CM, Drube S, Blair N, Schwartz C, McCrae JC, McKenzie AN, Kamradt T, Mokry M, Coffer PJ, Sibilia M, Sijts AJ, Fallon PG, Maizels RM, Zaiss DM
Immunity 2017 Oct 17;47(4):710-722.e6
Immunity 2017 Oct 17;47(4):710-722.e6
Expression of interleukin-33 and its receptor ST2 in periapical granulomas and radicular cysts.
Velickovic M, Pejnovic N, Petrovic R, Mitrovic S, Jeftic I, Kanjevac T, Lukic A
Journal of oral pathology & medicine : official publication of the International Association of Oral Pathologists and the American Academy of Oral Pathology 2016 Jan;45(1):70-6
Journal of oral pathology & medicine : official publication of the International Association of Oral Pathologists and the American Academy of Oral Pathology 2016 Jan;45(1):70-6
Deletion of IL-33R attenuates VEGF expression and enhances necrosis in mammary carcinoma.
Milosavljevic MZ, Jovanovic IP, Pejnovic NN, Mitrovic SL, Arsenijevic NN, Simovic Markovic BJ, Lukic ML
Oncotarget 2016 Apr 5;7(14):18106-15
Oncotarget 2016 Apr 5;7(14):18106-15
ST2 deletion increases inflammatory bone destruction in experimentally induced periapical lesions in mice.
Velickovic M, Pejnovic N, Mitrovic S, Radosavljevic G, Jovanovic I, Kanjevac T, Jovicic N, Lukic A
Journal of endodontics 2015 Mar;41(3):369-75
Journal of endodontics 2015 Mar;41(3):369-75
No comments: Submit comment
Supportive validation
- Submitted by
- Invitrogen Antibodies (provider)
- Main image

- Experimental details
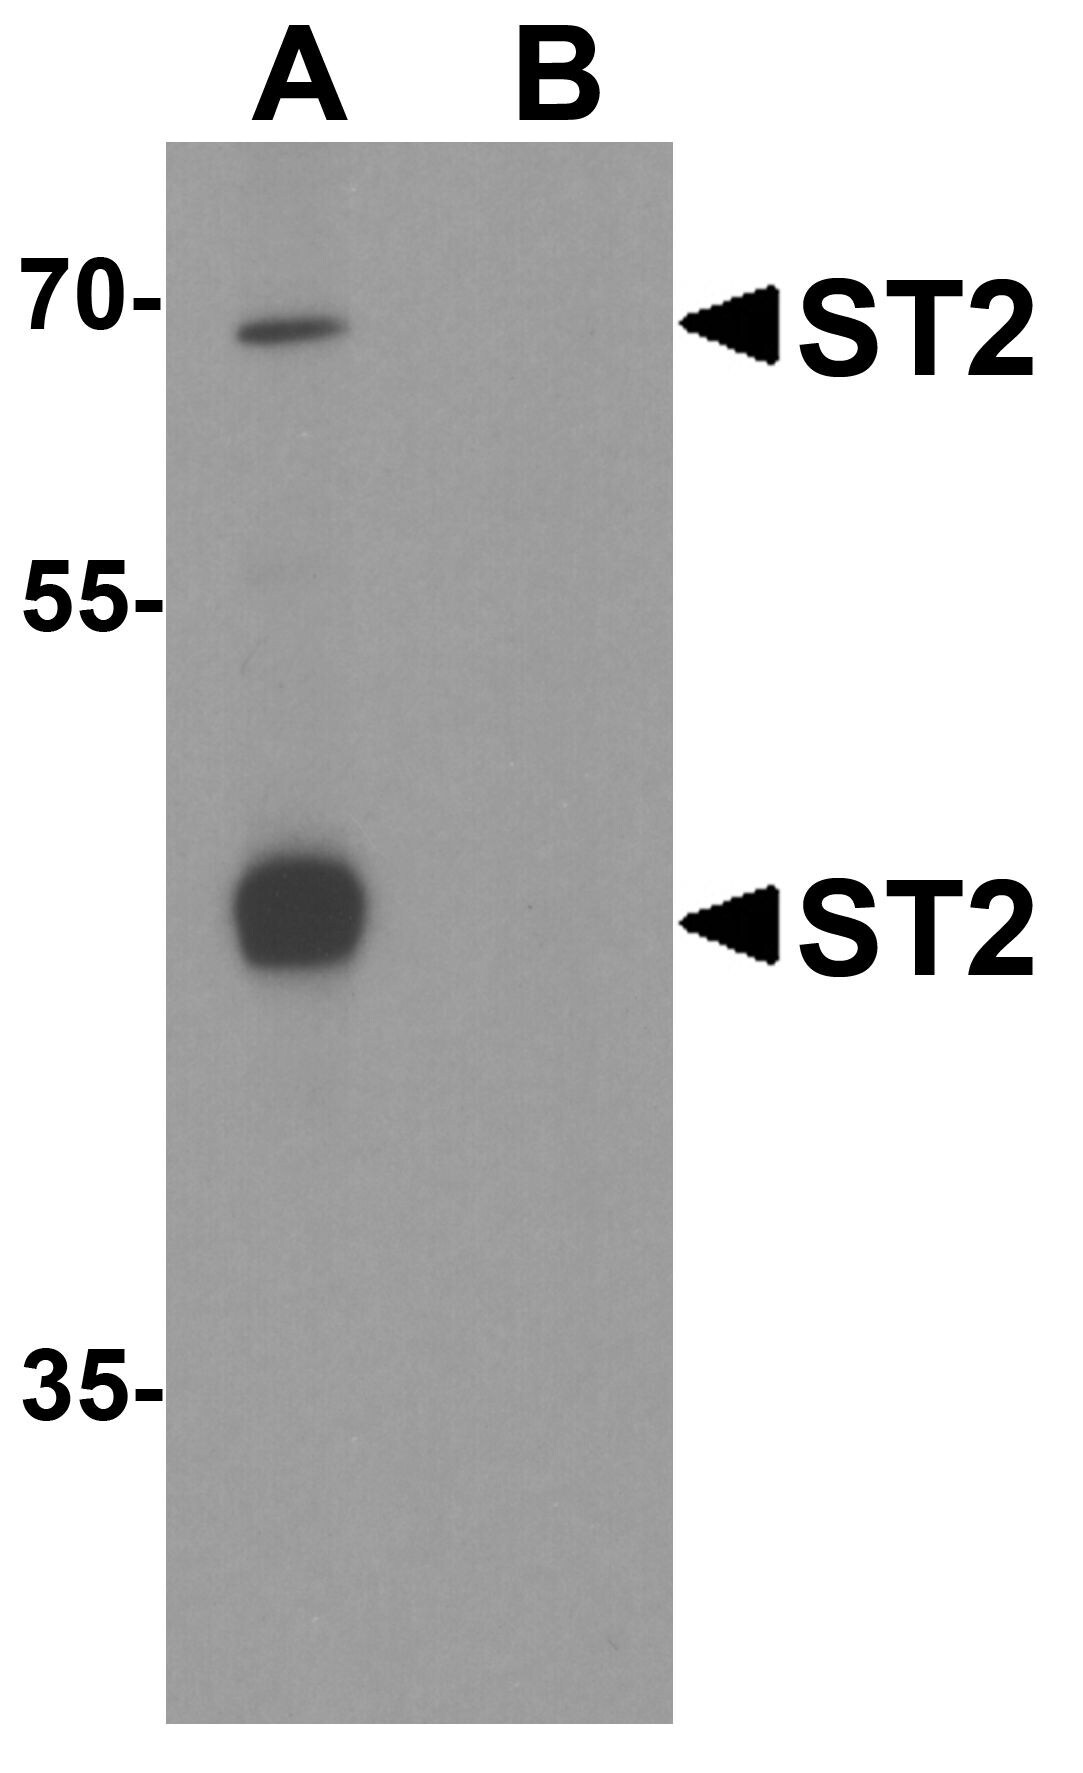
- Western Blot analysis of ST2 in 293 cell lysate with ST2 Polyclonal Antibody (Product # PA5-20077) at 1 μg/mL in (A) the absence and (B) the presence of blocking peptide.
- Submitted by
- Invitrogen Antibodies (provider)
- Main image
- Experimental details
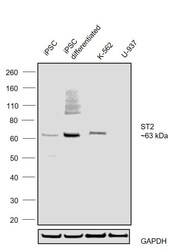
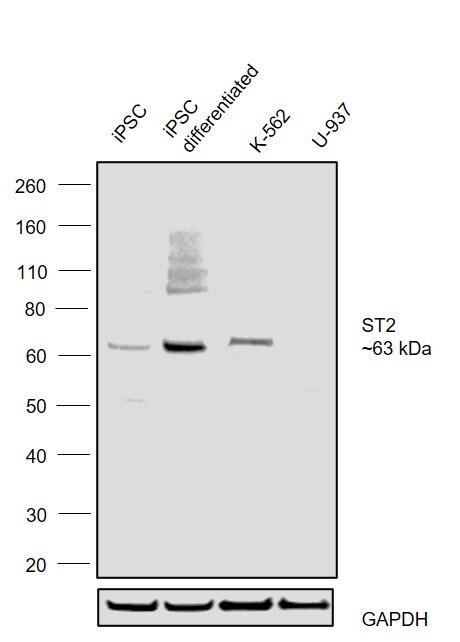
- Western blot was performed using Anti-ST2 Polyclonal Antibody (Product # PA5-20077) and a ~63 kDa band corresponding to Interleukin-1 receptor-like 1 was observed across cell lines tested . Membrane enriched extracts (50 µg lysate) of iPSC (Lane 1), iPSC differentiated into cardiomyocytes (Lane 2), K-562 (Lane 3), U-937 (Lane 4) were electrophoresed using NuPAGE™ 4-12% Bis-Tris Protein Gel (Product # NP0321BOX). Resolved proteins were then transferred onto a nitrocellulose membrane (Product # IB23001) by iBlot® 2 Dry Blotting System (Product # IB21001). The blot was probed with the primary antibody (1 µg/mL) and detected by chemiluminescence with Goat anti-Rabbit IgG (Heavy Chain) Superclonal™ Recombinant Secondary Antibody, HRP (Product # A27036,1:20000) using the iBright FL 1000 (Product # A32752). Chemiluminescent detection was performed using SuperSignal™ West Pico PLUS Chemiluminescent Substrate (Product # 34580).Increased expression observed in cardiomyocyte differentiated iPSCs and K-562 as compared to in U-937.
Supportive validation
- Submitted by
- Invitrogen Antibodies (provider)
- Main image

- Experimental details
- Immunofluorescence of ST2 in Mouse Kidney cells with ST2 Polyclonal Antibody (Product # PA5-20077) at 20 µg/mL.

- Submitted by
- Invitrogen Antibodies (provider)
- Main image
- Experimental details
- Immunofluorescence of ST2 in Mouse Kidney cells with ST2 Polyclonal Antibody (Product # PA5-20077) at 20 µg/mL.

Supportive validation
- Submitted by
- Invitrogen Antibodies (provider)
- Main image

- Experimental details
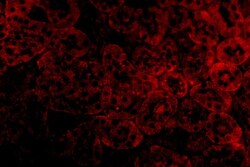
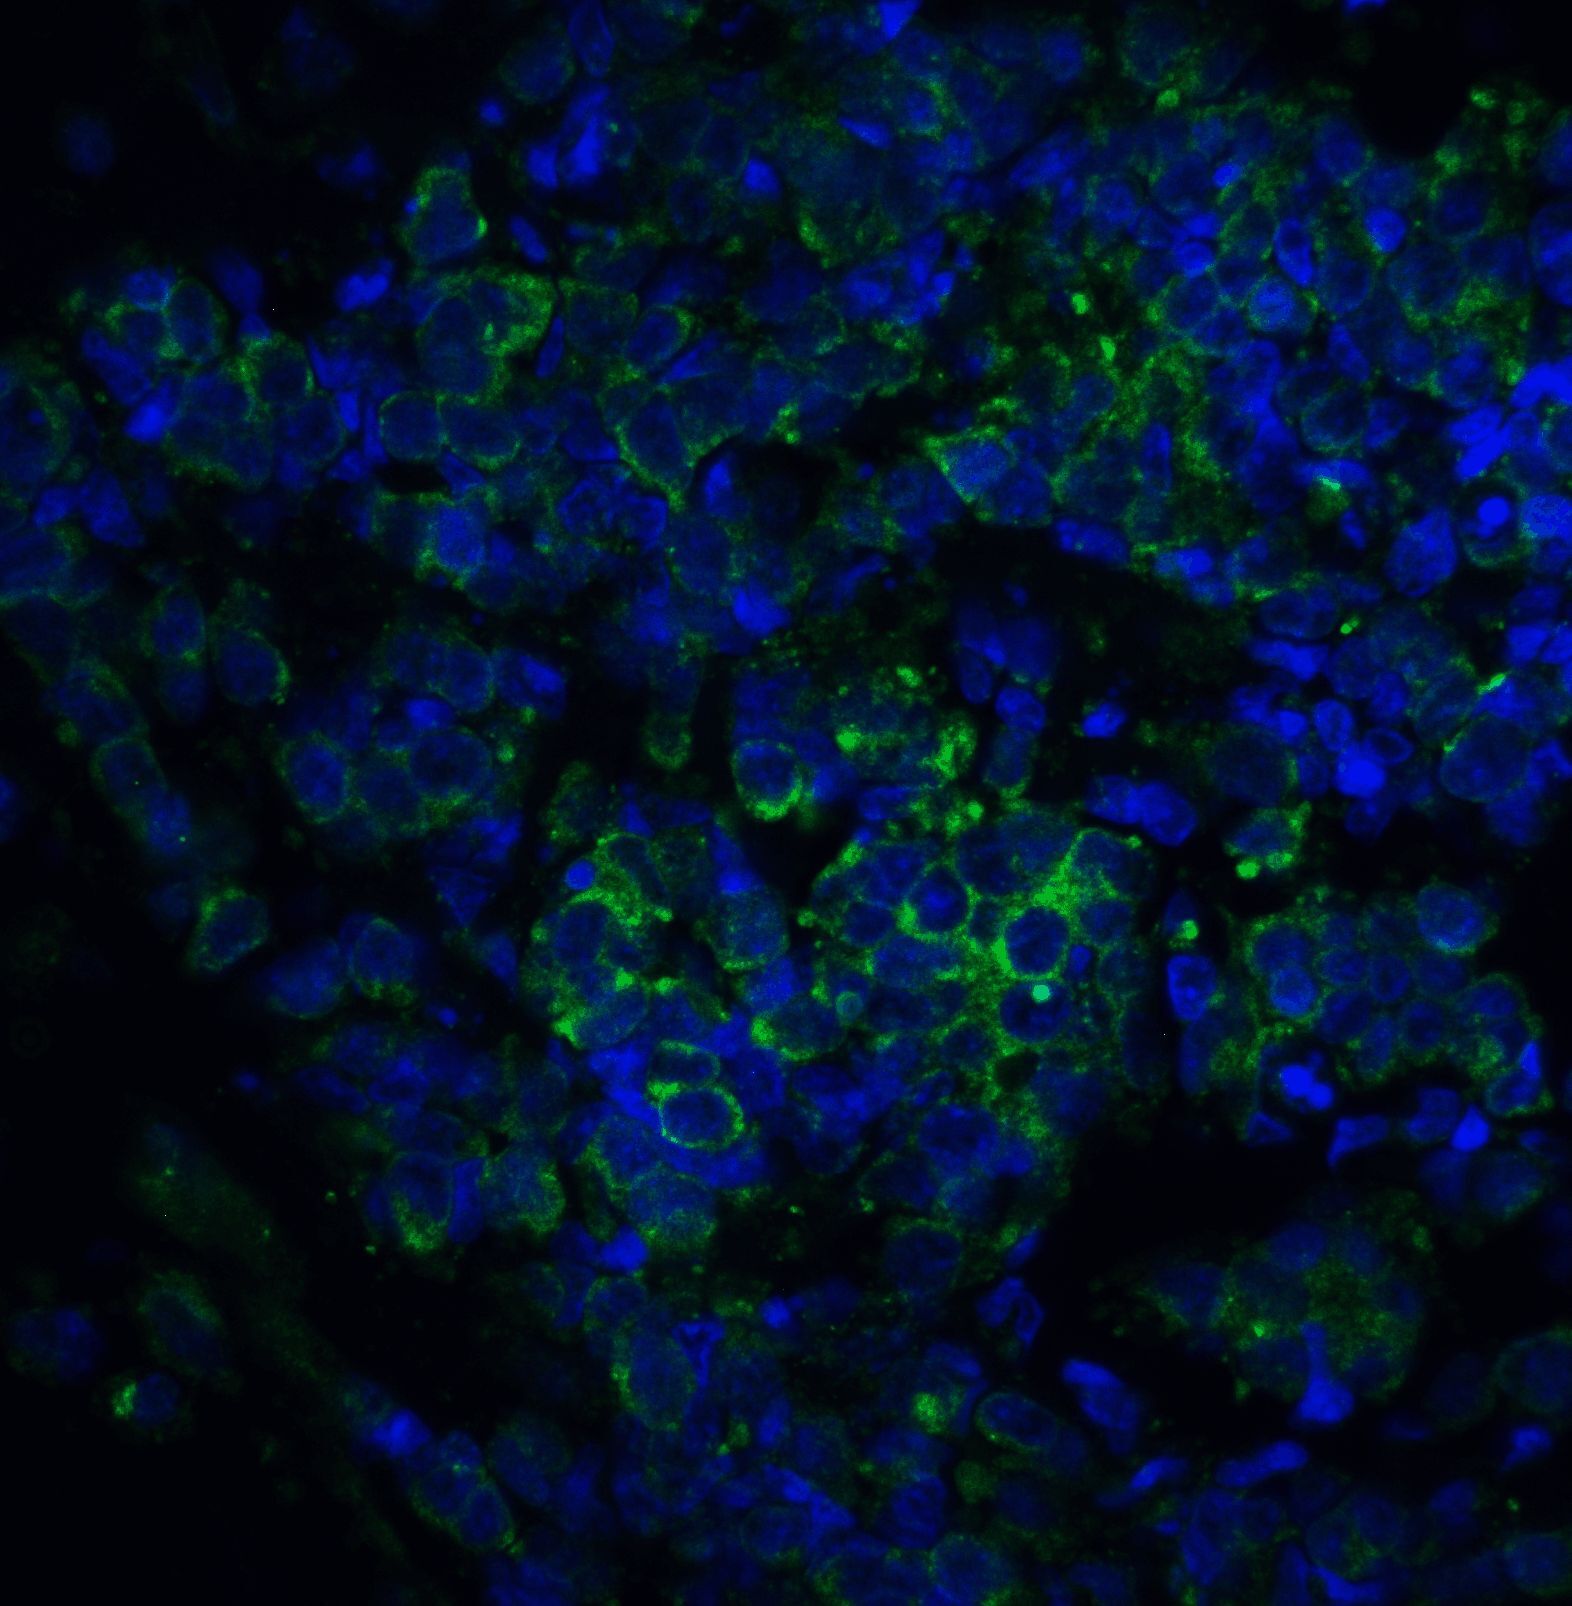
- Immunofluorescence of ST2 in human lung cancer tissue with ST2 Polyclonal Antibody (Product # PA5-20077) at 5 µg/mL. Green: ST2 Blue: DAPI staining
- Submitted by
- Invitrogen Antibodies (provider)
- Main image
- Experimental details
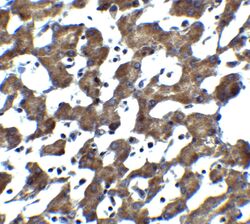
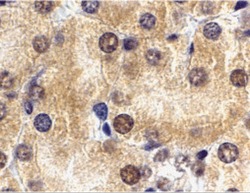
- Immunohistochemistry of ST2 in human liver tissue with ST2 Polyclonal Antibody (Product # PA5-20077) at 5 µg/mL.

- Submitted by
- Invitrogen Antibodies (provider)
- Main image
- Experimental details
- Immunohistochemistry of ST2 in mouse kidney tissue with ST2 Polyclonal Antibody (Product # PA5-20077) at 2 µg/mL.

- Submitted by
- Invitrogen Antibodies (provider)
- Main image
- Experimental details
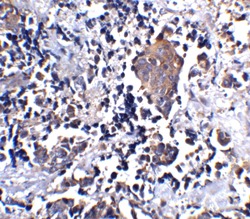
- Immunohistochemistry of ST2 in human lung cancer tissue with ST2 Polyclonal Antibody (Product # PA5-20077) at 5 µg/mL.

- Submitted by
- Invitrogen Antibodies (provider)
- Main image

- Experimental details
- Immunofluorescence of ST2 in human lung cancer tissue with ST2 Polyclonal Antibody (Product # PA5-20077) at 5 µg/mL. Green: ST2 Blue: DAPI staining

Supportive validation
- Submitted by
- Invitrogen Antibodies (provider)
- Main image

- Experimental details
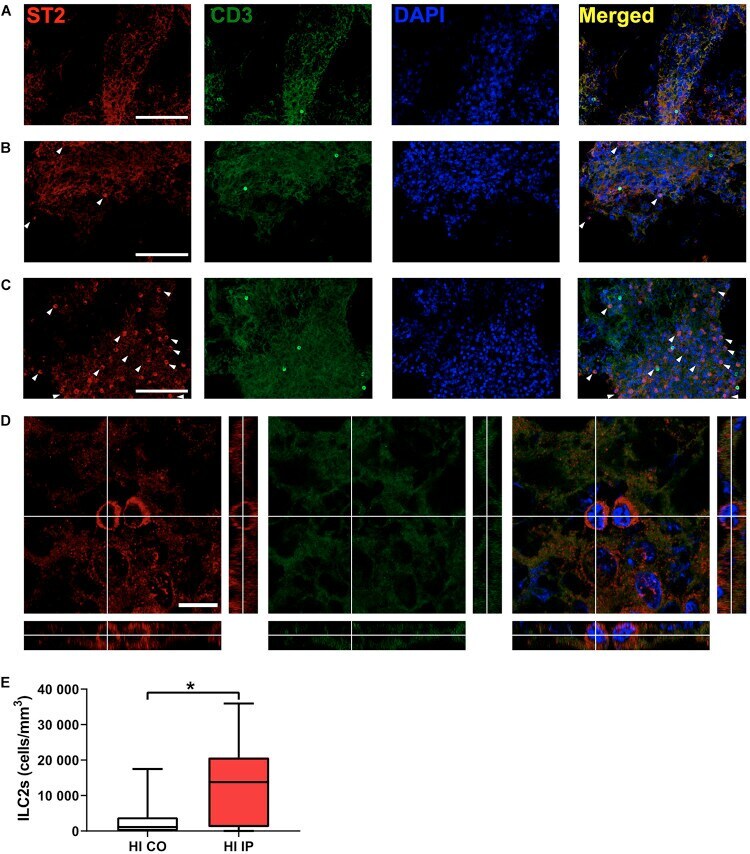
- FIGURE 3 The presence of ILC2s in the meninges in neonatal mice after HI. Representative confocal images of immunofluorescent staining showing the presence of ILC2s (CD3 - ST2 + , arrowheads) in the meninges taken from brain hemispheres in a naive mouse (A) and from the contralateral hemisphere (B) and ipsilateral hemisphere (C) in a mouse at 7 days after HI. (D) High magnification orthogonal views of cells stained with ST2. The merged picture shows cytoplasm localization of ST2 surrounding DAPI + nuclei. Scale bars: (A-C) 100 mum; (D) 10 mum. (E) The number density of ILC2-positive cells in the meninges in the ipsilateral hemisphere and contralateral hemispheres after HI. Paired t -test was used. * p < 0.05. Abbreviations: HI: hypoxia-ischemia, IP: ipsilateral hemisphere, CO: contralateral hemisphere.
- Submitted by
- Invitrogen Antibodies (provider)
- Main image
- Experimental details
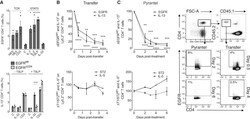
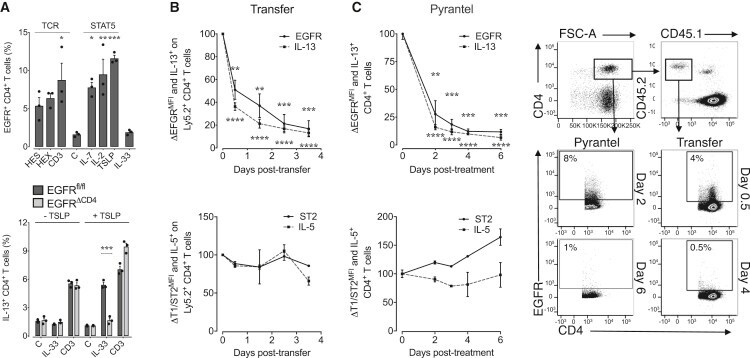
- Figure 4 Transient EGFR Expression Licenses Th2 Cells to Express IL-13 in Response to IL-33 (A) Splenocytes were isolated from H. polygyrus -infected WT and Egfr fl/fl xCd4-cre (EGFR DeltaCD4 ) mice, and expression of EGFR on T cells was determined by flow cytometry analysis after overnight incubation with H. polygyrus excretory-secretory products (HES), adult worm extract (HEX), anti-CD3, vehicle (C), rIL-7, rIL-2, rTSLP, or rIL-33 (upper). Alternatively (lower), splenocytes were stimulated overnight with rTSLP, and subsequently, IL-13 expression by T cells was analyzed by intra-cellular cytokine staining and flow cytometry analysis following re-stimulation with rIL-33 or anti-CD3 antibody. (B) Ly5.2 + WT mice were infected with H. polygyrus , and 2 weeks after infection, mLN cells were transferred into naive Ly5.1 + hosts. Spleens of recipient mice were harvested after 0-3.5 days post transfer, and the expression of EGFR (upper) and T1/ST2 (lower) on transferred Ly5.2 + CD4 + T cells was determined by flow cytometry analysis. Expression of IL-13 (upper) and IL-5 (lower) upon exposure to rIL-33 was determined by intra-cellular cytokine expression and flow cytometry analysis (n = 3 mice). (C) WT H. polygyrus -infected mice were treated with pyrantel embonate, and mLN were harvested after 0-6 days post treatment. EGFR (upper) and T1/ST2 (lower) expression on CD4 + T cells was determined by flow cytometry, and expression of IL-13 (upper) and IL-5 (lower) upon exposure to IL-33
- Submitted by
- Invitrogen Antibodies (provider)
- Main image
- Experimental details
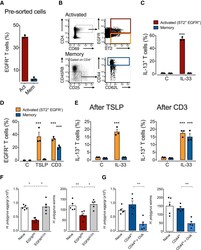
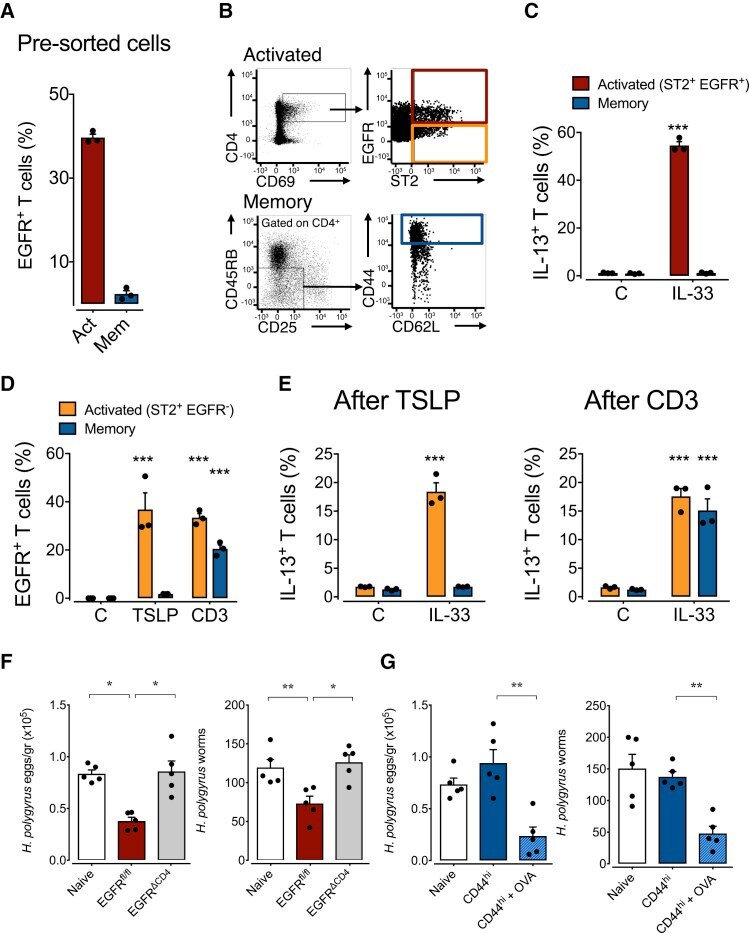
- Figure 5 EGFR Expression on Th2 Cells Is Induced by TCR Activation and Maintained by Cytokines (A-E) WT H. polygyrus -infected mice were either treated with pyrantel embonate or left untreated; mLN were collected 14 days after treatment. (A) EGFR expression on activated (CD69 + , red bars) or memory (CD25 - CD45RB low CD44 hi , blue bars) CD4 + T cells was analyzed by flow cytometry. (B) Activated CD4 + T cells were flow cytometry-sorted from infected mice into ST2 + EGFR + (red) and ST2 + EGFR - (orange) populations. Memory CD4 + T cells (CD25 - CD45RB low CD44 hi ) were flow cytometry-sorted from dewormed mice. (C) After sorting, activated EGFR + and memory cells were stimulated with rIL-33 or media only, and expression of IL-13 was determined by flow cytometry analysis. (D-E) Activated EGFR - and memory cells were cultured overnight with rTSLP or anti-CD3 antibodies, and expression of EGFR on CD4 + T cells was determined by flow cytometry analysis (D) or were re-stimulated with rIL-33 and expression of IL-13 determined by intra-cellular cytokine staining and flow cytometry analysis (E). (F-G) Egfr fl/fl xCd4-cre (EGFR DeltaCD4 ) mice were infected with H. polygyrus and received either flow cytometry-sorted activated CD4 T cells (red) (F) or flow cytometry-sorted naive or memory T cells (blue) (G) from OVA-challenged mice. Worm burden and egg counts in feces were determined 2 weeks post transfer. Data in (A)-(E) are representative of at least two independent experiments (me
- Submitted by
- Invitrogen Antibodies (provider)
- Main image
- Experimental details
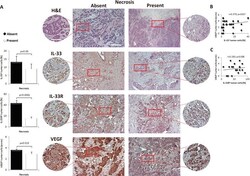
- Figure 3 IL-33, IL-33R and VEGF expression in human breast carcinoma with present or absent tumor necrosis A. Representative images of human mammary carcinoma with and without necrosis (H&E, original magnification: x100, scale bar: 200mum; x200, scale bar: 100mum). IL-33, IL-33R and VEGF expression was evaluated by immunohistochemistry for each patient (original magnification: x100, scale bar: 200mum; x200, scale bar: 100mum). The difference in the expression of immunohistochemical markers was examined between tumors with and without necrosis. B. , C. Correlation between IL-33 and IL-33R with VEGF expression in tumor cells in human mammary carcinoma tissues. Statistical significance was tested by Mann-Whitney Rank Sum test, independent samples t-test or Spearman correlation coefficient.