Explore
 Validate
 Learn
Learn Western blot
 Other assay
Antibody data
- Antibody Data
- Antigen structure
- References [1]
- Comments [0]
- Validations
- Other assay [1]
Submit
Validation data
Reference
Comment
Report error
- Product number
- PA5-30637 - Provider product page

- Provider
- Invitrogen Antibodies
- Product name
- UBASH3A Polyclonal Antibody
- Antibody type
- Polyclonal
- Antigen
- Recombinant full-length protein
- Description
- Recommended positive controls: THP-1. Predicted reactivity: Human (99%), Dog (81%). Store product as a concentrated solution. Centrifuge briefly prior to opening the vial.
- Reactivity
- Human
- Host
- Rabbit
- Isotype
- IgG
- Vial size
- 100 μL
- Concentration
- 1 mg/mL
- Storage
- Store at 4°C short term. For long term storage, store at -20°C, avoiding freeze/thaw cycles.
Submitted references The T cell CD6 receptor operates a multitask signalosome with opposite functions in T cell activation.
Mori D, Grégoire C, Voisinne G, Celis-Gutierrez J, Aussel R, Girard L, Camus M, Marcellin M, Argenty J, Burlet-Schiltz O, Fiore F, Gonzalez de Peredo A, Malissen M, Roncagalli R, Malissen B
The Journal of experimental medicine 2021 Feb 1;218(2)
The Journal of experimental medicine 2021 Feb 1;218(2)
No comments: Submit comment
Supportive validation
- Submitted by
- Invitrogen Antibodies (provider)
- Main image
- Experimental details
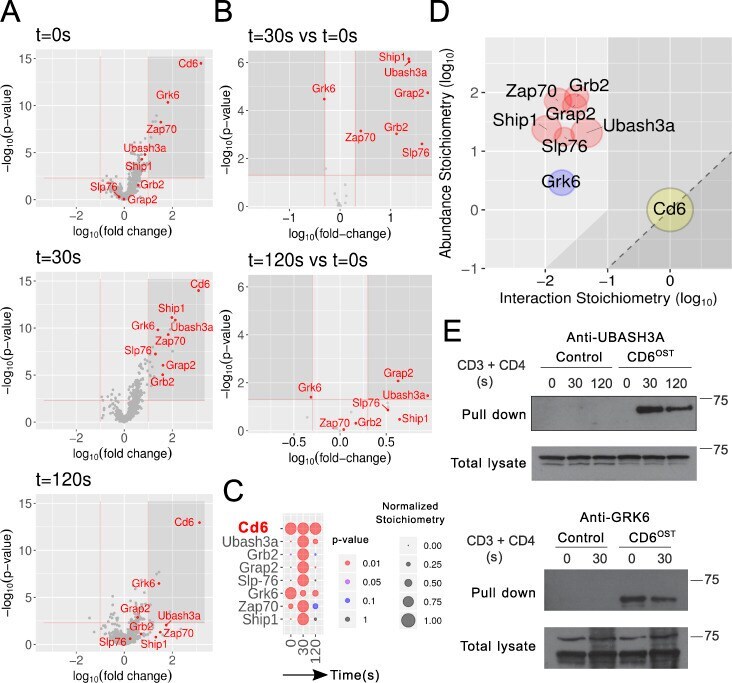
- Figure 3. Composition and dynamics of the CD6 signalosome of long-term expanded CD6 OST CD4 + T cells. (A) Volcano plot showing proteins significantly enriched after affinity purification in CD4 + T cells expressing CD6 OST molecules compared with affinity purification in control CD4 + T cells expressing similar levels of WT (untagged) CD6 proteins before (t 0s ) and at 30 s (t 30s ) and 120 s (t 120s ) after TCR plus CD4 stimulation. (B) Volcano plot showing proteins significantly enriched after affinity purification in CD6 OST -expressing CD4 + T cells 30 and 120 s after TCR engagement compared with affinity purification in unstimulated CD6 OST -expressing CD4 + T cells. For A and B, see description in Fig. 2 B . (C) Dot plot showing the interaction stoichiometry over the course of TCR stimulation of CD6 with its seven high-confidence preys, the interaction stoichiometry of which changed following TCR engagement. See description in Fig. 2 C . (D) Stoichiometry plot of the CD6 interactome. The CD6 bait is shown as a yellow dot. Red and blue dots correspond to preys that showed increased or decreased binding following TCR stimulation. The purple dot corresponds to a prey whose association was not regulated by TCR stimulation. See description in Fig. 2 D . (E) Biochemical validation of the CD6-UBASH3A and CD6-GRK6 interactions predicted on the basis of AP-MS analysis. Long-term-expanded WT (Control) and CD6 OST -expressing CD4 + T cells were left unstimulated (0) or were stimu