Explore
 Validate
 Learn
Learn Western blot
 Immunocytochemistry
Antibody data
- Antibody Data
- Antigen structure
- References [13]
- Comments [0]
- Validations
- Immunocytochemistry [5]
- Flow cytometry [1]
- Other assay [18]
Submit
Validation data
Reference
Comment
Report error
- Product number
- 48-8400 - Provider product page

- Provider
- Invitrogen Antibodies
- Product name
- MARVELD2 Polyclonal Antibody
- Antibody type
- Polyclonal
- Antigen
- Recombinant full-length protein
- Description
- This antibody is specific for the Tricellulin/MARVELD-2 protein. On western blots, it identifies the target band at ~64 kDa. Reactivity has been confirmed with human Caco-2, dog MDCK, mouse IMCD-3 cells, and mouse kidney lysates by western blotting, and with mouse MTE7b cells by immunocytochemistry. Based on amino acid sequence homology, reactivity with Rhesus monkey, chimpanzee, rat, bovine, and horse is expected.
- Reactivity
- Human, Mouse, Rat
- Host
- Rabbit
- Isotype
- IgG
- Vial size
- 100 μg
- Concentration
- 0.25 mg/mL
- Storage
- Store at 4°C short term. For long term storage, store at -20°C, avoiding freeze/thaw cycles.
Submitted references The endothelium permeability after bioresorbable scaffolds implantation caused by the heterogeneous expression of tight junction proteins.
Angulin-1 seals tricellular contacts independently of tricellulin and claudins.
Luminal polyethylene glycol solution delays the onset of preservation injury in the human intestine.
Spatio-temporal expression pattern and role of the tight junction protein MarvelD3 in pancreas development and function.
Diesel exhaust particle exposure reduces expression of the epithelial tight junction protein Tricellulin.
Association of tricellulin expression with poor colorectal cancer prognosis and metastasis.
The extracellular domain of angulin-1 and palmitoylation of its cytoplasmic region are required for angulin-1 assembly at tricellular contacts.
Claudins and JAM-A coordinately regulate tight junction formation and epithelial polarity.
Blood-spinal cord barrier breakdown and pericyte deficiency in peripheral neuropathy.
Contractile forces at tricellular contacts modulate epithelial organization and monolayer integrity.
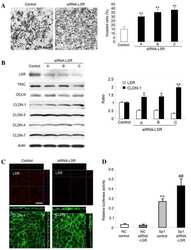
Downregulation of lipolysis-stimulated lipoprotein receptor promotes cell invasion via claudin-1-mediated matrix metalloproteinases in human endometrial cancer.
ILDR1 deficiency causes degeneration of cochlear outer hair cells and disrupts the structure of the organ of Corti: a mouse model for human DFNB42.
Zonula occludens-1 and -2 regulate apical cell structure and the zonula adherens cytoskeleton in polarized epithelia.
Huang J, Ge S, Luo D, Du R, Wang Y, Liu W, Wang G, Yin T
Materials today. Bio 2022 Dec;16:100410
Materials today. Bio 2022 Dec;16:100410
Angulin-1 seals tricellular contacts independently of tricellulin and claudins.
Sugawara T, Furuse K, Otani T, Wakayama T, Furuse M
The Journal of cell biology 2021 Sep 6;220(9)
The Journal of cell biology 2021 Sep 6;220(9)
Luminal polyethylene glycol solution delays the onset of preservation injury in the human intestine.
Søfteland JM, Bagge J, Padma AM, Casselbrant A, Zhu C, Wang Y, Hellström M, Olausson M, Oltean M
American journal of transplantation : official journal of the American Society of Transplantation and the American Society of Transplant Surgeons 2021 Jun;21(6):2220-2230
American journal of transplantation : official journal of the American Society of Transplantation and the American Society of Transplant Surgeons 2021 Jun;21(6):2220-2230
Spatio-temporal expression pattern and role of the tight junction protein MarvelD3 in pancreas development and function.
Heymans C, Delcorte O, Spourquet C, Villacorte-Tabelin M, Dupasquier S, Achouri Y, Mahibullah S, Lemoine P, Balda MS, Matter K, Pierreux CE
Scientific reports 2021 Jul 15;11(1):14519
Scientific reports 2021 Jul 15;11(1):14519
Diesel exhaust particle exposure reduces expression of the epithelial tight junction protein Tricellulin.
Smyth T, Veazey J, Eliseeva S, Chalupa D, Elder A, Georas SN
Particle and fibre toxicology 2020 Oct 15;17(1):52
Particle and fibre toxicology 2020 Oct 15;17(1):52
Association of tricellulin expression with poor colorectal cancer prognosis and metastasis.
Zhang JX, Qin MB, Ye Z, Peng P, Li SM, Song Q, Lin L, Liu SQ, Xie LH, Zhu Y, Huang JA
Oncology reports 2020 Nov;44(5):2174-2184
Oncology reports 2020 Nov;44(5):2174-2184
The extracellular domain of angulin-1 and palmitoylation of its cytoplasmic region are required for angulin-1 assembly at tricellular contacts.
Oda Y, Sugawara T, Fukata Y, Izumi Y, Otani T, Higashi T, Fukata M, Furuse M
The Journal of biological chemistry 2020 Mar 27;295(13):4289-4302
The Journal of biological chemistry 2020 Mar 27;295(13):4289-4302
Claudins and JAM-A coordinately regulate tight junction formation and epithelial polarity.
Otani T, Nguyen TP, Tokuda S, Sugihara K, Sugawara T, Furuse K, Miura T, Ebnet K, Furuse M
The Journal of cell biology 2019 Oct 7;218(10):3372-3396
The Journal of cell biology 2019 Oct 7;218(10):3372-3396
Blood-spinal cord barrier breakdown and pericyte deficiency in peripheral neuropathy.
Sauer RS, Kirchner J, Yang S, Hu L, Leinders M, Sommer C, Brack A, Rittner HL
Annals of the New York Academy of Sciences 2017 Oct;1405(1):71-88
Annals of the New York Academy of Sciences 2017 Oct;1405(1):71-88
Contractile forces at tricellular contacts modulate epithelial organization and monolayer integrity.
Salomon J, Gaston C, Magescas J, Duvauchelle B, Canioni D, Sengmanivong L, Mayeux A, Michaux G, Campeotto F, Lemale J, Viala J, Poirier F, Minc N, Schmitz J, Brousse N, Ladoux B, Goulet O, Delacour D
Nature communications 2017 Jan 13;8:13998
Nature communications 2017 Jan 13;8:13998
Downregulation of lipolysis-stimulated lipoprotein receptor promotes cell invasion via claudin-1-mediated matrix metalloproteinases in human endometrial cancer.
Shimada H, Satohisa S, Kohno T, Konno T, Takano KI, Takahashi S, Hatakeyama T, Arimoto C, Saito T, Kojima T
Oncology letters 2017 Dec;14(6):6776-6782
Oncology letters 2017 Dec;14(6):6776-6782
ILDR1 deficiency causes degeneration of cochlear outer hair cells and disrupts the structure of the organ of Corti: a mouse model for human DFNB42.
Sang Q, Li W, Xu Y, Qu R, Xu Z, Feng R, Jin L, He L, Li H, Wang L
Biology open 2015 Mar 27;4(4):411-8
Biology open 2015 Mar 27;4(4):411-8
Zonula occludens-1 and -2 regulate apical cell structure and the zonula adherens cytoskeleton in polarized epithelia.
Fanning AS, Van Itallie CM, Anderson JM
Molecular biology of the cell 2012 Feb;23(4):577-90
Molecular biology of the cell 2012 Feb;23(4):577-90
No comments: Submit comment
Supportive validation
- Submitted by
- Invitrogen Antibodies (provider)
- Main image

- Experimental details
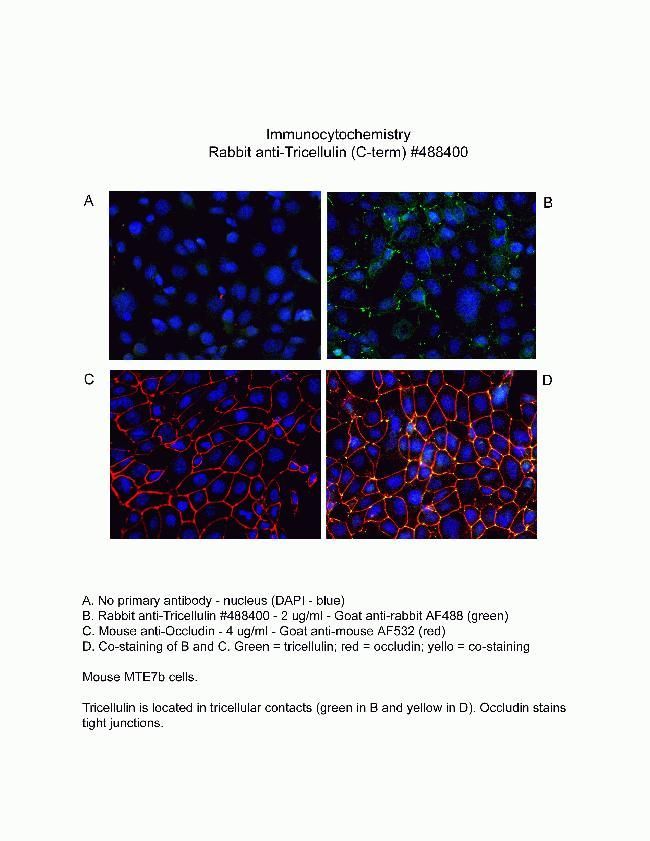
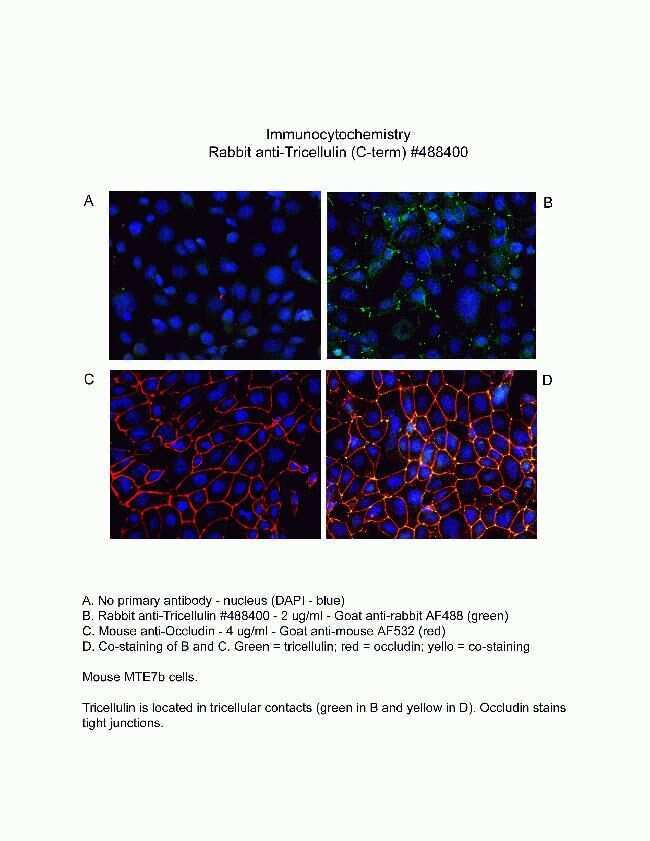
- Immunofluorescent analysis of MARVELD2 using a polyclonal antibody (Product # 48-8400).
- Submitted by
- Invitrogen Antibodies (provider)
- Main image

- Experimental details
- Immunofluorescent analysis of MARVELD2 using a polyclonal antibody (Product # 48-8400).
- Submitted by
- Invitrogen Antibodies (provider)
- Main image

- Experimental details
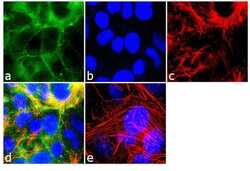
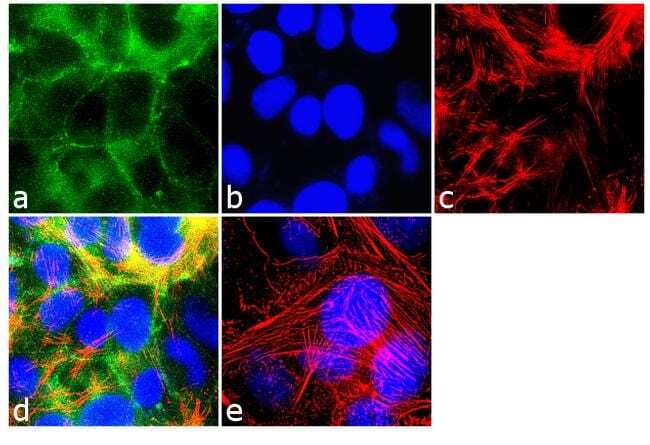
- Immunofluorescence analysis of Marveld2/ Tricellulin was performed using 90% confluent log phase MCF-7 cells. The cells were fixed with 4% paraformaldehyde for 10 minutes, permeabilized with 0.1% Triton™ X-100 for 10 minutes, and blocked with 2% BSA for 1 hour at room temperature. The cells were labeled with MARVELD2/Tricellulin Rabbit Polyclonal Antibody (Product # 48-8400) at 2 µg/mL in 0.1% BSA and incubated for 3 hours at room temperature and then labeled with Goat anti-Rabbit IgG (H+L) Superclonal™ Secondary Antibody, Alexa Fluor® 488 conjugate (Product # A27034) a dilution of 1:2000 for 45 minutes at room temperature (Panel a: green). Nuclei (Panel b: blue) were stained with SlowFade® Gold Antifade Mountant with DAPI (Product # S36938). F-actin (Panel c: red) was stained with Alexa Fluor® 555 Rhodamine Phalloidin (Product # R415, 1:300). Panel d represents the merged image showing cell junctional localization. Panel e shows the no primary antibody control. The images were captured at 60X magnification.

- Submitted by
- Invitrogen Antibodies (provider)
- Main image
- Experimental details
- Immunofluorescence analysis of Marveld2/ Tricellulin was performed using 90% confluent log phase MCF-7 cells. The cells were fixed with 4% paraformaldehyde for 10 minutes, permeabilized with 0.1% Triton™ X-100 for 10 minutes, and blocked with 2% BSA for 1 hour at room temperature. The cells were labeled with MARVELD2/Tricellulin Rabbit Polyclonal Antibody (Product # 48-8400) at 2 µg/mL in 0.1% BSA and incubated for 3 hours at room temperature and then labeled with Goat anti-Rabbit IgG (Heavy Chain) Superclonal™ Secondary Antibody, Alexa Fluor® 488 conjugate (Product # A27034) a dilution of 1:2000 for 45 minutes at room temperature (Panel a: green). Nuclei (Panel b: blue) were stained with SlowFade® Gold Antifade Mountant with DAPI (Product # S36938). F-actin (Panel c: red) was stained with Alexa Fluor® 555 Rhodamine Phalloidin (Product # R415, 1:300). Panel d represents the merged image showing cell junctional localization. Panel e shows the no primary antibody control. The images were captured at 60X magnification.
- Submitted by
- Invitrogen Antibodies (provider)
- Main image
- Experimental details
- Immunofluorescent analysis of MARVELD2 using a polyclonal antibody (Product # 48-8400).

Supportive validation
- Submitted by
- Invitrogen Antibodies (provider)
- Main image

- Experimental details
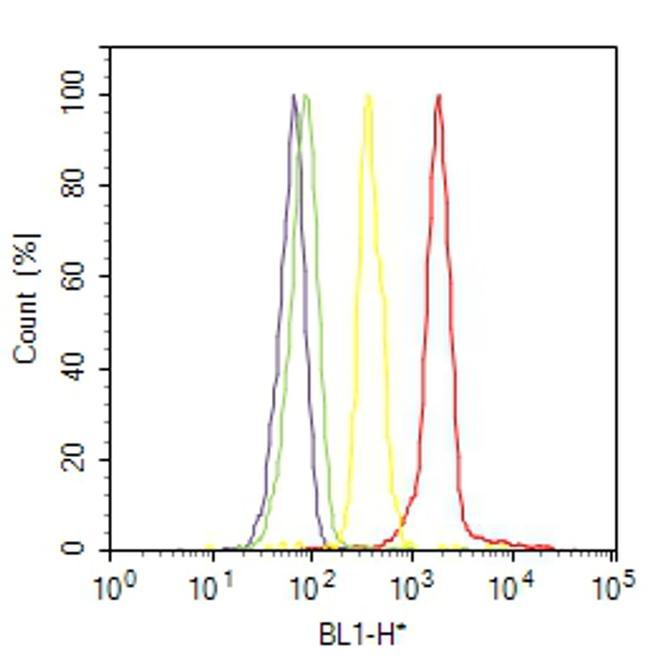
- Flow cytometry analysis of MARVELD2 / Tricellulin was done on MCF7 cells. Cells were fixed with 70% ethanol for 10 minutes, permeabilized with 0.25% Triton™ X-100 for 20 minutes, and blocked with 5% BSA for 30 minutes at room temperature. Cells were labeled with MARVELD2 / Tricellulin Rabbit Polyclonal Antibody (488400, red histogram) or with rabbit isotype control (yellow histogram) at 3-5 ug/million cells in 2.5% BSA. After incubation at room temperature for 2 hours, the cells were labeled with Alexa Fluor® 488 Goat Anti-Rabbit Secondary Antibody (A11008) at a dilution of 1:400 for 30 minutes at room temperature. The representative 10,000 cells were acquired and analyzed for each sample using an Attune® Acoustic Focusing Cytometer. The purple histogram represents unstained control cells and the green histogram represents no-primary-antibody control.
Supportive validation
- Submitted by
- Invitrogen Antibodies (provider)
- Main image
- Experimental details
- NULL

- Submitted by
- Invitrogen Antibodies (provider)
- Main image
- Experimental details
- NULL

- Submitted by
- Invitrogen Antibodies (provider)
- Main image
- Experimental details
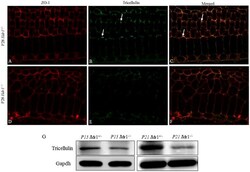
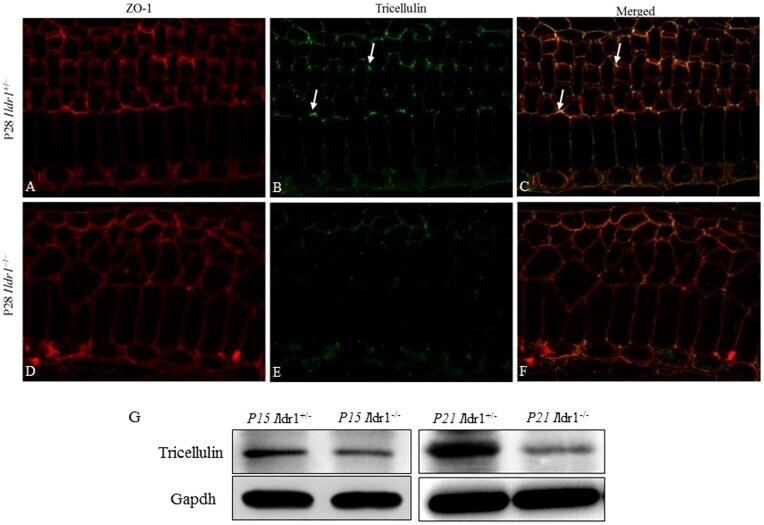
- Fig. 7. Expression of tricellulin in tight junctions was decreased in Ildr1 -/- mice. (A-F) Immunofluorescence of the organ of Corti from the middle turn of P28 mice using tricellulin and ZO-1 antibody. Arrows in B,C show the localization of tricellulin in the tricellular tight junctions. (G) Western blot analysis of tricellulin in the basilar membrane at P15 and P21 Ildr1 +/- and Ildr1 -/- mice. Gapdh was used as a loading control.
- Submitted by
- Invitrogen Antibodies (provider)
- Main image
- Experimental details
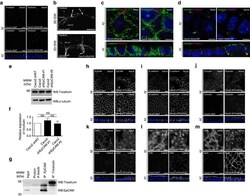
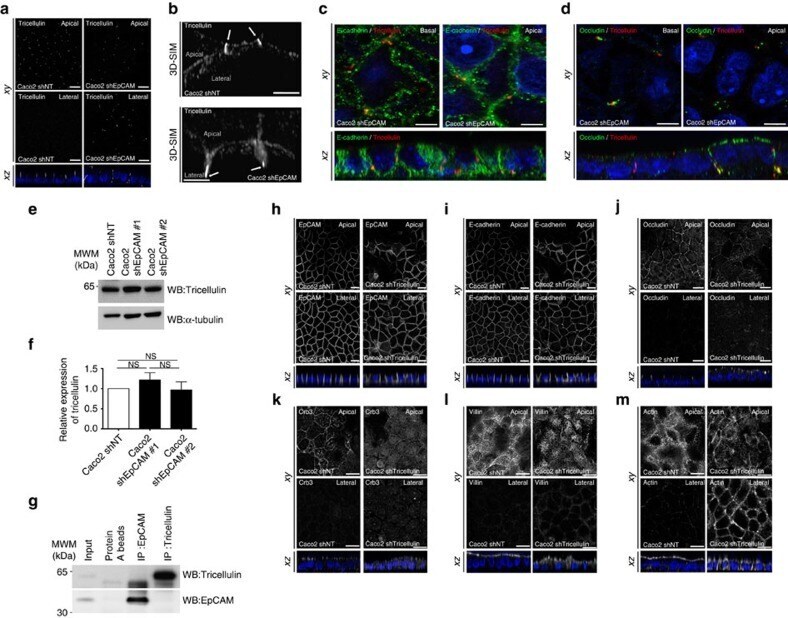
- Figure 4 Tricellulin silencing does not lead to apical domain displacement at tricellular junctions. ( a ) Confocal microscopy analysis of tricellulin distribution on the apical ( Apical , upper panels) or lateral ( Lateral , lower panels) side in control ( Caco2 shNT , left panels) and EpCAM-depleted ( Caco2 shEpCAM , right panels) cells. xy and xz views are presented. Scale bars, 5 mum. ( b ) 3D-SIM microscopy analysis of tricellulin localization in control ( Caco2 shNT ) and EpCAM-deprived (C aco2 shEpCAM ) cells. While tricellulin was focused at the most apical part of the tricellular junctions in control cells, it was instead concentrated at the bottom of aberrant tricellular junctional tubes in the absence of EpCAM (white arrows). Scale bars, 2 mum. ( c , d ) Confocal microscopy analysis of double immunostainings for E-cadherin (green) and tricellulin (red) ( c ), occludin (green) and tricellulin (red) ( d ), on the basal or apical sides in EpCAM-depleted ( Caco2 shEpCAM ) cells. xy and xz views are presented. Scale bars, 2 mum. ( e ) Western blot analysis of the level of tricellulin expression in control ( Caco2 shNT ) or EpCAM-deprived ( Caco2 shEpCAM #1 and Caco2 shEpCAM #2 ) clones. alpha-tubulin was used as loading control. ( f ) Statistical analysis of tricellulin amounts relative to alpha-tubulin amounts in control ( Caco2 shNT ) or EpCAM-deprived ( Caco2 shEpCAM #1 and Caco2 shEpCAM #2 ) clones. The analysis was performed based on three independent experiments.
- Submitted by
- Invitrogen Antibodies (provider)
- Main image

- Experimental details
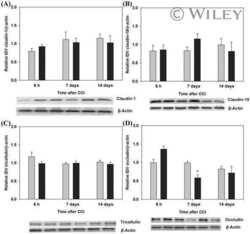
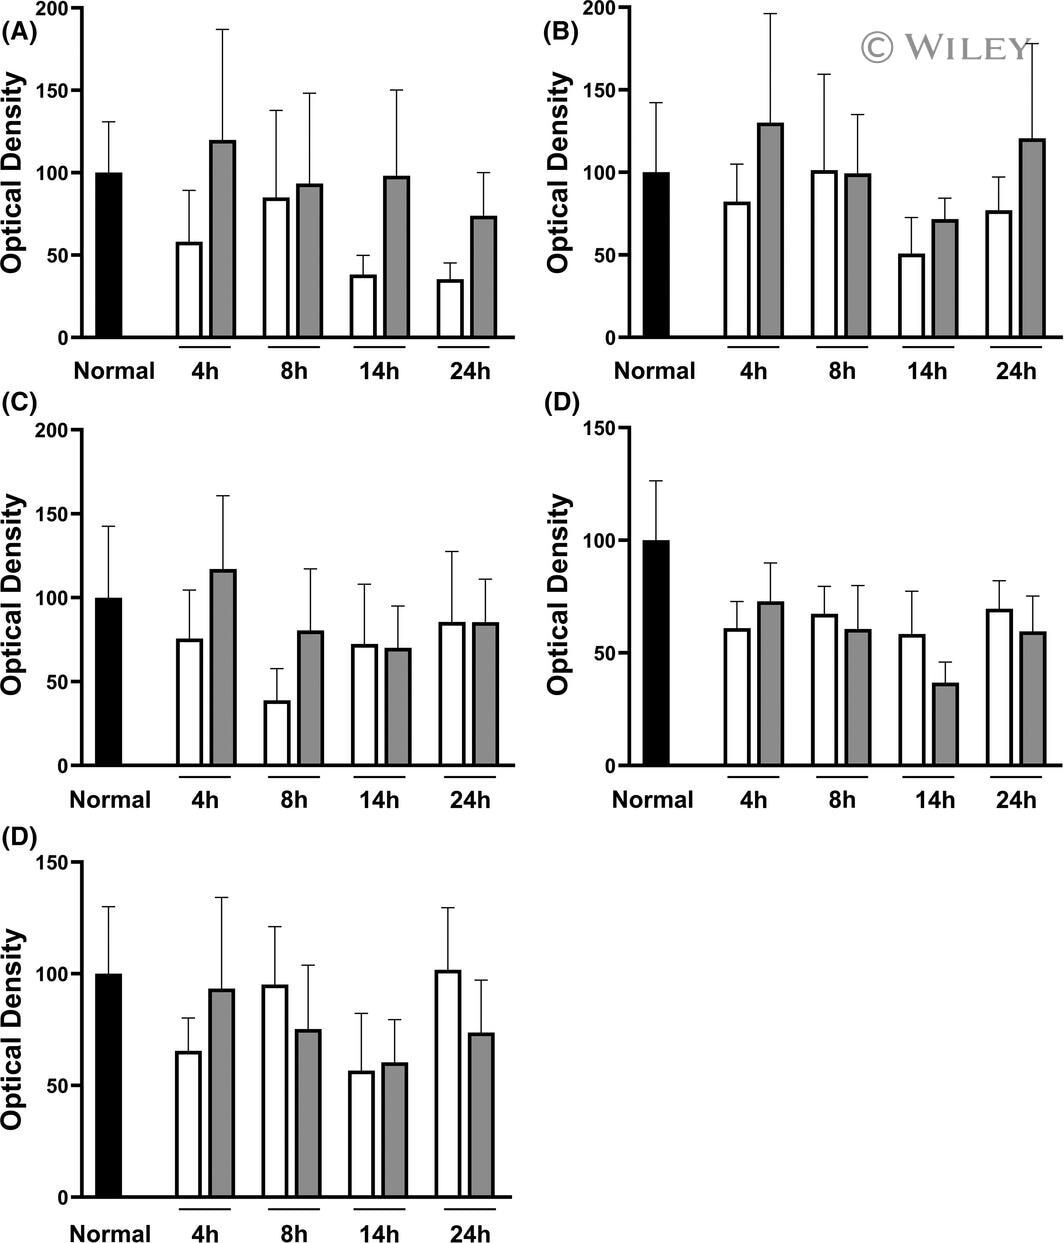
- 3 FIGURE Immunoblotting using antibodies against zonula occludens (ZO)-1 (A), tricellulin (B), occludin (C), claudin-3 (D), and claudin-4 (E) in intestines undergoing VP only (white bar) and in intestines receiving additional luminal preservation (light gray bar). The black bar denotes the baseline value obtained in the same intestines before cold preservation. Data expressed as mean +- standard error of the mean, * p < .05.
- Submitted by
- Invitrogen Antibodies (provider)
- Main image
- Experimental details
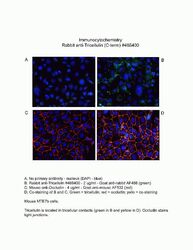
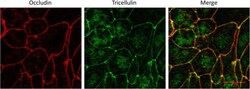
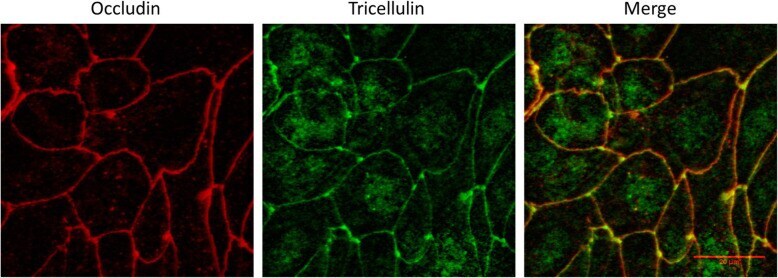
- Fig. 1 16HBE14o- Monolayers Exhibit Proper Localization of the Tight Junction Proteins Occludin and Tricellulin. Immunofluorescence staining of methanol fixed 16HBE14o- cells with anti-Occludin (red) and anti-Tricellulin (green). Tricellulin is predominantly visible at points of tricellular contact while Occludin is distributed along bicellular junctions. Scale bar 30 mum
- Submitted by
- Invitrogen Antibodies (provider)
- Main image
- Experimental details
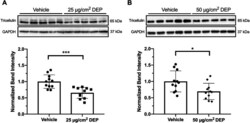
- Fig. 3 Six-hour exposure to DEP causes a reduction in Tricellulin protein. a Cells exposed to 25 mug/cm 2 DEP or b 50 mug/cm 2 DEP for 6 h demonstrate a reduction in Tricellulin protein as measured by whole cell lysate Western blot. Representative Western blot from one experiment, densitometry results from two independent experiments. Student's t-test, * P < 0.05, *** P < 0.001, N = 5-6 replicates per treatment per experiment

- Submitted by
- Invitrogen Antibodies (provider)
- Main image
- Experimental details
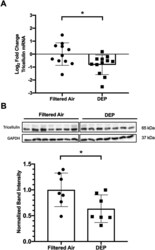
- Fig. 5 Early life exposure to DEP causes a reduction in Tricellulin expression in the lung. a Neonatal mice exposed to aerosolized DEP exhibit a reduction in Tricellulin mRNA in the lung 2 weeks post final exposure as measured by RT-qPCR. Unequal variances t-test, * P < 0.05, N = 11 (FA) or N = 12 (DEP). b Neonatal mice exposed to aerosolized DEP exhibit a reduction in Tricellulin protein in the lung 2 weeks post final exposure as measured by Western blot. Student's t-test, * P < 0.05, N = 7 per treatment

- Submitted by
- Invitrogen Antibodies (provider)
- Main image

- Experimental details
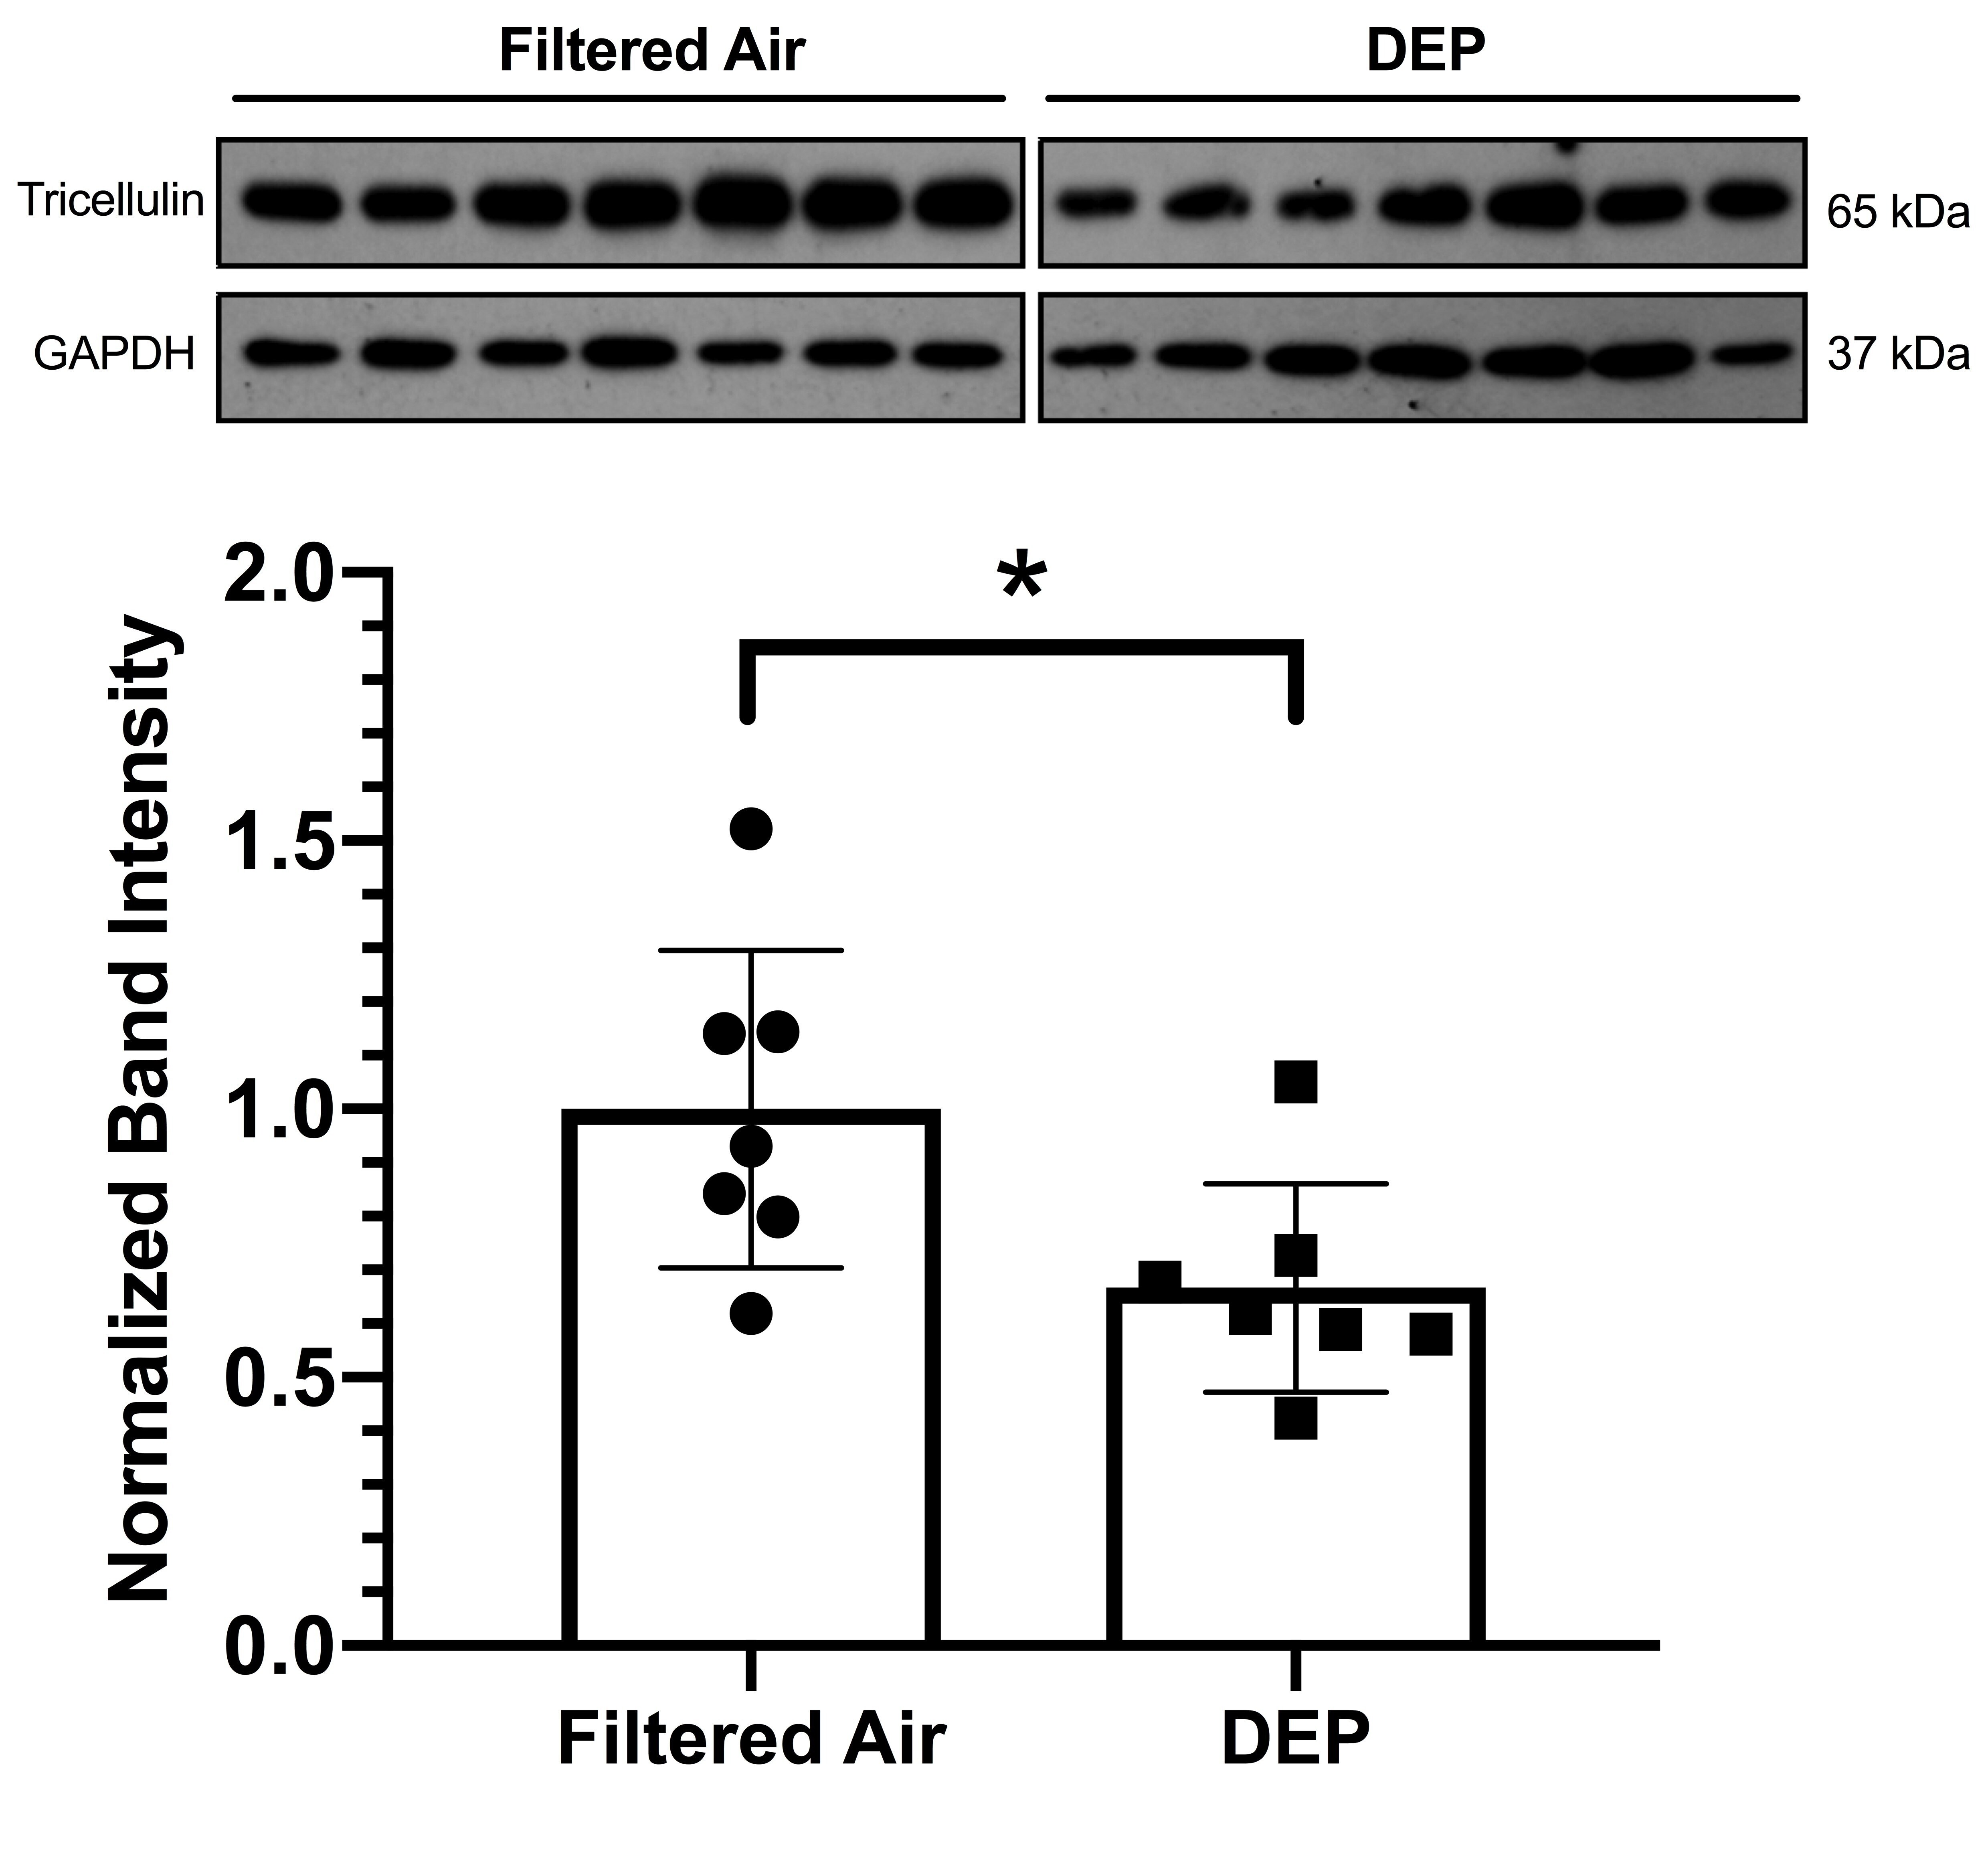
- Additional file 2: Supplemental Figure 2. PND 4-7 mice exhibit similar reductions to Tricellulin protein following aerosolized DEP exposure. A separate cohort of neonatal mice, exposed to aerosolized DEP starting between post-natal day 4-7, exhibit a similar reduction in Tricellulin protein in the lung 2 weeks post final exposure as measured by Western blot. Student's t-test, * P < 0.05, N = 7 per treatment.
- Submitted by
- Invitrogen Antibodies (provider)
- Main image

- Experimental details
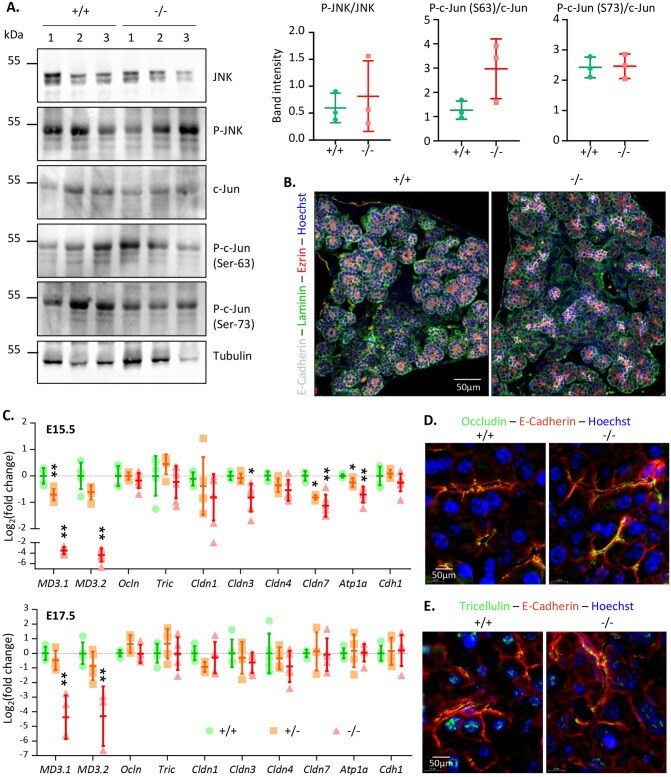
- Figure 5 JNK-pathway activity and cell polarity are not altered in the absence of MarvelD3. ( A ) Detection of JNK, c-Jun and their phosphorylated forms in protein extracts from 3 wild-type (+ / +) and 3 MarvelD3 knockout (-/-) pancreata by western blotting. No differences in JNK, phospho-JNK (P-JNK), c-Jun and phospho-c-Jun (P-c-Jun, Ser63 and Ser73) protein levels were observed between wild-type and knockout pancreata. Quantification of the bands (P-JNK/JNK and P-c-Jun/c-Jun) is shown on the right. Full-length blots/gels are presented in Supplementary Fig. 8. ( B ) Cell polarity assessment by immunolabeling of apical (ezrin, red) and basal (laminin, green) markers of epithelial (E-Cadherin, white) cells on E15.5 embryonic pancreas sections. Wild-type (+ / +) and knockout (-/-) pancreatic epithelial cells are polarized. ( C ) RT-qPCR evaluation of tight junction and baso-lateral marker gene expression levels in embryonic (E15.5 and E17.5) pancreata of wild-type (+ / + , green circles), heterozygous (+ /-, orange squares) and MarvelD3 knockout (-/-, red triangles) mice. Transient downregulation of claudin-3 and -7 , and NaK-ATPase ( Atp1a ) is observed in E15.5 knockouts. ( D-E ) Immunolabeling of the TAMP occludin and tricellulin (green) in the wild-type and knockout E15.5 pancreatic epithelium (E-Cadherin, red). The absence of MarvelD3 does not trigger relocalization of the two other TAMPs.
- Submitted by
- Invitrogen Antibodies (provider)
- Main image
- Experimental details
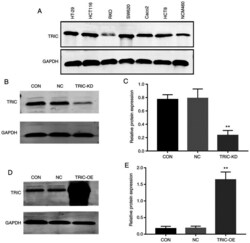
- Figure 2. Stable knockdown or overexpression of tricellulin in colorectal cancer cells. (A) Western blotting. Tricellulin expression was assessed in a panel of colorectal cancer cell lines and a normal human colon mucosal epithelial cell line NCM460 using western blotting. (B and C) Western blotting and RT-qPCR analysis for TRIC-KD. GAPDH was used as a reference. (D and E) Western blotting and RT-qPCR analysis for TRIC-OE. GAPDH was used as the reference. RT-qPCR, reverse transcription-quantitative PCR; TRIC-KD, tricellulin knockdown; TRIC-OE, tricellulin overexpression; TRIC, tricellulin; CON, control; NC, negative control.

- Submitted by
- Invitrogen Antibodies (provider)
- Main image
- Experimental details
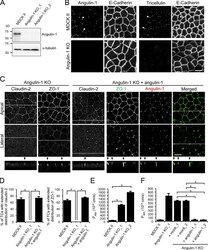
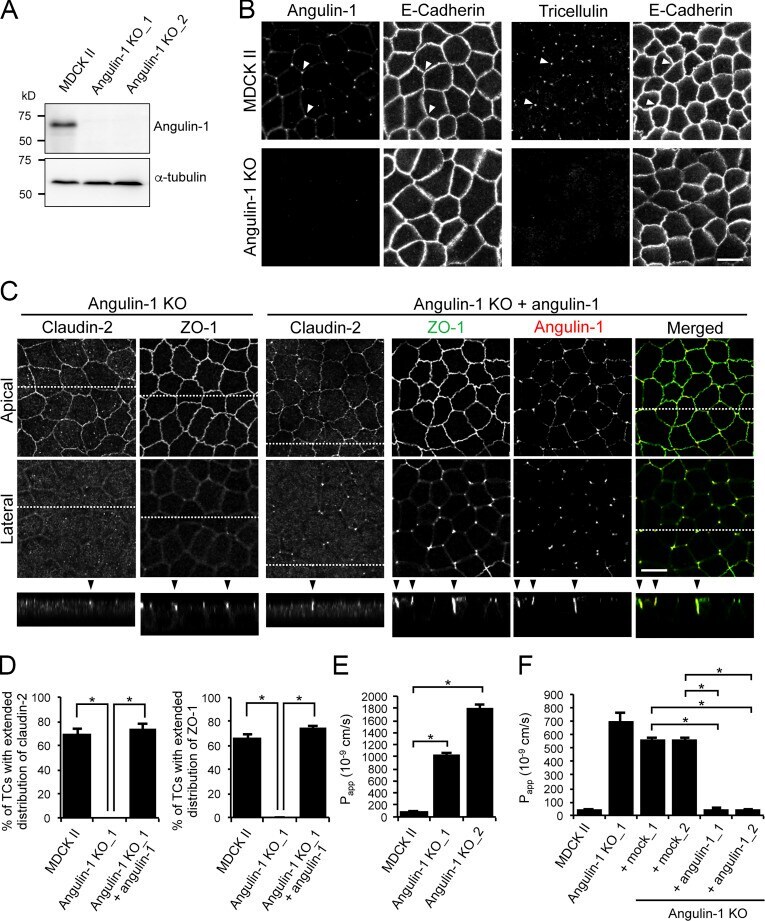
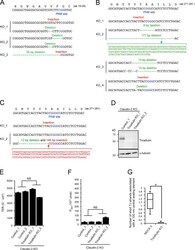
- Figure 4. Role of angulin-1 in the localization of TJ proteins at TCs and epithelial barrier function. (A) Western blotting of lysates of MDCK II cells and two independent angulin-1-KO cell clones (angulin-1-KO_1 and -KO_2) with anti-angulin-1 pAb or anti-alpha-tubulin mAb. (B) Double-immunofluorescence staining of MDCK II cells and angulin-1-KO cells with anti-angulin-1 pAb and anti-E-cadherin mAb or anti-tricellulin pAb and anti-E-cadherin mAb. Arrowheads indicate TCs. (C) Immunofluorescence staining of angulin-1-KO cells and angulin-1-KO cells expressing exogenous angulin-1 (angulin-1-KO + angulin-1). Angulin-1-KO cells were immunostained with anti-claudin-2 mAb or anti-ZO-1 mAb. Angulin-1-KO cells expressing exogenous angulin-1 were singly immunostained with anti-claudin-2 mAb or doubly stained with anti-ZO-1 mAb and anti-angulin-1 pAb. Confocal sections of the apical region, including TJ markers and the lateral region, together with the corresponding Z-stack images along the white dotted lines are shown. Arrowheads indicate TCs. (D) Quantification of TCs with extended distribution of fluorescence signals of claudin-2 and ZO-1 to the basal direction. (E) Paracellular flux of fluorescein in MDCK II cells and two independent angulin-1-KO cell clones (angulin-1-KO_1 and -KO_2). P app , apparent permeability. (F) Paracellular flux of fluorescein in MDCK II cells, angulin-1-KO cells, two independent mock-transfected angulin-1-KO cell clones (+mock_1 and +mock_2), and two indep
- Submitted by
- Invitrogen Antibodies (provider)
- Main image
- Experimental details
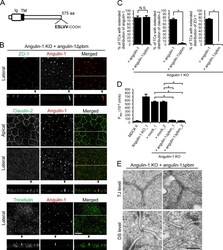
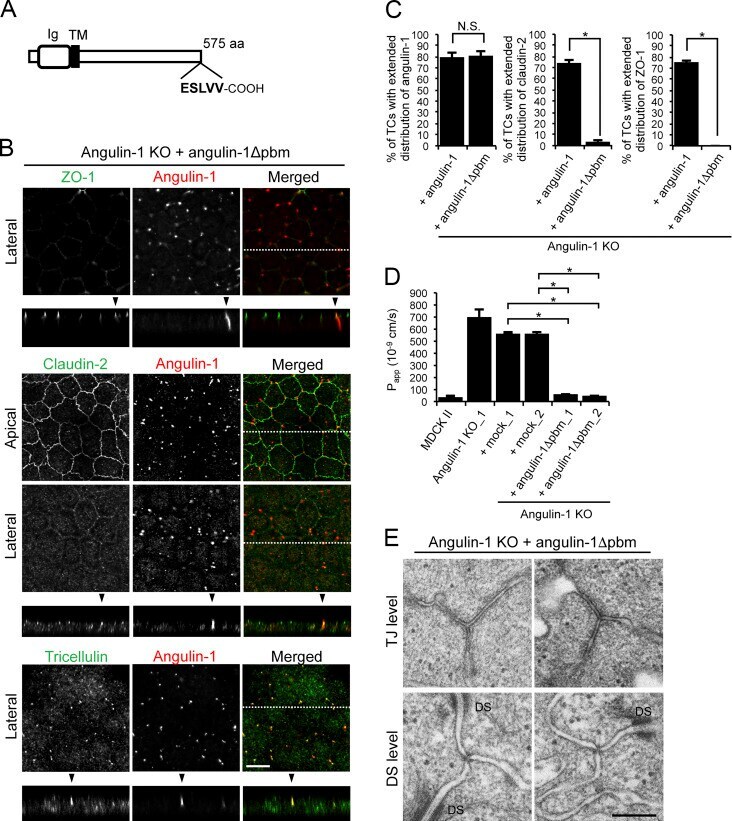
- Figure 6. Role of the angulin-1 pbm in the localization of TJ proteins at TCs. (A) Schematic drawing of mouse angulin-1 with 575 amino acids. Five amino acids of the putative pbm at the C-terminus are shown. Ig, Ig-like domain; TM, transmembrane domain. (B) Double-immunofluorescence staining of angulin-1-KO cells expressing exogenous angulin-1 lacking the C-terminal five amino acids (angulin-1Deltapbm) with anti-ZO-1 mAb and anti-angulin-1 mAb, anti-claudin-2 mAb and anti-angulin-1 mAb, or anti-tricellulin pAb and anti-angulin-1 mAb. Confocal sections of the apical region, including TJ markers and the lateral region, together with the corresponding Z-stack images along white dotted lines are shown. Arrowheads indicate TCs. Bar: 10 um. (C) Quantification of TCs with extended distribution of fluorescence signals of angulin-1, claudin-2, and ZO-1 to the basal direction. The data in angulin-1-KO cells expressing angulin-1 (+ angulin-1) in the middle and right graphs are identical to those shown in Fig. 4 D . (D) Paracellular flux of fluorescein in MDCK II cells, angulin-1-KO cells, two independent mock-transfected angulin-1-KO cell clones (+mock_1 and +mock_2), and two independent angulin-1-KO cell clones expressing exogenous angulin-1Deltapbm (+angulin-1Deltapbm_1 and +angulin-1Deltapbm_2). The data in MDCK II cells, angulin-1-KO cells, and two independent mock-transfected angulin-1-KO cell clones are identical to those in Fig. 4 F . P app , apparent permeability. (E) EM observa
- Submitted by
- Invitrogen Antibodies (provider)
- Main image
- Experimental details
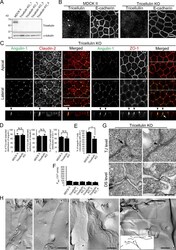
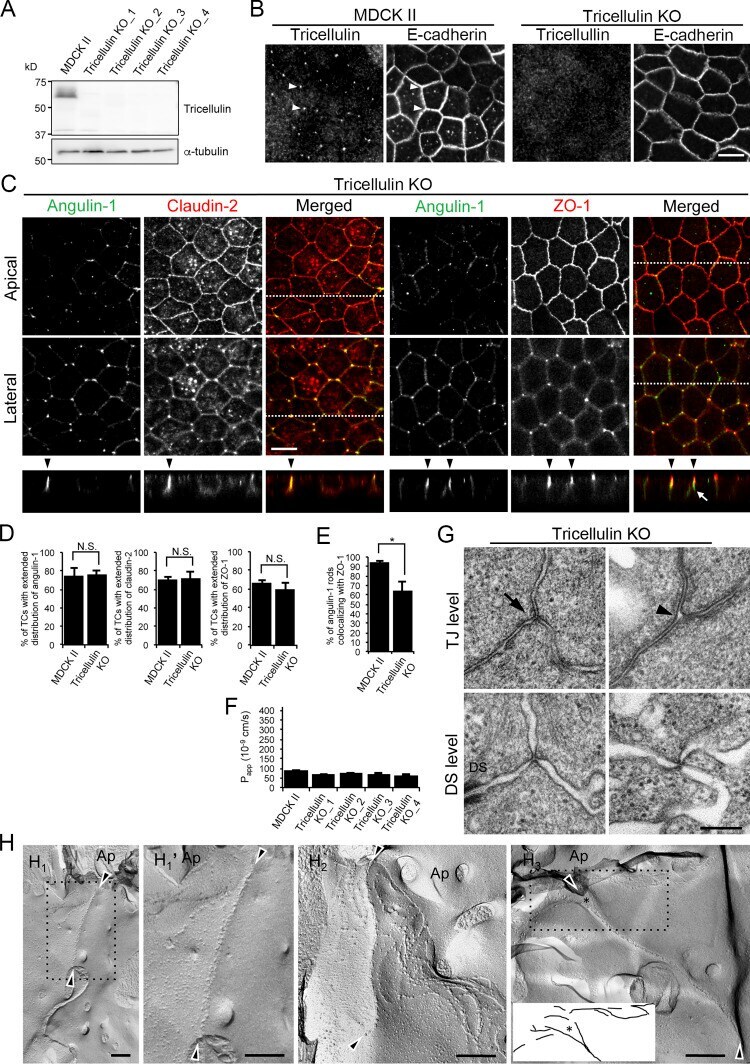
- Figure 9. Roles of tricellulin in tTJ formation and epithelial barrier function. (A) Lysates of four independent tricellulin-KO cell clones (tricellulin-KO_1-4) were analyzed by Western blotting with anti-tricellulin pAb or anti-alpha-tubulin mAb. (B) Tricellulin-KO_4 cells were immunostained with anti-tricellulin pAb and anti-E-cadherin mAb. Arrowheads indicate TCs. (C) Double-immunofluorescence staining of tricellulin-KO_4 cells with anti-angulin-1 pAb and anti-claudin-2 mAb or anti-angulin-1 pAb and anti-ZO-1 mAb. Arrowheads indicate TCs. Confocal sections of the apical region, including TJ markers and the lateral region, together with the corresponding Z-stack images along the white dotted lines are shown. The white arrow indicates an angulin-1-positive region at a TC without ZO-1. (D) Quantification of TCs with extended distribution of fluorescence signals of angulin-1, claudin-2, and ZO-1 to the basal direction. The data in MDCK II cells in the middle and right graphs are identical to those in Fig. 4 D . (E) Quantification of angulin-1 rods colocalizing with ZO-1 at TCs. (F) Paracellular flux of fluorescein in MDCK II and tricellulin-KO_1-4 cells. Data are shown as mean +- SD ( n = 3). P app , apparent permeability. (G) EM observation of horizontal ultrathin sections of tricellulin-KO_4 cells. TCs at the level of TJs (TJ level) and the more basal level of the lateral membrane containing desmosomes (DS level) were analyzed. The TJ level contained either the plasma membra
- Submitted by
- Invitrogen Antibodies (provider)
- Main image
- Experimental details
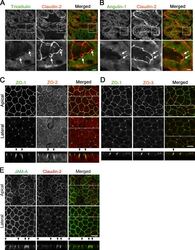
- Figure S1. Localization of TJ and tTJ proteins at TCs. (A and B) Double-immunofluorescence staining of frozen mouse kidney sections containing proximal tubules with anti-tricellulin mAb and anti-claudin-2 pAb (A) and anti-angulin-1 mAb and anti-claudin-2 pAb (B). Tricellulin and angulin-1 showed dotlike staining at TCs with claudin-2 staining (arrows). (C-E) Double-immunofluorescence staining of MDCK II cells with anti-ZO-1 mAb and anti-ZO-2 pAb (C), anti-ZO-1 mAb and anti-ZO-3 pAb (D), and anti-JAM-A pAb and anti-claudin-2 mAb (E). Confocal sections in the apical region, including TJ markers and the lateral region, together with the corresponding Z-stack images along the white dotted lines are shown. Arrowheads indicate TCs. Bars: 10 um (top of A and B and C-E), 5 um (bottom of A and B).

- Submitted by
- Invitrogen Antibodies (provider)
- Main image
- Experimental details
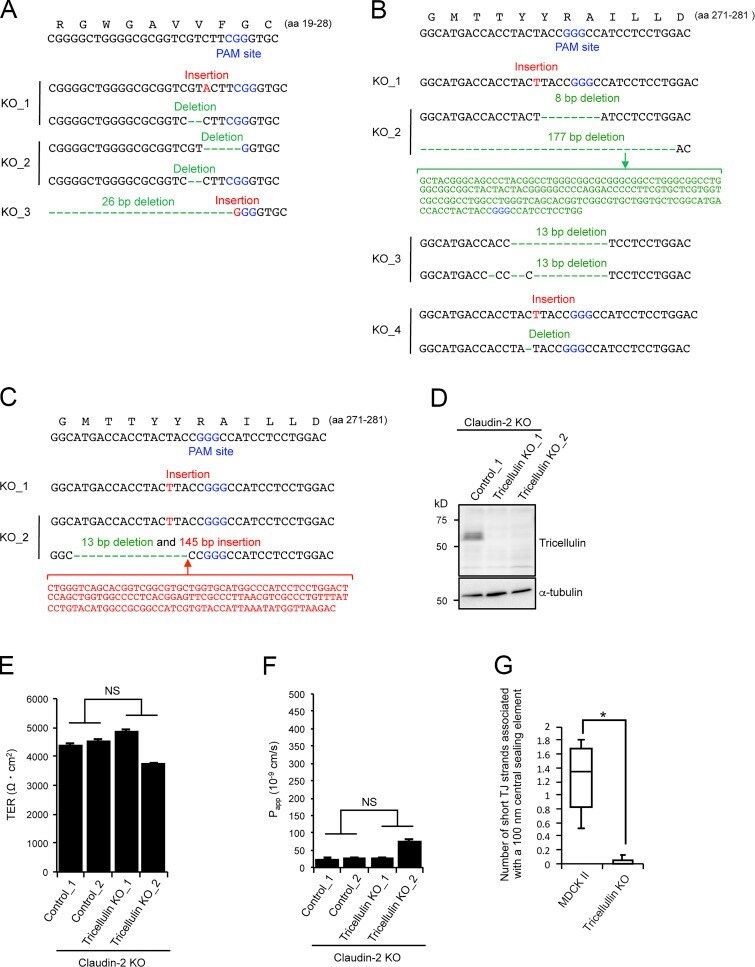
- Figure S5. Characterization of claudin/angulin-1-KO cells, tricellulin-KO cells, and tricellulin/claudin-2-dKO cells. (A) Frameshift mutations introduced in the proximity of the PAM site in the angulin-1 gene in three claudin/angulin-1-KO clones (KO_1-3) established by CRISPR/Cas9-mediated genome editing. (B) Frameshift mutations introduced in the proximity of the PAM site in the tricellulin gene in four tricellulin-KO clones (KO_1-4) established by CRISPR/Cas9-mediated genome editing. (C) Frameshift mutations introduced in the proximity of the PAM site in the tricellulin gene in two tricellulin/claudin-2-dKO cell clones (KO_1 and KO_2) established by CRISPR/Cas9-mediated genome editing. (D) Western blotting of lysates of a control claudin-2-KO cell clone and two tricellulin/claudin-2-dKO cell clones with anti-tricellulin pAb or anti-alpha-tubulin mAb. (E and F) TER (E) and paracellular flux of fluorescein (F) were measured in two control claudin-2-KO cell clones (Control_1 and 2) and two tricellulin/claudin-2-dKO cell clones (KO_1 and KO_2). Data are shown as mean +- SD ( n = 3) and were analyzed by Welch's t test ( n = 6 total for two control clones [ n = 3 per clone] versus n = 6 total for two tricellulin/claudin-2-dKO clones [ n = 3 per clone]). P app , apparent permeability. (G) Quantification of short TJ strands associated with a central sealing element in MDCK II cells and tricellulin-KO_4 cells. Data were analyzed by Mann-Whitney U test (MDCK II cells, n = 17; tricell
- Submitted by
- Invitrogen Antibodies (provider)
- Main image
- Experimental details
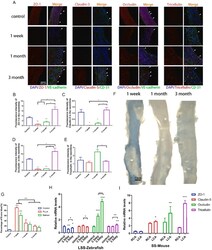
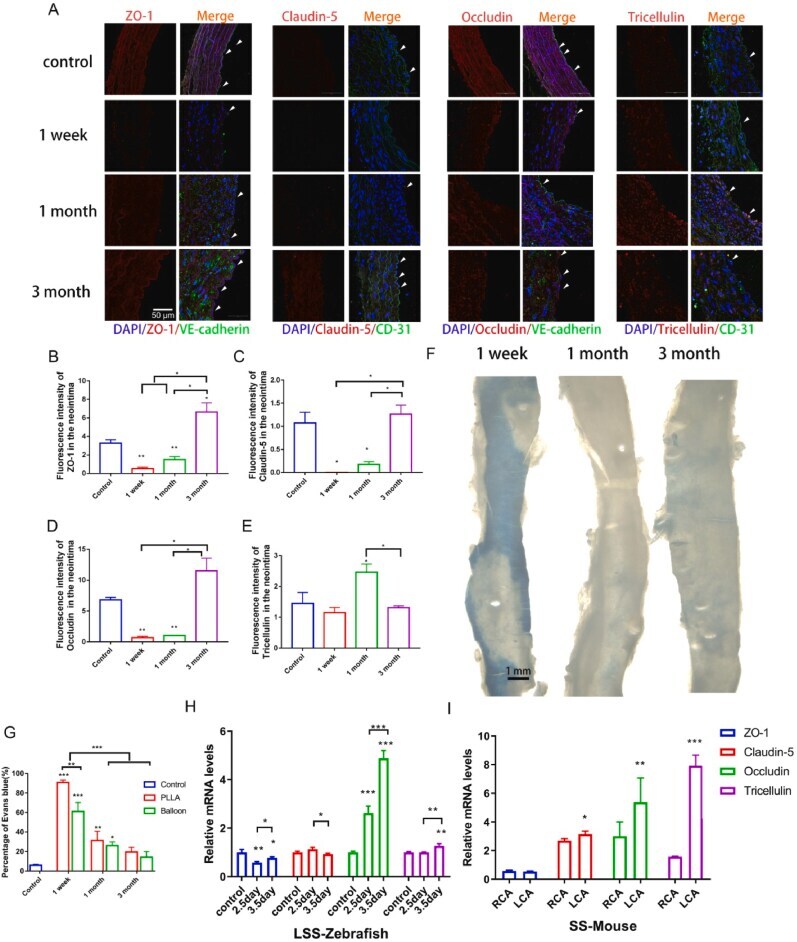
- Mechanical stimulation is an important factor for the changes in the expression levels of TJPs after different intravascular injuries. (A) Immunofluorescence staining of paraffin sections of rat abdominal aortic balloon injury (white arrow: neointima ECs); (B-E) statistics of immunofluorescence staining intensity of ZO-1, Claudin-5, Occludin and Tricellulin in sections;(F) Evans blue staining results of rat abdominal aorta; (G) the proportion of Evans blue staining area to the total vascular area; (H,I) real-time fluorescence quantitative PCR results of ZO-1, Claudin-5, Occludin and Tricellulin after zebrafish drug treatment (H) and partial carotid artery ligation in ApoE -/- mice (I). *p < 0.05, **p < 0.01, ***p < 0.001. (For interpretation of the references to color in this figure legend, the reader is referred to the Web version of this article.) Fig. 3
- Submitted by
- Invitrogen Antibodies (provider)
- Main image

- Experimental details
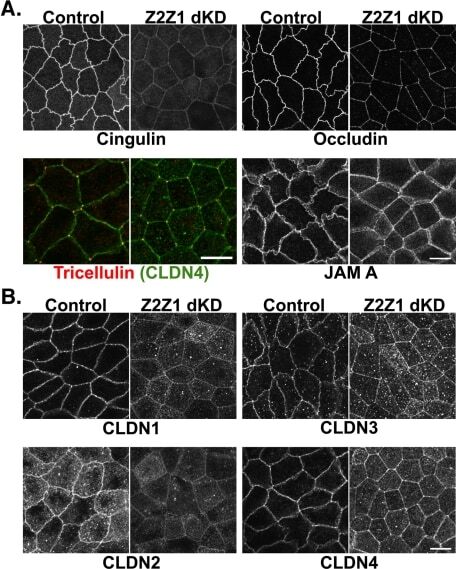
- FIGURE 2: The localization of some, but not all, TJ proteins to the AJC is attenuated in ZO dKD cell lines. (A-C) A 1-mum-thick, maximum-density projection of the apical domain, en face, acquired at the AJC (see Materials and Methods ). (A) Occludin and cingulin localization at the AJC is reduced, whereas JAM-A and tricellulin appear relatively normal in dKD cells relative to control cells. Claudin-4 staining (green) is included with tricellulin staining (red) to highlight tricellular junctions. (B) Claudin-1 and -2 staining at the AJC is reduced, whereas claudin-3 and -4 appear relatively normal in dKD cells. Note again the dramatic change in cell shape at the AJC in dKD cells. Scale bar: 10 mum.