 Explore
 Validate
 Learn
Learn Western blot
Antibody data
- Antibody Data
- Antigen structure
- References [15]
- Comments [0]
- Validations
- Western blot [5]
- Immunocytochemistry [2]
- Immunoprecipitation [1]
- Flow cytometry [1]
- Other assay [15]
Submit
Validation data
Reference
Comment
Report error
- Product number
- 700191 - Provider product page

- Provider
- Invitrogen Antibodies
- Product name
- MARVELD2 Recombinant Rabbit Monoclonal Antibody (54H19L38)
- Antibody type
- Monoclonal
- Antigen
- Recombinant full-length protein
- Description
- This antibody is predicted to react with chimpanzee, mouse, rat, bovine and Xenopus based on sequence homology. Intact IgG appears on a non-reducing gel as ~150 kDa band and upon reduction generating a ~25 kDa light chain band and a ~50 kDa heavy chain. Recombinant rabbit monoclonal antibodies are produced using in vitro expression systems. The expression systems are developed by cloning in the specific antibody DNA sequences from immunoreactive rabbits. Then, individual clones are screened to select the best candidates for production. The advantages of using recombinant rabbit monoclonal antibodies include: better specificity and sensitivity, lot-to-lot consistency, animal origin-free formulations, and broader immunoreactivity to diverse targets due to larger rabbit immune repertoire.
- Reactivity
- Human
- Host
- Rabbit
- Isotype
- IgG
- Antibody clone number
- 54H19L38
- Vial size
- 100 μg
- Concentration
- 0.5 mg/mL
- Storage
- Store at 4°C short term. For long term storage, store at -20°C, avoiding freeze/thaw cycles.
Submitted references Plakophilin 3 and Par3 facilitate desmosomes' association with the apical junctional complex.
Occludin and tricellulin facilitate formation of anastomosing tight-junction strand network to improve barrier function.
AhR activation defends gut barrier integrity against damage occurring in obesity.
The intestinal quorum sensing 3-oxo-C12:2 Acyl homoserine lactone limits cytokine-induced tight junction disruption.
Altered Structural Expression and Enzymatic Activity Parameters in Quiescent Ulcerative Colitis: Are These Potential Normalization Criteria?
Circulating Ouabain Modulates Expression of Claudins in Rat Intestine and Cerebral Blood Vessels.
Palmitic acid damages gut epithelium integrity and initiates inflammatory cytokine production.
Increased jejunal permeability in human obesity is revealed by a lipid challenge and is linked to inflammation and type 2 diabetes.
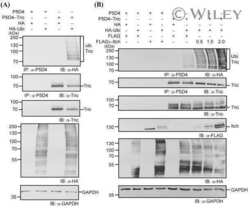
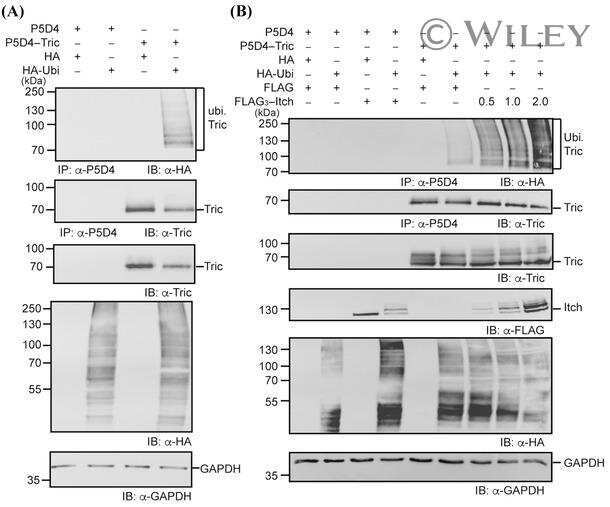
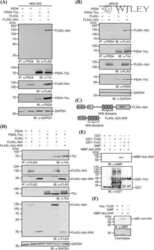
Tricellulin is a target of the ubiquitin ligase Itch.
Loss of LSR affects epithelial barrier integrity and tumor xenograft growth of CaCo-2 cells.
The serine protease-mediated increase in intestinal epithelial barrier function is dependent on occludin and requires an intact tight junction.
Excess PLAC8 promotes an unconventional ERK2-dependent EMT in colon cancer.
Diets high in fermentable protein and fibre alter tight junction protein composition with minor effects on barrier function in piglet colon.
The reversible increase in tight junction permeability induced by capsaicin is mediated via cofilin-actin cytoskeletal dynamics and decreased level of occludin.
Tricellulin expression in brain endothelial and neural cells.
Indra I, Troyanovsky RB, Green KJ, Troyanovsky SM
Molecular biology of the cell 2021 Sep 1;32(19):1824-1837
Molecular biology of the cell 2021 Sep 1;32(19):1824-1837
Occludin and tricellulin facilitate formation of anastomosing tight-junction strand network to improve barrier function.
Saito AC, Higashi T, Fukazawa Y, Otani T, Tauchi M, Higashi AY, Furuse M, Chiba H
Molecular biology of the cell 2021 Apr 15;32(8):722-738
Molecular biology of the cell 2021 Apr 15;32(8):722-738
AhR activation defends gut barrier integrity against damage occurring in obesity.
Postal BG, Ghezzal S, Aguanno D, André S, Garbin K, Genser L, Brot-Laroche E, Poitou C, Soula H, Leturque A, Clément K, Carrière V
Molecular metabolism 2020 Sep;39:101007
Molecular metabolism 2020 Sep;39:101007
The intestinal quorum sensing 3-oxo-C12:2 Acyl homoserine lactone limits cytokine-induced tight junction disruption.
Aguanno D, Coquant G, Postal BG, Osinski C, Wieckowski M, Stockholm D, Grill JP, Carrière V, Seksik P, Thenet S
Tissue barriers 2020 Oct 1;8(4):1832877
Tissue barriers 2020 Oct 1;8(4):1832877
Altered Structural Expression and Enzymatic Activity Parameters in Quiescent Ulcerative Colitis: Are These Potential Normalization Criteria?
Kjærgaard S, Damm MMB, Chang J, Riis LB, Rasmussen HB, Hytting-Andreasen R, Krug SM, Schulzke JD, Bindslev N, Hansen MB
International journal of molecular sciences 2020 Mar 10;21(5)
International journal of molecular sciences 2020 Mar 10;21(5)
Circulating Ouabain Modulates Expression of Claudins in Rat Intestine and Cerebral Blood Vessels.
Markov AG, Fedorova AA, Kravtsova VV, Bikmurzina AE, Okorokova LS, Matchkov VV, Cornelius V, Amasheh S, Krivoi II
International journal of molecular sciences 2020 Jul 17;21(14)
International journal of molecular sciences 2020 Jul 17;21(14)
Palmitic acid damages gut epithelium integrity and initiates inflammatory cytokine production.
Ghezzal S, Postal BG, Quevrain E, Brot L, Seksik P, Leturque A, Thenet S, Carrière V
Biochimica et biophysica acta. Molecular and cell biology of lipids 2020 Feb;1865(2):158530
Biochimica et biophysica acta. Molecular and cell biology of lipids 2020 Feb;1865(2):158530
Increased jejunal permeability in human obesity is revealed by a lipid challenge and is linked to inflammation and type 2 diabetes.
Genser L, Aguanno D, Soula HA, Dong L, Trystram L, Assmann K, Salem JE, Vaillant JC, Oppert JM, Laugerette F, Michalski MC, Wind P, Rousset M, Brot-Laroche E, Leturque A, Clément K, Thenet S, Poitou C
The Journal of pathology 2018 Oct;246(2):217-230
The Journal of pathology 2018 Oct;246(2):217-230
Tricellulin is a target of the ubiquitin ligase Itch.
Jennek S, Mittag S, Reiche J, Westphal JK, Seelk S, Dörfel MJ, Pfirrmann T, Friedrich K, Schütz A, Heinemann U, Huber O
Annals of the New York Academy of Sciences 2017 Jun;1397(1):157-168
Annals of the New York Academy of Sciences 2017 Jun;1397(1):157-168
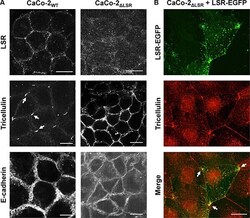
Loss of LSR affects epithelial barrier integrity and tumor xenograft growth of CaCo-2 cells.
Czulkies BA, Mastroianni J, Lutz L, Lang S, Schwan C, Schmidt G, Lassmann S, Zeiser R, Aktories K, Papatheodorou P
Oncotarget 2017 Jun 6;8(23):37009-37022
Oncotarget 2017 Jun 6;8(23):37009-37022
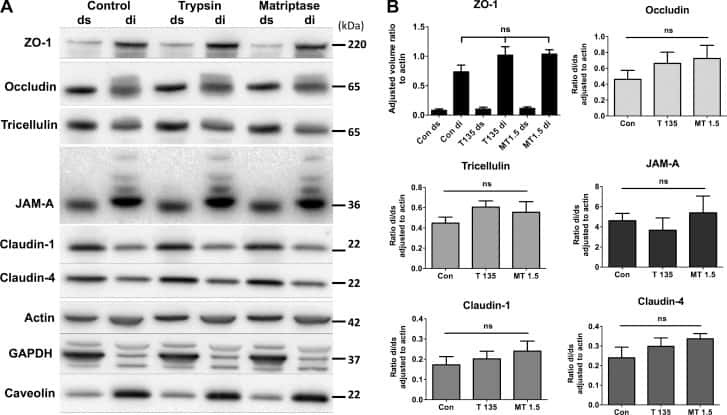
The serine protease-mediated increase in intestinal epithelial barrier function is dependent on occludin and requires an intact tight junction.
Ronaghan NJ, Shang J, Iablokov V, Zaheer R, Colarusso P, Dion S, Désilets A, Leduc R, Turner JR, MacNaughton WK
American journal of physiology. Gastrointestinal and liver physiology 2016 Sep 1;311(3):G466-79
American journal of physiology. Gastrointestinal and liver physiology 2016 Sep 1;311(3):G466-79
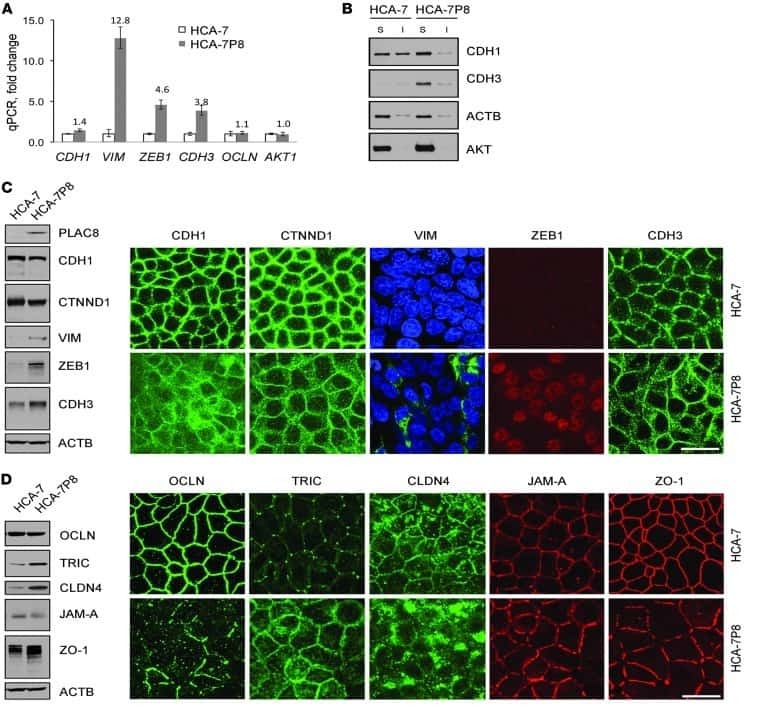
Excess PLAC8 promotes an unconventional ERK2-dependent EMT in colon cancer.
Li C, Ma H, Wang Y, Cao Z, Graves-Deal R, Powell AE, Starchenko A, Ayers GD, Washington MK, Kamath V, Desai K, Gerdes MJ, Solnica-Krezel L, Coffey RJ
The Journal of clinical investigation 2014 May;124(5):2172-87
The Journal of clinical investigation 2014 May;124(5):2172-87
Diets high in fermentable protein and fibre alter tight junction protein composition with minor effects on barrier function in piglet colon.
Richter JF, Pieper R, Zakrzewski SS, Günzel D, Schulzke JD, Van Kessel AG
The British journal of nutrition 2014 Mar 28;111(6):1040-9
The British journal of nutrition 2014 Mar 28;111(6):1040-9
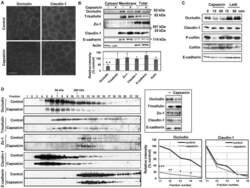
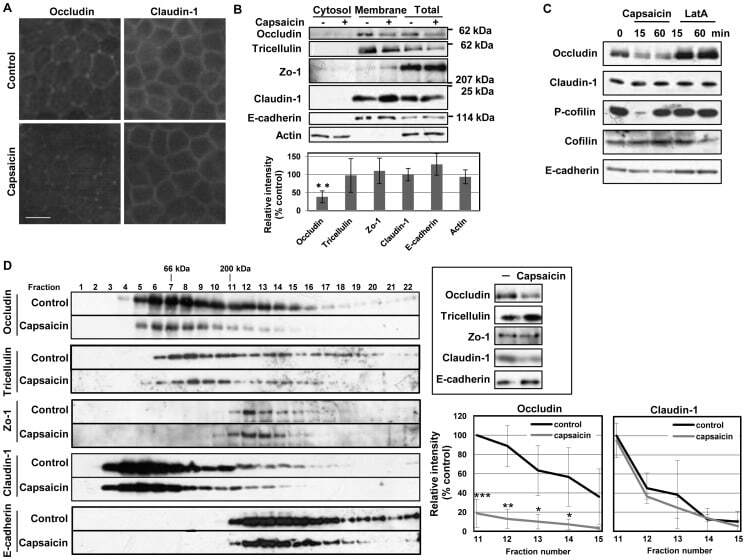
The reversible increase in tight junction permeability induced by capsaicin is mediated via cofilin-actin cytoskeletal dynamics and decreased level of occludin.
Shiobara T, Usui T, Han J, Isoda H, Nagumo Y
PloS one 2013;8(11):e79954
PloS one 2013;8(11):e79954
Tricellulin expression in brain endothelial and neural cells.
Mariano C, Palmela I, Pereira P, Fernandes A, Falcão AS, Cardoso FL, Vaz AR, Campos AR, Gonçalves-Ferreira A, Kim KS, Brites D, Brito MA
Cell and tissue research 2013 Mar;351(3):397-407
Cell and tissue research 2013 Mar;351(3):397-407
No comments: Submit comment
Supportive validation
- Submitted by
- Invitrogen Antibodies (provider)
- Main image
- Experimental details
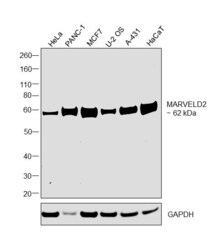
- Western blot was performed using Anti-MARVELD2 Recombinant Rabbit Monoclonal Antibody (54H19L38) (Product # 700191) and a 62kDa band corresponding to MARVEL domain-containing protein 2 was observed across tested cell lines. Membrane enriched extracts (40 µg lysate) of HeLa (Lane 1), PANC-1 (Lane 2), MCF7 (Lane 3), U-2 OS (Lane 4), A-431 (Lane 5), HaCaT (Lane 6) were electrophoresed using NuPAGE™ 4-12% Bis-Tris Protein Gel (Product # NP0321BOX). Resolved proteins were then transferred onto a nitrocellulose membrane (Product # IB23001) by iBlot® 2 Dry Blotting System (Product # IB21001). The blot was probed with the primary antibody (0.5 µg/mL concentration) and detected by chemiluminescence with Goat anti-Rabbit IgG (Heavy Chain) Superclonal™ Recombinant Secondary Antibody, HRP (Product # A27036,1:20000 dilution using the iBright™ FL1500 Imaging System (Product # A44115). Chemiluminescent detection was performed using SuperSignal™ West Pico PLUS Chemiluminescent Substrate (Product # 34580). Higher expression was observed in A-431 and HaCaT compared to U-2 OS.

- Submitted by
- Invitrogen Antibodies (provider)
- Main image
- Experimental details
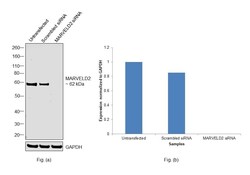
- Knockdown of MARVEL domain-containing protein 2 was achieved by transfecting HeLa with MARVEL domain-containing protein 2 specific siRNAs (Silencer® select Product # s45793, s45795). Western blot analysis (Fig. a) was performed using Membrane enriched extracts from the MARVEL domain-containing protein 2 knockdown cells (lane 3), non-targeting scrambled siRNA transfected cells (lane 2) and untransfected cells (lane 1). The blot was probed with MARVELD2 Recombinant Rabbit Monoclonal Antibody (54H19L38) (Product # 700191, 0.5 µg/mL concentration ) and Goat anti-Rabbit IgG (Heavy Chain) Superclonal™ Recombinant Secondary Antibody, HRP (Product # A27036, 1:20000 dilution). Densitometric analysis of this western blot is shown in histogram (Fig. b). Decrease in signal upon siRNA mediated knock down confirms that antibody is specific to MARVEL domain-containing protein 2.

- Submitted by
- Invitrogen Antibodies (provider)
- Main image
- Experimental details
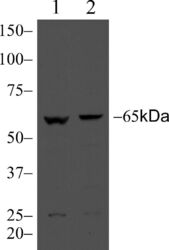
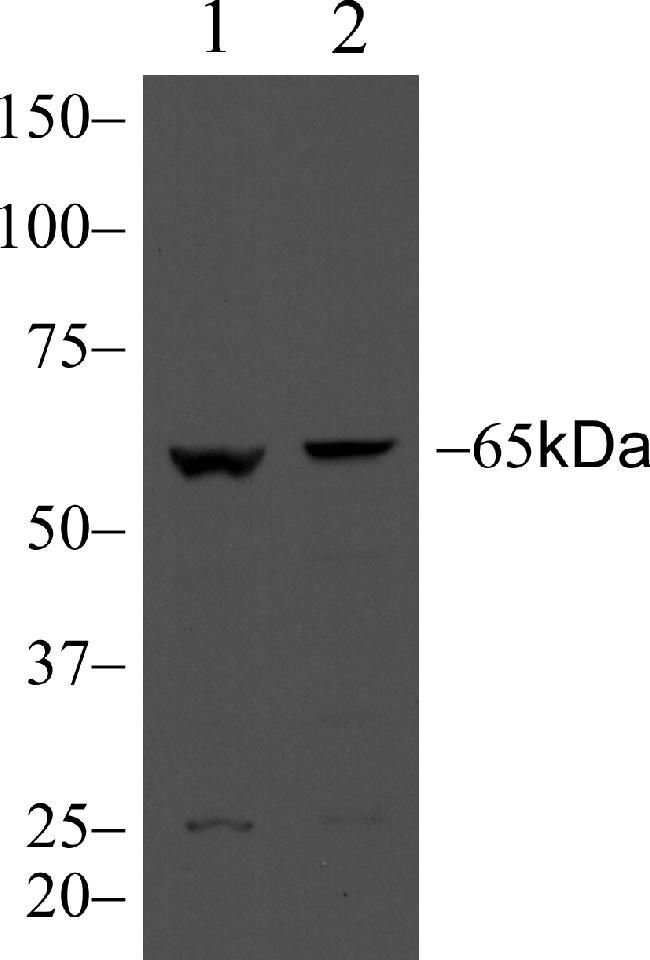
- Western blot analysis of MARVELD2 in Caco-2 (lane 1) or MDCK (lane 2) lysate using a MARVELD2 recombinant rabbit monoclonal antibody (Product # 700191) at a dilution of 3 µg/mL.
- Submitted by
- Invitrogen Antibodies (provider)
- Main image
- Experimental details
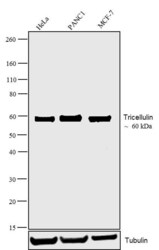
- Western blot analysis was performed on whole cell extracts (30 µg lysate) of HeLa (lane 1), PANC1 (lane 2) and MCF7 (lane 3). The blots were probed with Anti-Tricellulin Recombinant Rabbit Monoclonal Antibody (Product # 700191, 1-3 µg/mL) and detected by chemiluminescence Goat anti-Rabbit IgG (Heavy Chain) Superclonal™ Secondary Antibody, HRP conjugate (Product # A27036, 0.4 µg/mL, 1:2500 dilution). A 60 kDa band corresponding to Tricellulin was observed across cell lines tested. Known quantity of protein samples were electrophoresed using Novex® NuPAGE® 12 % Bis-Tris gel (Product # NP0342BOX), XCell SureLock™ Electrophoresis System (Product # EI0002) and Novex® Sharp Pre-Stained Protein Standard (Product # LC5800). Resolved proteins were then transferred onto a nitrocellulose membrane with iBlot® 2 Dry Blotting System (Product # IB21001). The membrane was probed with the relevant primary and secondary Antibody following blocking with 5 % skimmed milk. Chemiluminescent detection was performed using Pierce™ ECL Western blotting Substrate (Product # 32106).

- Submitted by
- Invitrogen Antibodies (provider)
- Main image

- Experimental details
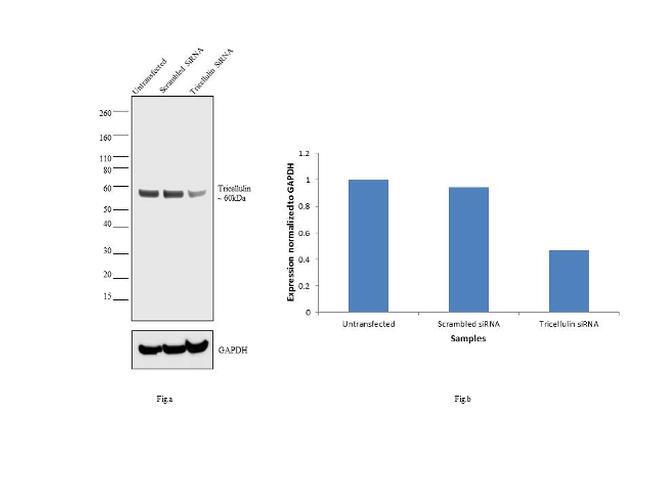
- Knockdown of Tricellulin was achieved by transfecting HeLa cells with Tricellulin specific siRNAs (Silencer® select Product # s532320, s45793). Western blot analysis (Fig a) was performed using whole cell extracts from the Tricellulin knockdown cells (lane 3), non-specific scrambled siRNA transfected cells (lane 2) and untransfected cells (lane 1). The blots were probed with Anti-Tricellulin Monoclonal Antibody (Product # 700191, 2 µg/mL) and Goat anti-Rabbit IgG (Heavy Chain) Superclonal™ Secondary Antibody, HRP conjugate (Product # A27036, 0.25 µg/mL, 1:4000 dilution). Densitometric analysis of this western blot is shown in histogram (Fig b). Decrease in signal upon siRNA mediated knock down confirms that antibody is specific to Tricellulin.
Supportive validation
- Submitted by
- Invitrogen Antibodies (provider)
- Main image

- Experimental details
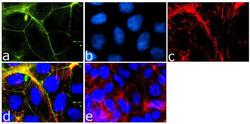
- Immunofluorescence analysis of Tricellulin was done on 90% confluent log phase Caco-2 cells. The cells were fixed with 4% paraformaldehyde for 15 minutes, permeabilized with 0.25% Triton™ X-100 for 10 minutes, and blocked with 5% BSA for 1 hour at room temperature. The cells were labeled with Tricellulin Rabbit Monoclonal Antibody (Product # 700191) at 1 µg/mL in 1% BSA and incubated for 3 hours at room temperature and then labeled with Goat anti-Rabbit IgG (H+L) Superclonal™ Secondary Antibody, Alexa Fluor® 488 conjugate (Product # A27034) at a dilution of 1:2000 for 45 minutes at room temperature (Panel a: green). Nuclei (Panel b: blue) were stained with SlowFade® Gold Antifade Mountant with DAPI (Product # S36938). F-actin (Panel c: red) was stained with Alexa Fluor® 555 Rhodamine Phalloidin (Product # R415, 1:300). Panel d is a merged image showing cell junctional localization. Panel e is a no primary antibody control. The images were captured at 60X magnification.

- Submitted by
- Invitrogen Antibodies (provider)
- Main image
- Experimental details
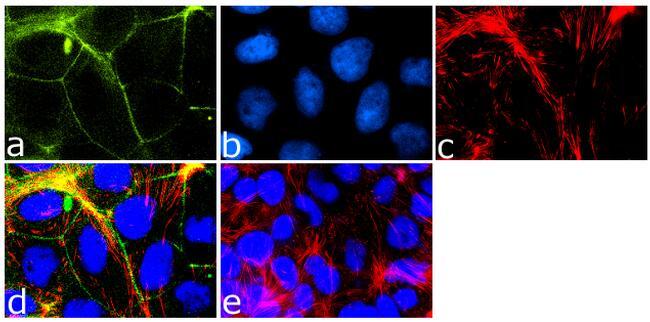
- Immunofluorescence analysis of Tricellulin was done on 90% confluent log phase Caco-2 cells. The cells were fixed with 4% paraformaldehyde for 15 minutes, permeabilized with 0.25% Triton™ X-100 for 10 minutes, and blocked with 5% BSA for 1 hour at room temperature. The cells were labeled with Tricellulin Rabbit Monoclonal Antibody (Product # 700191) at 1 µg/mL in 1% BSA and incubated for 3 hours at room temperature and then labeled with Goat anti-Rabbit IgG (Heavy Chain) Superclonal™ Secondary Antibody, Alexa Fluor® 488 conjugate (Product # A27034) at a dilution of 1:2000 for 45 minutes at room temperature (Panel a: green). Nuclei (Panel b: blue) were stained with SlowFade® Gold Antifade Mountant with DAPI (Product # S36938). F-actin (Panel c: red) was stained with Alexa Fluor® 555 Rhodamine Phalloidin (Product # R415, 1:300). Panel d is a merged image showing cell junctional localization. Panel e is a no primary antibody control. The images were captured at 60X magnification.
Supportive validation
- Submitted by
- Invitrogen Antibodies (provider)
- Main image
- Experimental details
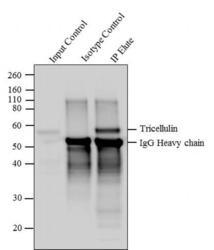
- Tricellulin was immunoprecipitated using 5 µg of the Tricellulin Recombinant Rabbit Monoclonal Antibody (Product # 700191) from lysate of HeLa (Lane 3) using the Dynabeads® Protein A Immunoprecipitation Kit (Product # 10006D). Normal Rabbit IgG was used as a Isotype control (Lane 2). 10 % input represents the cell extract used for immunoprecipitation (Lane 1). Western blot analysis was performed using Tricellulin Recombinant Rabbit Monoclonal Antibody (Product # 700191) and Goat anti-Rabbit IgG (Heavy Chain) Superclonal™ Secondary Antibody, HRP conjugate (Product # A27036, 0.4 µg/mL, 1:2500 dilution). Chemiluminescent detection was performed using Pierce™ ECL Western blotting Substrate (Product # 32106).

Supportive validation
- Submitted by
- Invitrogen Antibodies (provider)
- Main image
- Experimental details
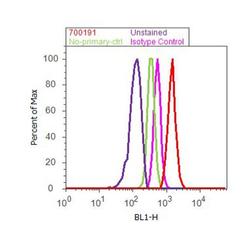
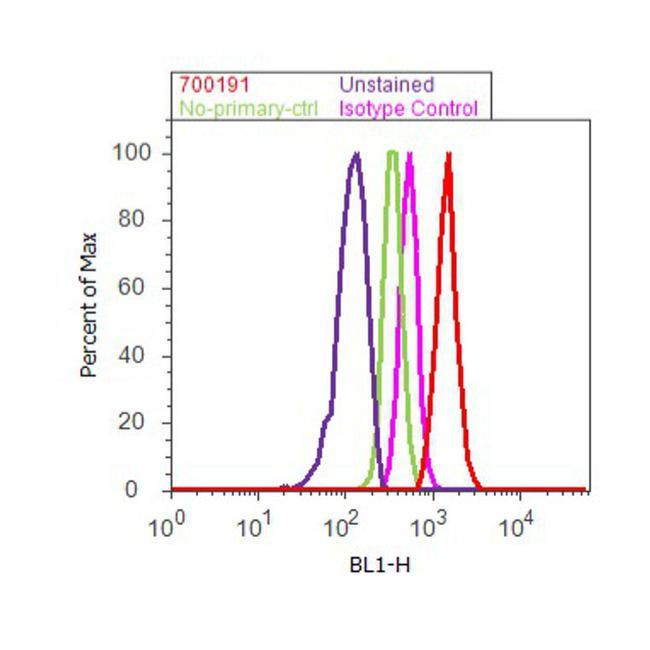
- Flow cytometry analysis of Tricellulin was done on MCF7 cells. Cells were fixed with 70% ethanol for 10 minutes, permeabilized with 0.25% Triton™ X-100 for 20 minutes, and blocked with 5% BSA for 30 minutes at room temperature. Cells were labeled with ABfinity™ Tricellulin Recombinant Rabbit Monoclonal Antibody (700191, red histogram) or with rabbit isotype control (pink histogram) at 3-5 ug/million cells in 2.5% BSA. After incubation at room temperature for 2 hours, the cells were labeled with Alexa Fluor® 488 Goat Anti-Rabbit Secondary Antibody (A11008) at a dilution of 1:400 for 30 minutes at room temperature. The representative 10,000 cells were acquired and analyzed for each sample using an Attune® Acoustic Focusing Cytometer. The purple histogram represents unstained control cells and the green histogram represents no-primary-antibody control.
Supportive validation
- Submitted by
- Invitrogen Antibodies (provider)
- Main image
- Experimental details
- NULL
- Submitted by
- Invitrogen Antibodies (provider)
- Main image
- Experimental details
- NULL
- Submitted by
- Invitrogen Antibodies (provider)
- Main image
- Experimental details
- NULL
- Submitted by
- Invitrogen Antibodies (provider)
- Main image
- Experimental details
- NULL
- Submitted by
- Invitrogen Antibodies (provider)
- Main image
- Experimental details
- NULL
- Submitted by
- Invitrogen Antibodies (provider)
- Main image

- Experimental details
- Tricellulin was immunoprecipitated using 5 æg of the Tricellulin Recombinant Rabbit Monoclonal Antibody (Product # 700191) from lysate of HeLa (Lane 3) using the Dynabeads® Protein A Immunoprecipitation Kit (Product # 10006D). Normal Rabbit IgG was used as a Isotype control (Lane 2). 10 % input represents the cell extract used for immunoprecipitation (Lane 1). Western blot analysis was performed using Tricellulin Recombinant Rabbit Monoclonal Antibody (Product # 700191) and Goat anti-Rabbit IgG (H+L) Superclonal™ Secondary Antibody, HRP conjugate (Product # A27036, 0.4 æg/mL, 1:2500 dilution). Chemiluminescent detection was performed using Pierce™ ECL Western blotting Substrate (Product # 32106).

- Submitted by
- Invitrogen Antibodies (provider)
- Main image
- Experimental details
- Figure 7 Staining of bi- and tricellular marker proteins in cell monolayer of wild-type and LSR-deficient CaCo-2 cells ( A ) Immunostaining of LSR (top panel), tricellulin (middle panel) and E-cadherin (bottom panel) in CaCo-2 WT and CaCo-2 DeltaLSR cells with specific antibodies and analysis of the intracellular distribution of the respective proteins via confocal fluorescence microscopy. ( B ) Reconstitution of LSR expression in CaCo-2 DeltaLSR cells. CaCo-2 DeltaLSR cells were transfected with a plasmid that leads to ectopic expression of LSR-EGFP (green signal). Cells were immunostained for tricellulin (red signal). Arrows indicate accumulation of LSR-EGFP and tricellulin in tricellular contacts. Scale bars represent 10 muM.

- Submitted by
- Invitrogen Antibodies (provider)
- Main image
- Experimental details
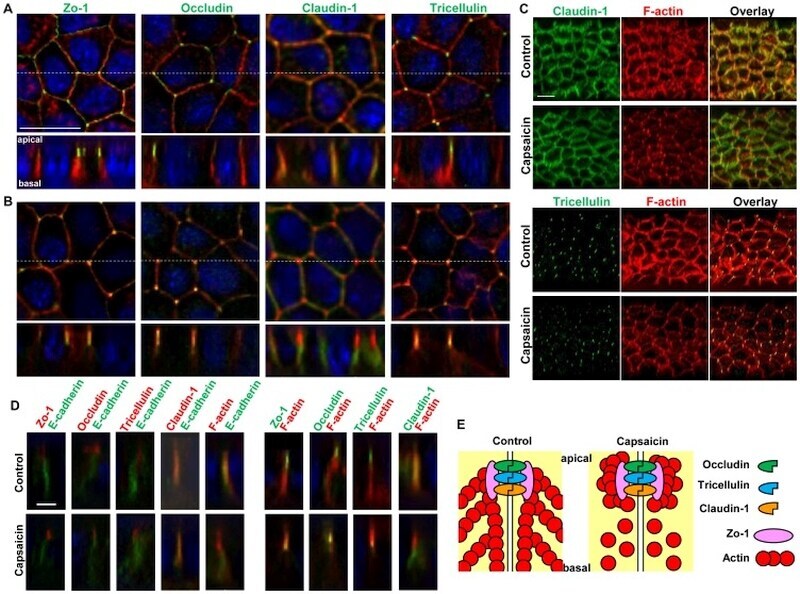
- Figure 4 Capsaicin decreases occludin protein content and the protein-protein interactions involving occludin in TJ. (A,B) MDCK monolayers were exposed to ethanol control or 300 uM capsaicin for 45 min. (A) The cellular localization of the TJ proteins occludin and claudin-1 was examined by immunofluorescence. Scale bar: 10 um. (B) Western blot detection of occludin, tricellulin, Zo-1, claudin-1, E-cadherin and actin in the cytosol, membrane fractions and total cell extracts. The densitometic analysis of total proteins from three independent experiments performed with NIH ImageJ software. **represents p
- Submitted by
- Invitrogen Antibodies (provider)
- Main image
- Experimental details
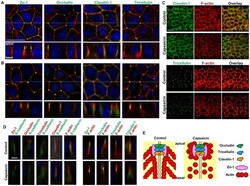
- Figure 3 Effects of capsaicin on the distribution of TJ proteins and F-actin. (A, B) Monolayers were exposed to vehicle (A) or 300 uM capsaicin (B) for 45 min and were labeled with each TJ antibody (green), rhodamine-phalloidin (red) and Hoechst (blue). Images were collected as a Z-series, and then deconvoluted and overlayed to display a single composite projection. Top : XY sections of merged images. Bottom : XZ sections of merged images. Scale bar: 10 um. The corresponding TJ antibodies are listed above the images. (C) 3D projection images in a 45deg-angle of claudin-1 and tricellulin staining, plus F-actin. Scale bar: 10 um. (D) MDCK monolayers exposed to vehicle (top) or capsaicin (bottom) as above were stained with E-cadherin. The colors corresponding to each antibody are listed above the images. Scale bar: 2.5 um. (E) Schematic explanation of the protein distributions.
- Submitted by
- Invitrogen Antibodies (provider)
- Main image
- Experimental details
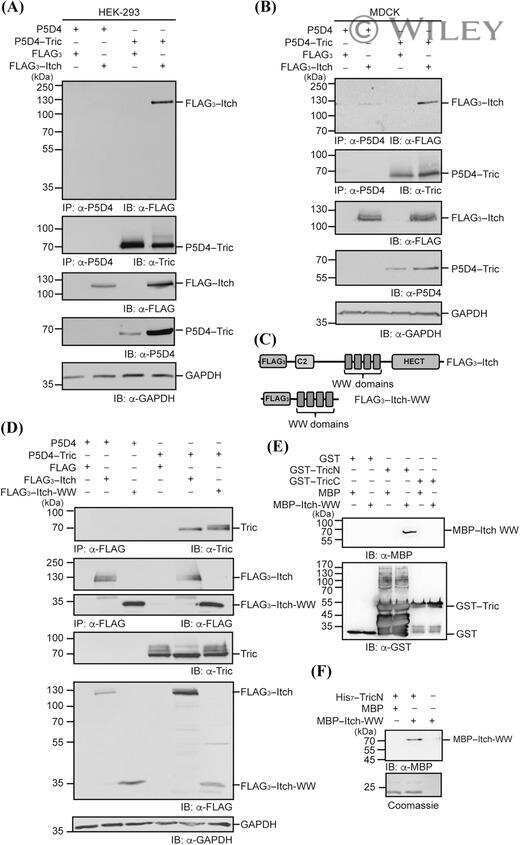
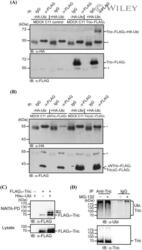
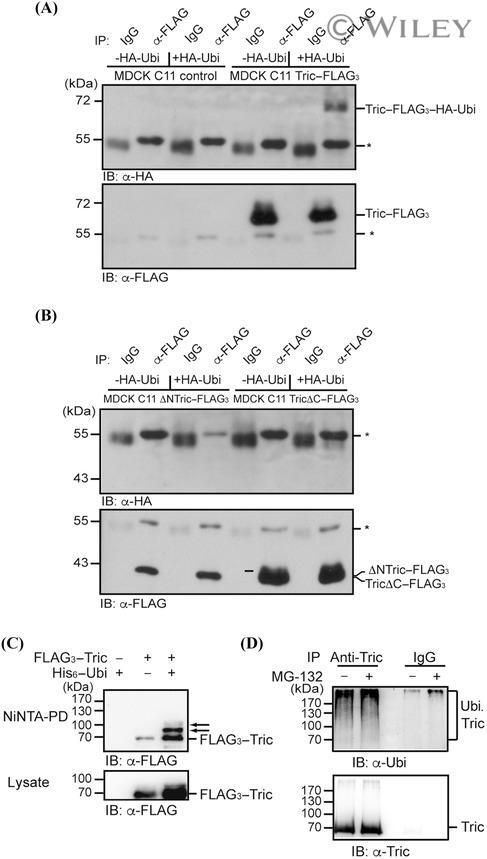
- Tricellulin is targeted by ubiquitination. (A & B) MDCK C11 cells stably transfected with empty vector, tricellulin-FLAG 3 , DeltaN-tricellulin-FLAG 3 or tricellulin-DeltaC-FLAG 3 were transiently transfected with HA-ubiquitin or empty vector as a control and lysed 48 h after transfection in modified RIPA buffer. Cell lysates were incubated with mouse IgG as a control or anti-FLAG M2 antibody. Protein complexes were precipitated with protein A sepharose and analyzed by SDS-PAGE and western blotting with anti-FLAG and anti-HA antibodies. *, heavy chain of precipitating antibody. (C) Caco-2 cells were transiently transfected with FLAG 3 -tricellulin and His 6 -ubiquitin or empty vector for 48 hours. Ubiquitinated proteins were isolated from cell lysates with Ni-NTA agarose and analyzed for tricellulin (upper panel) by SDS-PAGE and western blotting with anti-FLAG antibody. Cell lysates were analyzed as transfection controls in the lower panel. Arrows mark shifted modified tricellulin bands. (D) Confluent Caco-2 cells were lysed and incubated with rabbit IgG as control or anti-tricellulin antibody for 1 h and with protein A sepharose overnight. Precipitated protein complexes were analyzed by SDS-PAGE and western blotting with anti-ubiquitin (P4D1) and anti-tricellulin antibodies.
- Submitted by
- Invitrogen Antibodies (provider)
- Main image

- Experimental details
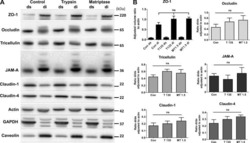
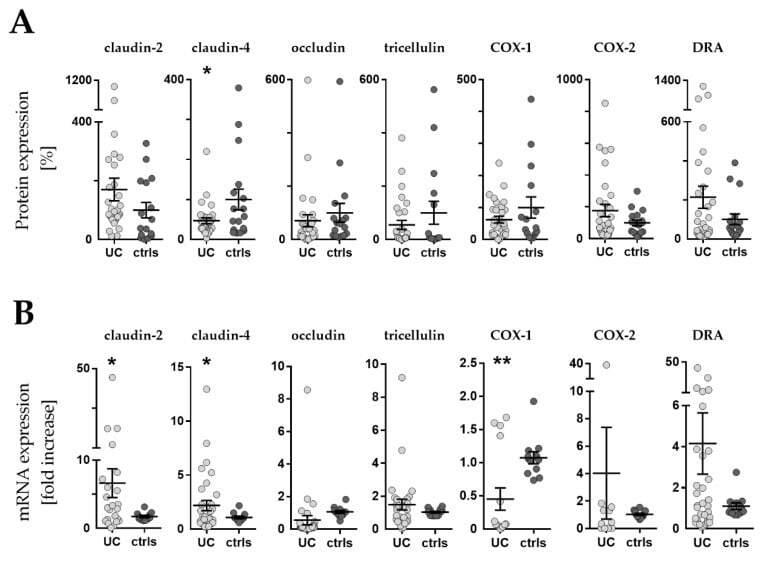
- Figure 3 Western blot and RT-qPCR. ( A ) Expression levels of barrier related proteins by densitometric analysis of Western blot (WB). Values are expressed as % of a mean of all controls (ctrls). Bars indicate mean +- standard error of the mean. Asterisk indicates statistically significant difference between groups (* p < 0.05). ( B ) mRNA levels by RT-qPCR. Values are expressed relative to a mean of all controls. Three controls (18%, 3/17) presented a different baseline of housekeeping genes, while two controls (12%, 2/17) presented outliers, which were removed, leaving the final number of controls for mRNA analysis at 12 (70% 12/17). One outlier (3%, 1/33) was removed from the UC group. n = number of UC observations: COX-1 ( n = 16), COX-2 ( n = 11), claudin-2 ( n = 23), claudin-4 ( n = 33), occludin ( n = 31), tricellulin ( n = 29), and DRA ( n = 33). Bars indicate mean +- standard error of the mean. Asterisks indicate statistically significant difference between two groups (* p < 0.05, ** p < 0.01).
- Submitted by
- Invitrogen Antibodies (provider)
- Main image
- Experimental details
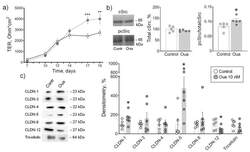
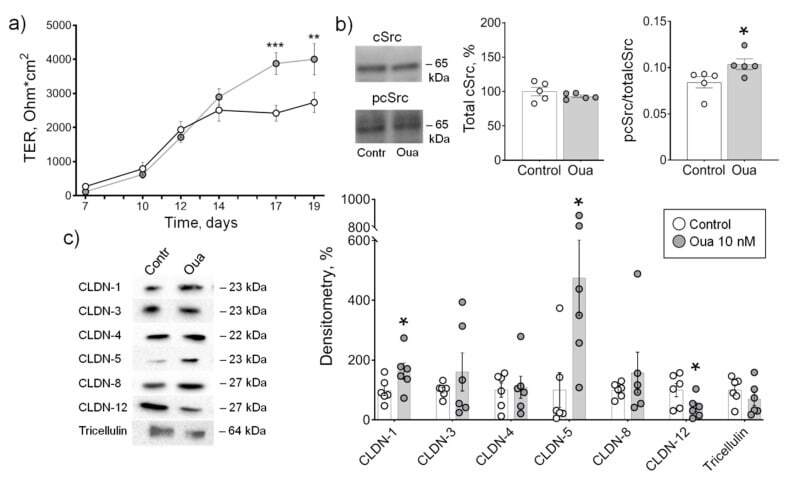
- Figure 1 Epithelial barrier formation in IPEC-J2 cells grown in control medium and in the presence of 10 nM ouabain (Oua). After 7 days of culture, transepithelial resistance (TER) values were determined every 2-3 days using an EVOM volt-ohmmeter; after 19 days, cells were used for subsequent analysis. ( a ) Transepithelial resistance (TER) ( n = 6 for each group). ( b ) The expression level of total cSrc (central plot, the relative expression of cSrc protein shown as a percentage of average level in control samples taken for 100%) and the cSrc-kinase activation by phosphorylation (right plot, shown as a ratio between immunoblot intensity corresponding to phosphorylated pcSrc over total cSrc, as it is shown in the representative immunoblots in left panel) ( n = 5 for each group). ( c ) Western blot analysis of claudin (CLDN) and tricellulin expression ( n = 6 for each group); left panel shows representative immunoblots. Original images for Western blots using Stain-Free gels as a loading control are shown in Supplemental Materials . The number of symbols corresponds to the number of samples. One-way ANOVA with Dunnett correction: * p < 0.05, ** p < 0.01 and *** p < 0.001 compared with the corresponding control.
- Submitted by
- Invitrogen Antibodies (provider)
- Main image
- Experimental details
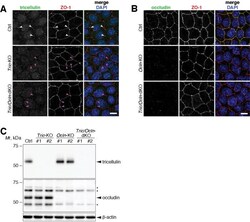
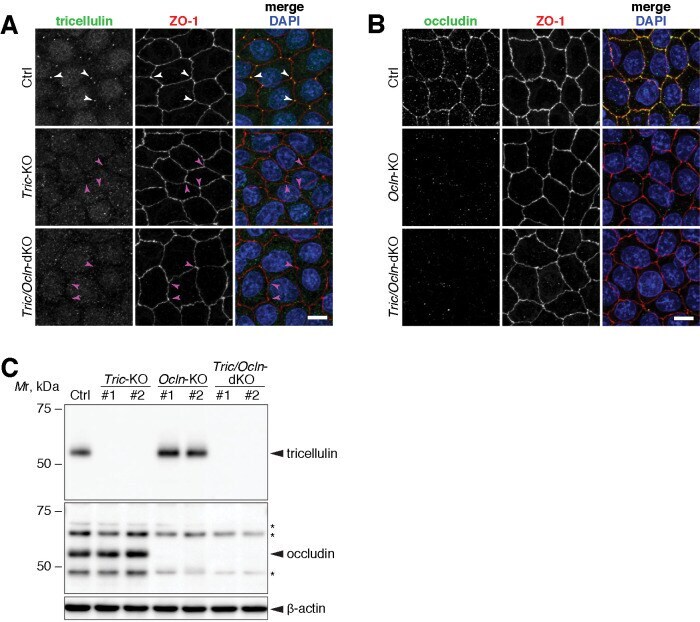
- FIGURE 1: Establishment of Tric -KO, Ocln -KO, and Tric / Ocln -dKO cells. (A, B) Ctrl, Tric -KO #1, and Tric / Ocln -dKO #1 cells (A) and Ctrl, Ocln -KO #1, and Tric / Ocln -dKO #1 cells (B) were immunostained with rat anti-tricellulin mAb (A) or rat anti-occludin mAb (B) (green) and rabbit anti-ZO-1 pAb (red). All cells were stained with DAPI (blue). Note that tricellulin signal (white arrowheads) is absent in the Tric -KO and Tric / Ocln -dKO cells (magenta arrowheads) in A. Scale bars, 20 um. (C) Immunoblotting of the total cell lysates of Ctrl, Tric -KO, Ocln -KO, and Tric / Ocln -dKO cells using rabbit anti-tricellulin mAb and rabbit anti-occludin pAb. Asterisks on the occludin panel indicate nonspecific bands. beta-Actin served as a loading control.
- Submitted by
- Invitrogen Antibodies (provider)
- Main image
- Experimental details
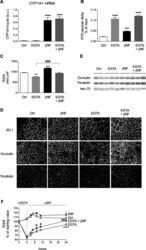
- Figure 3 Protective role of AhR activation on EGTA-induced damage to barrier integrity in Caco-2/TC7 cells. ( A ) Caco-2/TC7 cells were pre-incubated without (Ctrl) or with 20 muM betaNF for 4 consecutive days before the addition or 4.5 mM EGTA for additional 24 h betaNF treatment was maintained during all of the experiments. The expression of CYP1A1 was quantified by RT-qPCR. Cyclophilin was used as a reference gene. The results are expressed in arbitrary units (a.u.) as the ratio of the target gene to cyclophilin (cyclo) mRNA level as mean +- SEM, n = 6-15 from 3 independent experiments, ****p < 0.0001 compared to controls. ( B ) The cells were cultured under the same conditions as in (A). Paracellular permeability across Caco-2/TC7 cell monolayers was evaluated by measuring the accumulation during 4 h of 4 kDa FITC-dextran (FD4) in the basal compartment. The results are expressed as percentage of FD4 input (amount added in the apical compartment), mean +- SEM, n = 6-15 from 3 independent experiments, ***p < 0.001, and ****p < 0.0001 compared to controls. ( C ) The cells were cultured under the same conditions as in (A). TEER was assessed in the control and treated cells. The results are expressed in ohm.cm 2 as mean +- SEM, n = 6-15 from 3 independent experiments, **p < 0.01, and ***p < 0.001 compared to controls. ###p < 0.001 compared to EGTA. ( D ) The cells were cultured under the same conditions as in (A). Immunofluorescence analysis was conducted to study the location

- Submitted by
- Invitrogen Antibodies (provider)
- Main image
- Experimental details
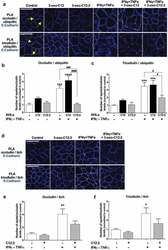
- Figure 6. The 3-oxo-C12:2 AHL protects occludin and tricellulin from ubiquitination induced at the plasma membrane in presence of pro-inflammatory cytokines . Caco-2/TC7 cells were treated on their apical side by each AHL (150 uM, 48 h) or on their basal side by IFNgamma+TNFalpha (50 ng/mL, 48h). Treatments were performed individually or in combination as indicated. (a-c) Ubiquitination levels of occludin or tricellulin were determined by Proximity Ligation Assay (PLA). (a) Representative fields of structured illumination microscopy images of PLA (white spots) between occludin and ubiquitin (top) or between tricellulin and ubiquitin (bottom). Cell-cell contacts are visualized by E-Cadherin immunofluorescence staining in blue. The solid line arrows show PLA spots localized at the plasma membrane while dashed line arrows show PLA spots localized within the intracellular space. Scale bar: 20 um. (b) Quantification of the number of occludin/ubiquitin PLA spots normalized to occludin fluorescence levels. Results are expressed as ratio values normalized to the control condition (mean +- SEM of 2 or 3 replicates from 3 independent experiments, ordinary one-way ANOVA ****P < .0001). (c) Quantification of the number of tricellulin/ubiquitin PLA spots normalized to tricellulin fluorescence levels (mean +- SEM of 2 or 3 replicates from 3 independent experiments, ordinary one-way ANOVA ****P < .0001). (d-f) Interaction of occludin and tricellulin with the ubiquitin-ligase itch was determ
