 Explore
 Validate
 Learn
LearnMA5-32740
antibody from Invitrogen Antibodies
Targeting: EFNB2
EPLG5, Htk-L, HTKL, LERK5, MGC126226, MGC126227, MGC126228
 Western blot
 Immunocytochemistry
Antibody data
- Antibody Data
- Antigen structure
- References [1]
- Comments [0]
- Validations
- Immunocytochemistry [6]
- Other assay [2]
Submit
Validation data
Reference
Comment
Report error
- Product number
- MA5-32740 - Provider product page

- Provider
- Invitrogen Antibodies
- Product name
- Ephrin B2 Recombinant Rabbit Monoclonal Antibody (JM53-21)
- Antibody type
- Monoclonal
- Antigen
- Synthetic peptide
- Description
- Recombinant rabbit monoclonal antibodies are produced using in vitro expression systems. The expression systems are developed by cloning in the specific antibody DNA sequences from immunoreactive rabbits. Then, individual clones are screened to select the best candidates for production. The advantages of using recombinant rabbit monoclonal antibodies include: better specificity and sensitivity, lot-to-lot consistency, animal origin-free formulations, and broader immunoreactivity to diverse targets due to larger rabbit immune repertoire.
- Reactivity
- Human, Mouse, Rat
- Host
- Rabbit
- Isotype
- IgG
- Antibody clone number
- JM53-21
- Vial size
- 100 μL
- Concentration
- 1 mg/mL
- Storage
- Store at 4°C short term. For long term storage, store at -20°C, avoiding freeze/thaw cycles.
Submitted references Inhibition of TGF-β repairs spinal cord injury by attenuating EphrinB2 expressing through inducing miR-484 from fibroblast.
Pan D, Yang F, Zhu S, Li Y, Ning G, Feng S
Cell death discovery 2021 Oct 28;7(1):319
Cell death discovery 2021 Oct 28;7(1):319
No comments: Submit comment
Supportive validation
- Submitted by
- Invitrogen Antibodies (provider)
- Main image
- Experimental details
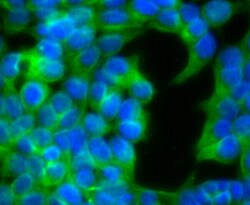
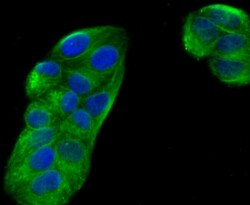
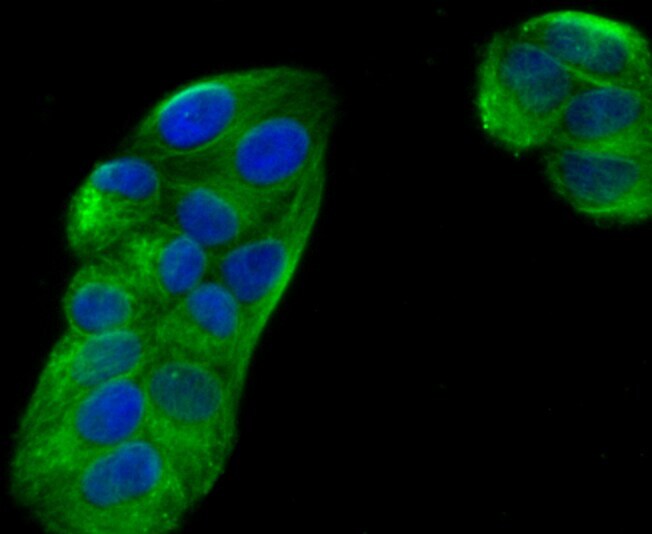
- Immunocytochemical analysis of Ephrin B1 in 293T cells using a Ephrin B1 Monoclonal antibody (Product # MA5-32740) as seen in green. The nuclear counter stain is DAPI (blue). Cells were fixed in paraformaldehyde, permeabilised with 0.25% Triton X100/PBS.

- Submitted by
- Invitrogen Antibodies (provider)
- Main image
- Experimental details
- Immunocytochemical analysis of Ephrin B1 in Hela cells using a Ephrin B1 Monoclonal antibody (Product # MA5-32740) as seen in green. The nuclear counter stain is DAPI (blue). Cells were fixed in paraformaldehyde, permeabilised with 0.25% Triton X100/PBS.
- Submitted by
- Invitrogen Antibodies (provider)
- Main image

- Experimental details
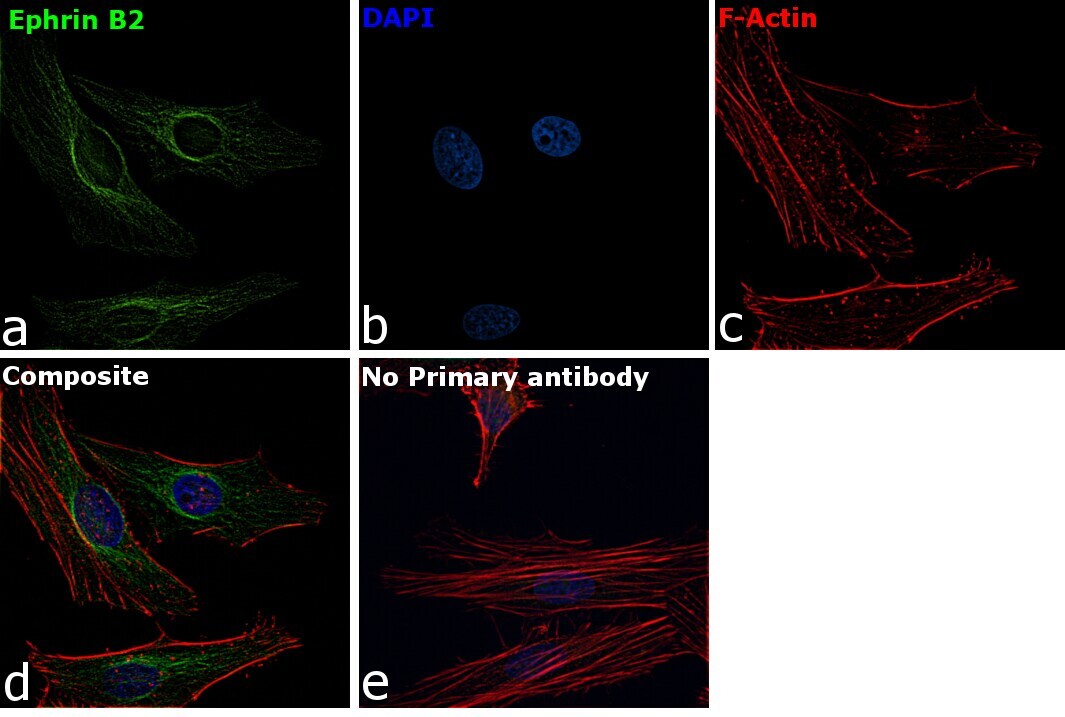
- Immunofluorescence analysis of EFNB2 was performed using 70% confluent log phase HeLa cells. The cells were fixed with 4% paraformaldehyde for 10 minutes, permeabilized with 0.1% Triton™ X-100 for 15 minutes, and blocked with 2% BSA for 1 hour at room temperature. The cells were labeled with Ephrin B2 Recombinant Rabbit Monoclonal Antibody (JM53-21) (Product # MA5-32740) at 1 µg/mL in 0.1% BSA, incubated at 4 degree celsius overnight and then with Goat anti-Rabbit IgG (H+L), Superclonal™ Recombinant Secondary Antibody, Alexa Fluor 488 conjugate (Product # A27034) at a dilution of 1:2000 for 45 minutes at room temperature (Panel a: green). Nuclei (Panel b: blue) were stained with SlowFade® Gold Antifade Mountant with DAPI (Product # S36938). F-actin (Panel c: red) was stained with Rhodamine Phalloidin (Product # R415, 1:300). Panel d represents the merged image showing staining in plasma membrane. Panel e represents control cells with no primary antibody to assess background. The images were captured at 60X magnification.
- Submitted by
- Invitrogen Antibodies (provider)
- Main image

- Experimental details
- Immunocytochemical analysis of Ephrin B1 in 293T cells using a Ephrin B1 Monoclonal antibody (Product # MA5-32740) as seen in green. The nuclear counter stain is DAPI (blue). Cells were fixed in paraformaldehyde, permeabilised with 0.25% Triton X100/PBS.

- Submitted by
- Invitrogen Antibodies (provider)
- Main image

- Experimental details
- Immunocytochemical analysis of Ephrin B1 in Hela cells using a Ephrin B1 Monoclonal antibody (Product # MA5-32740) as seen in green. The nuclear counter stain is DAPI (blue). Cells were fixed in paraformaldehyde, permeabilised with 0.25% Triton X100/PBS.

- Submitted by
- Invitrogen Antibodies (provider)
- Main image

- Experimental details
- Immunofluorescence analysis of EFNB2 was performed using 70% confluent log phase HeLa cells. The cells were fixed with 4% paraformaldehyde for 10 minutes, permeabilized with 0.1% Triton™ X-100 for 15 minutes, and blocked with 2% BSA for 1 hour at room temperature. The cells were labeled with Ephrin B2 Recombinant Rabbit Monoclonal Antibody (JM53-21) (Product # MA5-32740) at 1 µg/mL in 0.1% BSA, incubated at 4 degree celsius overnight and then with Goat anti-Rabbit IgG (Heavy Chain), Superclonal™ Recombinant Secondary Antibody, Alexa Fluor 488 conjugate (Product # A27034) at a dilution of 1:2000 for 45 minutes at room temperature (Panel a: green). Nuclei (Panel b: blue) were stained with SlowFade® Gold Antifade Mountant with DAPI (Product # S36938). F-actin (Panel c: red) was stained with Rhodamine Phalloidin (Product # R415, 1:300). Panel d represents the merged image showing staining in plasma membrane. Panel e represents control cells with no primary antibody to assess background. The images were captured at 60X magnification.

Supportive validation
- Submitted by
- Invitrogen Antibodies (provider)
- Main image
- Experimental details
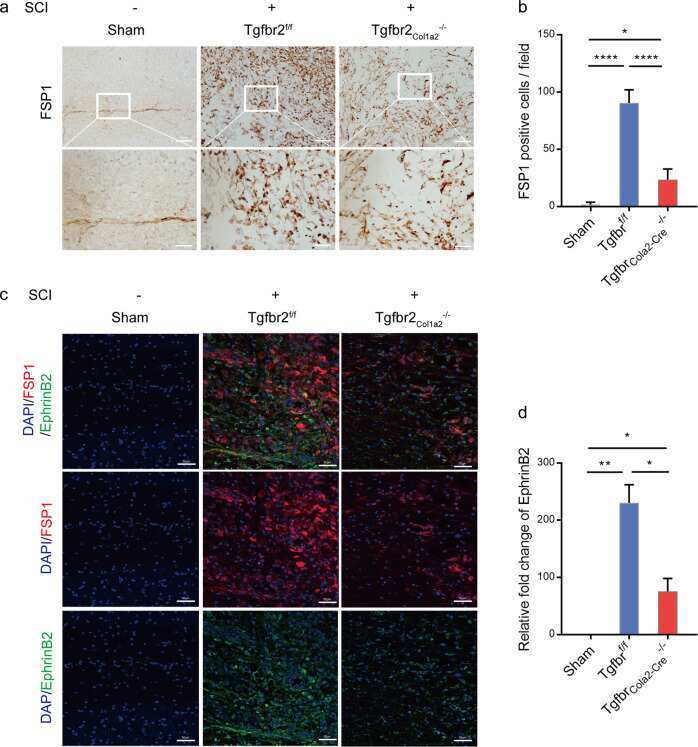
- Fig. 3 Genetic knockout TGF-beta receptor 2 in fibroblasts attenuates EphrinB2 expression and induced nerve distribution. a Representative images of Immunohistochemistry analysis of FSP1 in Tgfbr2 Col1alpha2 -/- mice and Tgfbr2 flox/flox mice after SCI and Tgfbr2 flox/flox mice without surgery (Sham) at 2 weeks. Scale bars = 100 mum. Images on the bottom are high-resolution versions of the boxed regions in the top images, scale bars = 25 um. b , c Quantitative analysis of FSP1 positive cells/field (* p < 0.05, **** p < 0.0001, n = 4). c Representative images of immunofluorescence analysis of FSP1 (red), EphrinB2 (green) and DAPI (blue) in each group at 2 weeks after SCI. Scale bars = 50 mum. d Quantitative analysis of relative fold change of EphrinB2 (* p < 0.05, ** p < 0.01, n = 4).
- Submitted by
- Invitrogen Antibodies (provider)
- Main image
- Experimental details
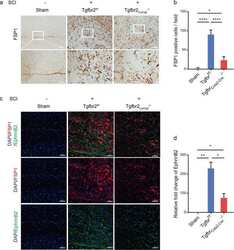
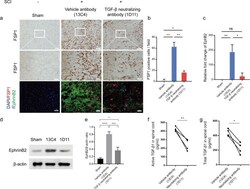
- Fig. 1 Fibroblast secreting and EphrinB2 expression are inhibited in TGF-beta knockout mice. a Representative images of Immunohistochemistry and immunofluorescence analysis of FSP1 (red), EphrinB2 (green) and DAPI (blue) in each group at 2 weeks after SCI. Scale bars = 100 mum. Images on the middle row are high-resolution versions of the boxed regions in the top images, scale bars = 25 um. b , c Quantitative analysis of FSP1 positive cells/field and relative fold change of EphrinB2 (* p < 0.05, ** p < 0.01, n = 4). d Representative western blots showing the expression of EphrinB2 indifferent groups in vivo. e Quantitative analysis of the EphrinB2/beta-tublin ratio in different groups mice after SCI (* p < 0.05, *** p < 0.001, **** p < 0.0001, n = 3). f , g Elisa analysis showing the concentration of TGF-beta in spinal cord after SCI between 13C4 group control mice and 1D11 group mice (* p < 0.05, ** p < 0.01, n = 4).
