 Explore
 Validate
 Learn
Learn14-9778-80
antibody from Invitrogen Antibodies
Targeting: LAMP5
BAD-LAMP, C20orf103, dJ1119D9.3, UNC-46
 Western blot
 Immunohistochemistry
Antibody data
- Antibody Data
- Antigen structure
- References [5]
- Comments [0]
- Validations
- Immunohistochemistry [1]
- Other assay [2]
Submit
Validation data
Reference
Comment
Report error
- Product number
- 14-9778-80 - Provider product page

- Provider
- Invitrogen Antibodies
- Product name
- LAMP5 (BAD-LAMP) Monoclonal Antibody (34.2), eBioscience™
- Antibody type
- Monoclonal
- Antigen
- Other
- Description
- The monoclonal antibody 34.2 recognizes human lysosome-associated membrane protein 5 (LAMP5), a member of the LAMP family. LAMP5 differs from other LAMP family members in that its expression is more restricted and is referred to as brain and dendritic cell-associated LAMP-like molecule (BAD-LAMP). In humans, BAD-LAMP is expressed in post-natal neurons and non-activated plasmacytoid dendritic cells. Expression in neurons is localized to intracellular vesicles distributed in specific microdomains along neurites and may play a role in endocytosis. BAD-LAMP is localized to the endoplasmic reticulum-Golgi intermediate compartment (ERGIC) of plasmacytoid dendritic cells and is lost upon TLR activation. This 34.2 antibody has been tested by immunohistochemistry of formalin-fixed paraffin embedded tissue using high or low pH antigen retrieval and can be used at less than or equal to 1 µg/mL. This 34.2 antibody has been tested by western blot analysis of reduced SK-N-SH cell lysates and can be used at less than or equal to 5 µg/mL. It is recommended that the antibody be carefully titrated for optimal performance in the assay of interest. Purity: Greater than 90%, as determined by SDS-PAGE. Aggregation: Less than 10%, as determined by HPLC. Filtration: 0.2 µm post-manufacturing filtered.
- Reactivity
- Human
- Host
- Rat
- Isotype
- IgG
- Antibody clone number
- 34.2
- Vial size
- 25 μg
- Concentration
- 0.5 mg/mL
- Storage
- 4°C
Submitted references BAD-LAMP controls TLR9 trafficking and signalling in human plasmacytoid dendritic cells.
Crystal structure of the conserved domain of the DC lysosomal associated membrane protein: implications for the lysosomal glycocalyx.
BAD-LAMP is a novel biomarker of nonactivated human plasmacytoid dendritic cells.
BAD-LAMP defines a subset of early endocytic organelles in subpopulations of cortical projection neurons.
[Development of EEG changes in subacute leukoencephalitis].
Combes A, Camosseto V, N'Guessan P, Argüello RJ, Mussard J, Caux C, Bendriss-Vermare N, Pierre P, Gatti E
Nature communications 2017 Oct 13;8(1):913
Nature communications 2017 Oct 13;8(1):913
Crystal structure of the conserved domain of the DC lysosomal associated membrane protein: implications for the lysosomal glycocalyx.
Wilke S, Krausze J, Büssow K
BMC biology 2012 Jul 19;10:62
BMC biology 2012 Jul 19;10:62
BAD-LAMP is a novel biomarker of nonactivated human plasmacytoid dendritic cells.
Defays A, David A, de Gassart A, De Angelis Rigotti F, Wenger T, Camossetto V, Brousset P, Petrella T, Dalod M, Gatti E, Pierre P
Blood 2011 Jul 21;118(3):609-17
Blood 2011 Jul 21;118(3):609-17
BAD-LAMP defines a subset of early endocytic organelles in subpopulations of cortical projection neurons.
David A, Tiveron MC, Defays A, Beclin C, Camosseto V, Gatti E, Cremer H, Pierre P
Journal of cell science 2007 Jan 15;120(Pt 2):353-65
Journal of cell science 2007 Jan 15;120(Pt 2):353-65
[Development of EEG changes in subacute leukoencephalitis].
Sofijanov N, Dukovski M, Sadikario A
Godisen zbornik na Medicinskiot fakultet vo Skopje 1977;23:729-38
Godisen zbornik na Medicinskiot fakultet vo Skopje 1977;23:729-38
No comments: Submit comment
Supportive validation
- Submitted by
- Invitrogen Antibodies (provider)
- Main image
- Experimental details
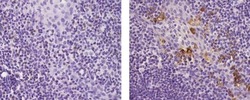
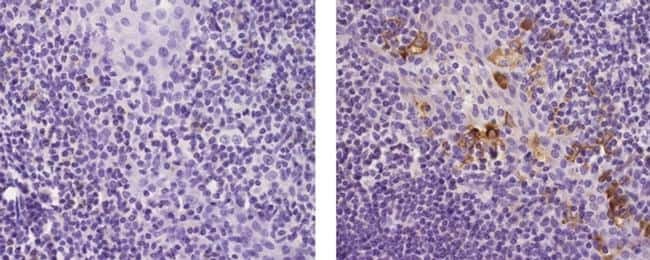
- Immunohistochemistry of formalin-fixed paraffin embedded human tonsil using 1 µg/mL of Rat IgG1 K Isotype Control Purified (left) or 1 µg/mL of Anti-Human LAMP5 (BAD-LAMP) Purified (right) followed by Anti-Rat IgG Biotin, Avidin HRP, and DAB visualization.Nuclei are counterstained with hematoxylin.
Supportive validation
- Submitted by
- Invitrogen Antibodies (provider)
- Main image
- Experimental details
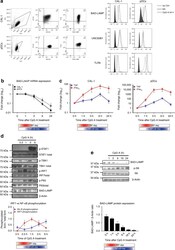
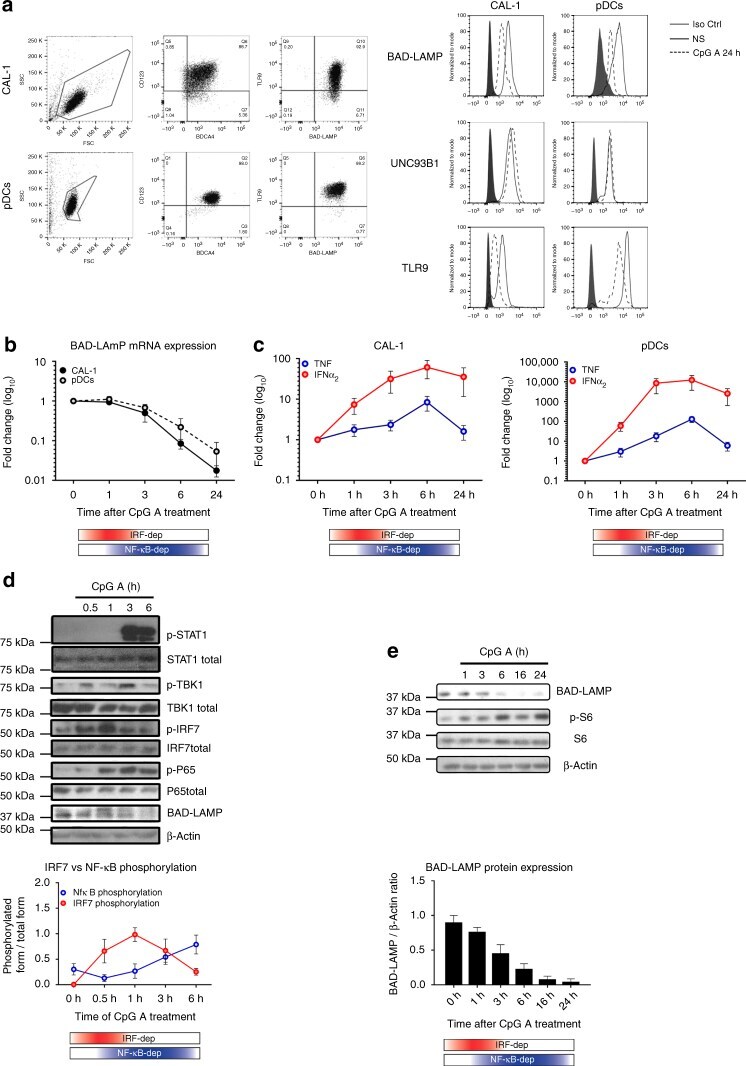
- Fig. 1 BAD-LAMP is down-modulated after IRF7 activation. a ( left ) Flow cytometry analysis of CAL-1 cells ( top ) and freshly isolated pDCs ( bottom ) from healthy donors stained for both extracellular (CD123 and BADCA4) and intracellular (TLR9 and BAD-LAMP) pDCs markers. ( right ) Flow cytometry histogram plots of intracellular staining for BAD-LAMP, TLR9 and UNC93B1 in both CAL-1 ( left ) and freshly isolated pDCs ( right ) at steady state ( black line ) and after 24 h of CpG-A stimulation ( dashed line ). Full grey histograms represent isotype controls staining. Data are representative of a minimum of three independent experiments. b CAL-1 ( black line ) and freshly isolated pDCs ( dashed line ) were treated with CpG-A for indicated times. BAD-LAMP mRNA levels were measured by RT-qPCR. Raw data have been normalised to housekeeping gene (GAPDH) and graphics represent fold change +- s.d. compared to non-stimulated cells from a minimum of three independent experiments. c IFNalpha 2 ( red ) and TNF ( blue ) mRNA level from CAL-1 ( left ) and freshly isolated pDCs ( right ) were measured by RT-qPCR. Raw data have been normalised to housekeeping gene (GAPDH) and graphics represent fold change +- s.d. compared to non-stimulated cells from a minimum of three independent experiments. d ( top ) CAL-1 cells were treated with CpG-A for indicated times prior lysis and sodium dodecyl sulphate-polyacrylamide gel electrophoresis treatment. Expression of BAD-LAMP, TBK1, IRF7, STAT1, the p
- Submitted by
- Invitrogen Antibodies (provider)
- Main image
- Experimental details
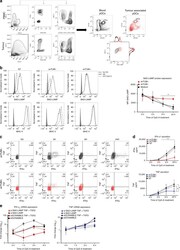
- Fig. 10 BAD-LAMP expression in tumour-associated pDCs correlates with low IFN-alpha production. a ( left ) Flow cytometry pDC gating strategy on both PBMC ( top ) and tumour ( bottom ) is shown. pDCs (BDCA2 + ; CD123 + ) were segregated from conventional dendritic cells (Lin - , MHC II high ) after identification of live hematopoietic cells (CD45 + Live Dead - ). ( right ) CD123 + /BDCA4 + pDCs from blood ( black ) or from primary breast tumours ( red ) were further analysed for BAD-LAMP and MHC II expression. Data are representative of three patients. b Freshly isolated pDCs from healthy donors were treated for 16 h with tumour supernatant either devoid of (snTUM-) or enriched in (snTUM+) TNF and TGF-beta. ( left ) BAD-LAMP and MHC II histogram plots from FACS staining at steady state ( black line ) or 24 h ( dashed line ) after CpG-A treatment. Full grey histogram represents isotype control. Data are representative for five independent experiments performed with eight different tumour supernatants. ( right ) Levels of BAD-LAMP shown as MFI from FACS intracellular staining in pDCs pre-treated with snTUM- ( dashed line ), snTUM + ( red line ) or with medium ( black lines ). MFI +- s.d. from five independent experiments. c Freshly isolated pDCs from heathy donors were treated for 16 h with tumour supernatant either devoid of (snTUM-; black) or enriched in (snTUM + ; red) in TNF and TGF-beta. 2D FACS analysis of intracellular staining for IFN-alpha and TNF cytokines at differen
