Explore
 Validate
 Learn
Learn Western blot
Antibody data
- Antibody Data
- Antigen structure
- References [4]
- Comments [0]
- Validations
- Western blot [1]
- Immunohistochemistry [1]
- Flow cytometry [3]
- Other assay [9]
Submit
Validation data
Reference
Comment
Report error
- Product number
- PA5-26279 - Provider product page

- Provider
- Invitrogen Antibodies
- Product name
- ATP1B2 Polyclonal Antibody
- Antibody type
- Polyclonal
- Antigen
- Synthetic peptide
- Description
- This antibody is predicted to react with bovine, mouse, rat and rabbit based on sequence homology.
- Reactivity
- Human
- Host
- Rabbit
- Isotype
- IgG
- Vial size
- 400 μL
- Concentration
- 0.5 mg/mL
- Storage
- Store at 4°C short term. For long term storage, store at -20°C, avoiding freeze/thaw cycles.
Submitted references Identification of the retinoschisin-binding site on the retinal Na/K-ATPase.
Glioma malignancy is linked to interdependent and inverse AMOG and L1 adhesion molecule expression.
A SINE Insertion in ATP1B2 in Belgian Shepherd Dogs Affected by Spongy Degeneration with Cerebellar Ataxia (SDCA2).
Retinoschisin is linked to retinal Na/K-ATPase signaling and localization.
Plössl K, Straub K, Schmid V, Strunz F, Wild J, Merkl R, Weber BHF, Friedrich U
PloS one 2019;14(5):e0216320
PloS one 2019;14(5):e0216320
Glioma malignancy is linked to interdependent and inverse AMOG and L1 adhesion molecule expression.
Jiang Q, Xie Q, Hu C, Yang Z, Huang P, Shen H, Schachner M, Zhao W
BMC cancer 2019 Sep 12;19(1):911
BMC cancer 2019 Sep 12;19(1):911
A SINE Insertion in ATP1B2 in Belgian Shepherd Dogs Affected by Spongy Degeneration with Cerebellar Ataxia (SDCA2).
Mauri N, Kleiter M, Dietschi E, Leschnik M, Högler S, Wiedmer M, Dietrich J, Henke D, Steffen F, Schuller S, Gurtner C, Stokar-Regenscheit N, O'Toole D, Bilzer T, Herden C, Oevermann A, Jagannathan V, Leeb T
G3 (Bethesda, Md.) 2017 Aug 7;7(8):2729-2737
G3 (Bethesda, Md.) 2017 Aug 7;7(8):2729-2737
Retinoschisin is linked to retinal Na/K-ATPase signaling and localization.
Plössl K, Royer M, Bernklau S, Tavraz NN, Friedrich T, Wild J, Weber BHF, Friedrich U
Molecular biology of the cell 2017 Aug 1;28(16):2178-2189
Molecular biology of the cell 2017 Aug 1;28(16):2178-2189
No comments: Submit comment
Supportive validation
- Submitted by
- Invitrogen Antibodies (provider)
- Main image

- Experimental details
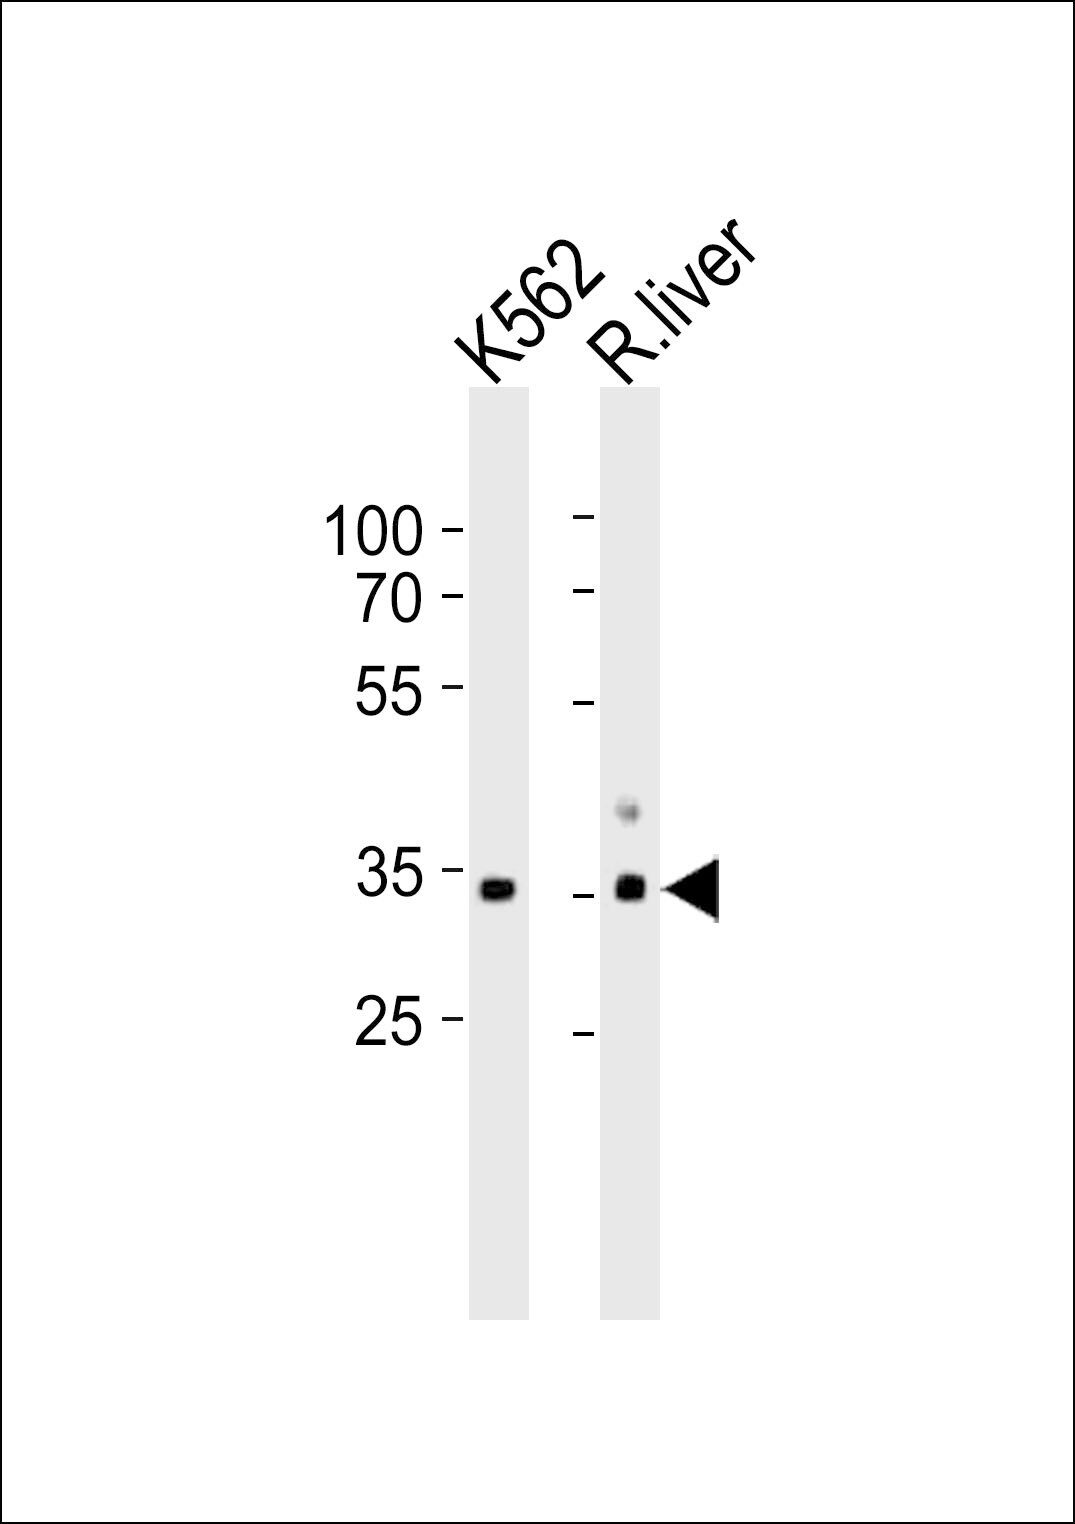
- Western blot analysis of ATP1B2 in K562 cell line and rat liver tissue lysate (from left to right). Samples were incubated with ATP1B2 polyclonal antibody (Product # PA5-26279) using a dilution of 1:1,000 followed by goat anti-rabbit IgG H&L (HRP) at a dilution of 1:10,000. Lysates at 35 µg per lane.
Supportive validation
- Submitted by
- Invitrogen Antibodies (provider)
- Main image
- Experimental details
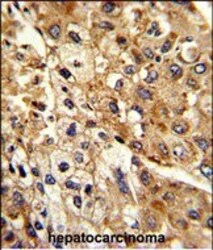
- Immunohistochemistry analysis of ATP1B2 in formalin-fixed and paraffin-embedded human hepatocarcinoma. Samples were incubated with ATP1B2 polyclonal antibody (Product # PA5-26279) which was peroxidase-conjugated to the secondary antibody, followed by DAB staining. This data demonstrates the use of this antibody for immunohistochemistry; clinical relevance has not been evaluated.

Supportive validation
- Submitted by
- Invitrogen Antibodies (provider)
- Main image
- Experimental details
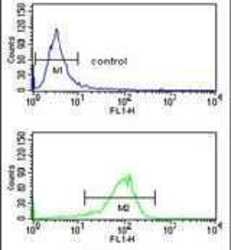
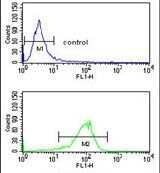
- Flow cytometry analysis of K562 cells using an ATP1B2 polyclonal antibody (Product # PA5-26279) (bottom) compared to a negative control cell (top) at a dilution of 1:10-50, followed by a FITC-conjugated goat anti-rabbit antibody
- Submitted by
- Invitrogen Antibodies (provider)
- Main image

- Experimental details
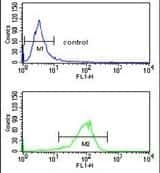
- Flow cytometry analysis of K562 cells using an ATP1B2 polyclonal antibody (Product # PA5-26279) (bottom) compared to a negative control cell (top) at a dilution of 1:10-50, followed by a FITC-conjugated goat anti-rabbit antibody
- Submitted by
- Invitrogen Antibodies (provider)
- Main image
- Experimental details
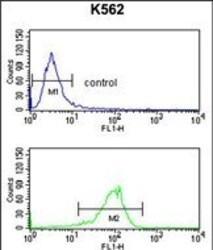
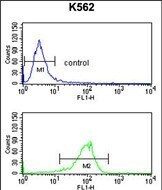
- Flow cytometry of ATP1B2 in K562 cells (bottom histogram). Samples were incubated with ATP1B2 polyclonal antibody (Product # PA5-26279) followed by FITC-conjugated goat-anti-rabbit secondary antibody. Negative control cell (top histogram).
Supportive validation
- Submitted by
- Invitrogen Antibodies (provider)
- Main image
- Experimental details
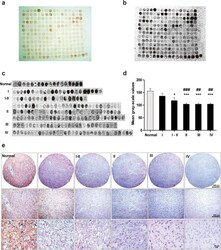
- Fig. 1 AMOG expression as assayed in a normal human brain and glioma tissue microarray. a Immunostaining of AMOG in the microarray containing both tumor-adjacent normal human brain and glioma tissues graded from I to IV. b Gray-scale image showing AMOG expression in all samples. c Samples from the tissue microarray were pooled in accordance with the WHO grading system. d Data were collected from all the samples arrayed in the slides for quantification. Values are expressed as means +- SEM. * p < 0.05, compared with normal brain tissues; # p < 0.05, compared with grade I glioma tissues; one-way ANOVA with Tukey's post-hoc test. Samples of normal brain tissue ( n = 18), pilocytic astrocytoma (WHO grade I, n = 23), WHO grade I-II ( n = 19), diffuse astrocytoma (WHO grade II, n = 85), anaplastic astrocytoma (WHO grade III, n = 27), and glioblastoma (WHO grade IV, n = 31). e Representative AEC-based AMOG immunostained images in normal human brain tissues and different grades of human glioma tissues. Photographs were taken with a digital microscope. Scale bars, upper panels 500 mum, middle panels 200 mum, and lower panels 20 mum
- Submitted by
- Invitrogen Antibodies (provider)
- Main image
- Experimental details
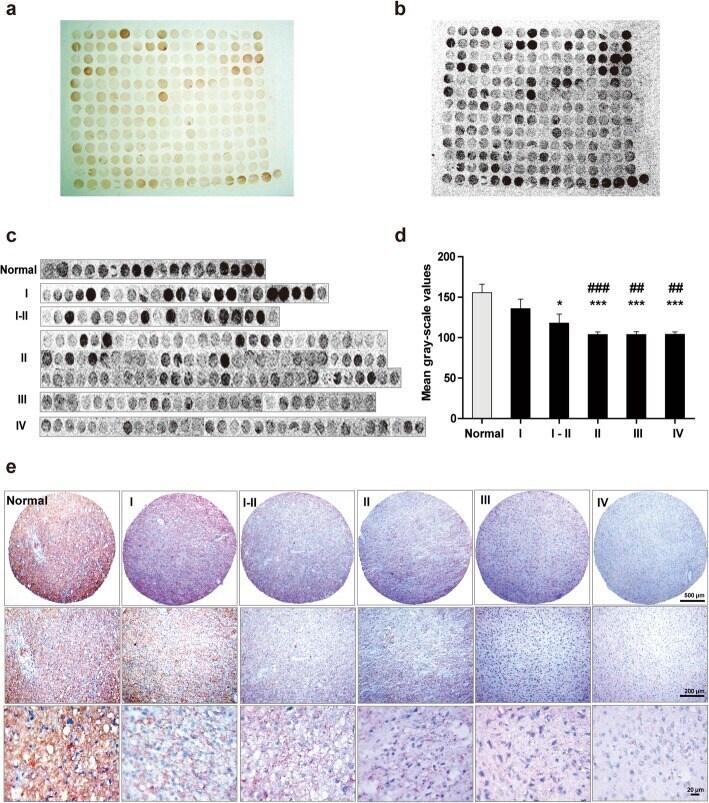
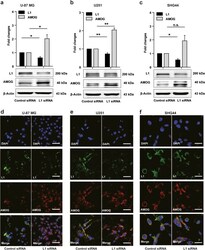
- Fig. 3 Reduced L1 expression leads to elevated AMOG expression. a-c Western blot analysis of L1 and AMOG expression in U-87 MG ( a ), U251 ( b ), and SHG44 ( c ) cells after treatment with L1 siRNA at 5 nM. Mean values +- SEM from 4 independent experiments are presented. (* p < 0.05, ** p < 0.01, *** p < 0.001 vs. Control siRNA, independent Student's t -test). d-f Representative images of double immunofluorescence staining of L1 and AMOG in response to L1 siRNA at 5 nM in U-87 MG ( d ), U251 ( e ) and SHG44 ( f ) cells. Scale bars = 50 mum
- Submitted by
- Invitrogen Antibodies (provider)
- Main image
- Experimental details
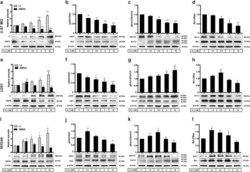
- Fig. 5 L1 reduces AMOG expression and suppresses apoptosis . Western blot analysis of L1 and AMOG ( a, e, i ), phosphorylation levels of Akt1 ( b, f, j ) and Erk1/2 ( c, g, k ), and ratio of Bcl-2/Bax ( d, h, l ) in U-87 MG, U251 and SHG44 cells after treatment with recombinant L1 (rL1) at concentrations between 0 to 10 nM. Mean values +- SEM are from 4 independent experiments; one-way ANOVA with Tukey's post-hoc test. * p < 0.05, ** p < 0.01, and *** p < 0.001 versus the Control siRNA group

- Submitted by
- Invitrogen Antibodies (provider)
- Main image

- Experimental details
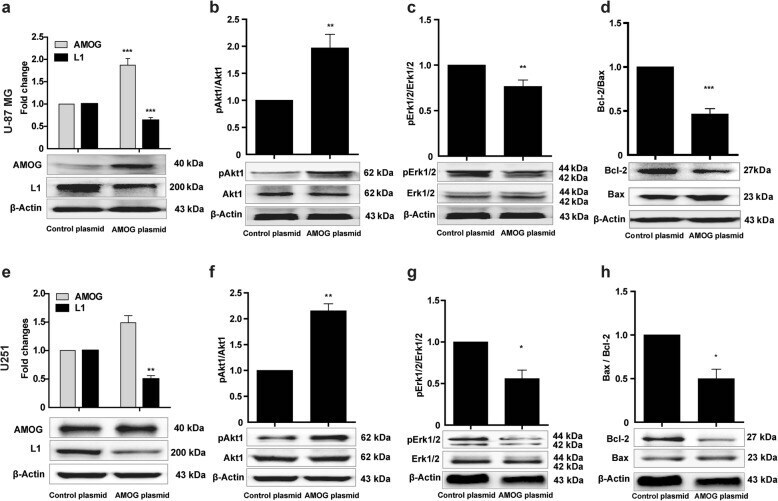
- Fig. 6 Over-expression of AMOG affects L1 expression and apoptosis-related signaling pathways. Western blot analysis of expression levels of L1 and AMOG ( a, e ), phosphorylated Akt1 ( b, f ) and Erk1/2 ( c and g ), and ratio of Bcl-2/Bax ( d, h ) in U-87 MG and U251 cells after transfection with an AMOG expression plasmid. Mean values +- SEM are from 3 independent experiments; independent Student's t -test (* p < 0.05, ** p < 0.01, and *** p < 0.001 versus the Control siRNA group)
- Submitted by
- Invitrogen Antibodies (provider)
- Main image
- Experimental details
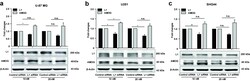
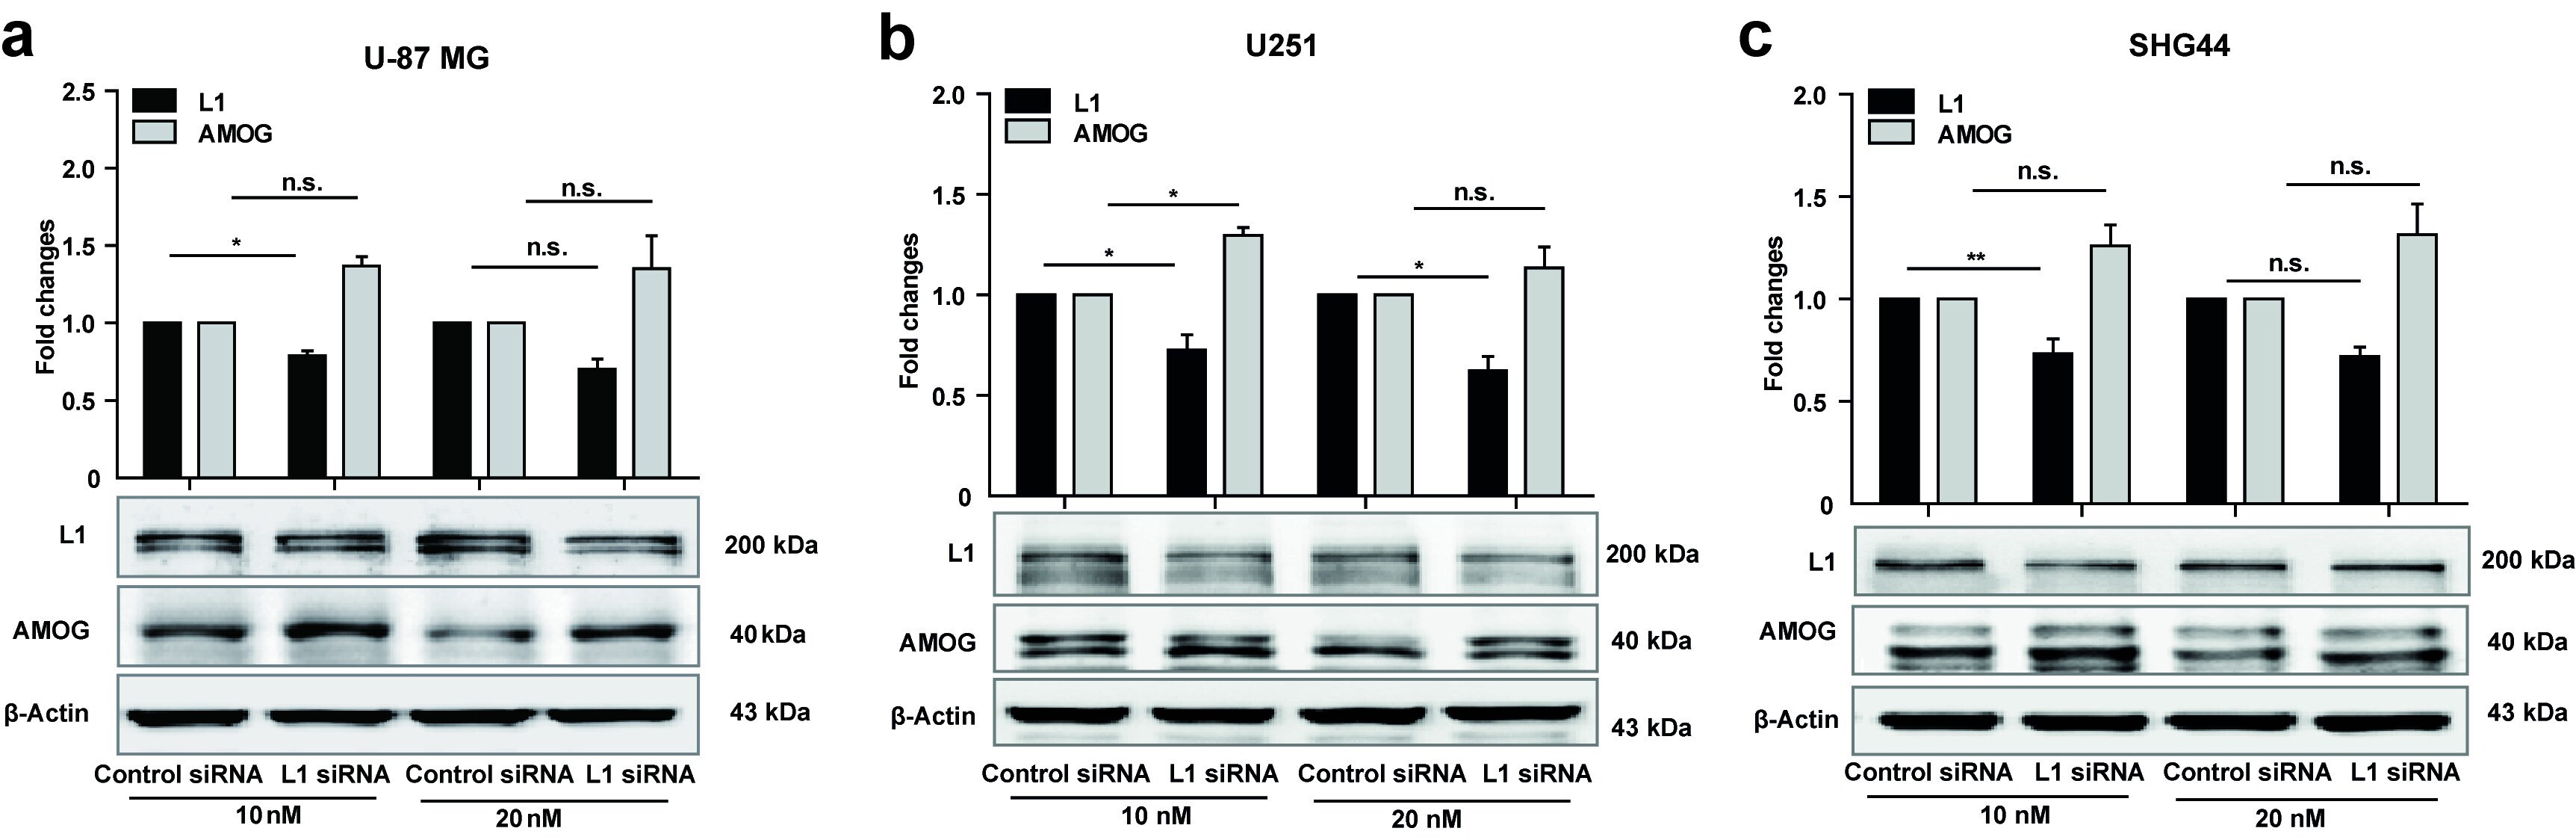
- Additional file 1: Figure S1. Reduction of L1 expression increases AMOG expression. Western blot analysis of L1 and AMOG expression in U-87 MG ( a ), U251 ( b ), and SHG44 ( c ) cells after treatment with L1 siRNA at 10 and 20 nM. Mean values +- SEM are from 4 independent experiments. (* p < 0.05, ** p < 0.01, *** p < 0.001 vs. Control siRNA, independent Student's t -test). (TIF 2142 kb)
- Submitted by
- Invitrogen Antibodies (provider)
- Main image
- Experimental details
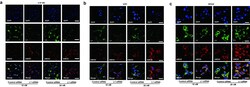
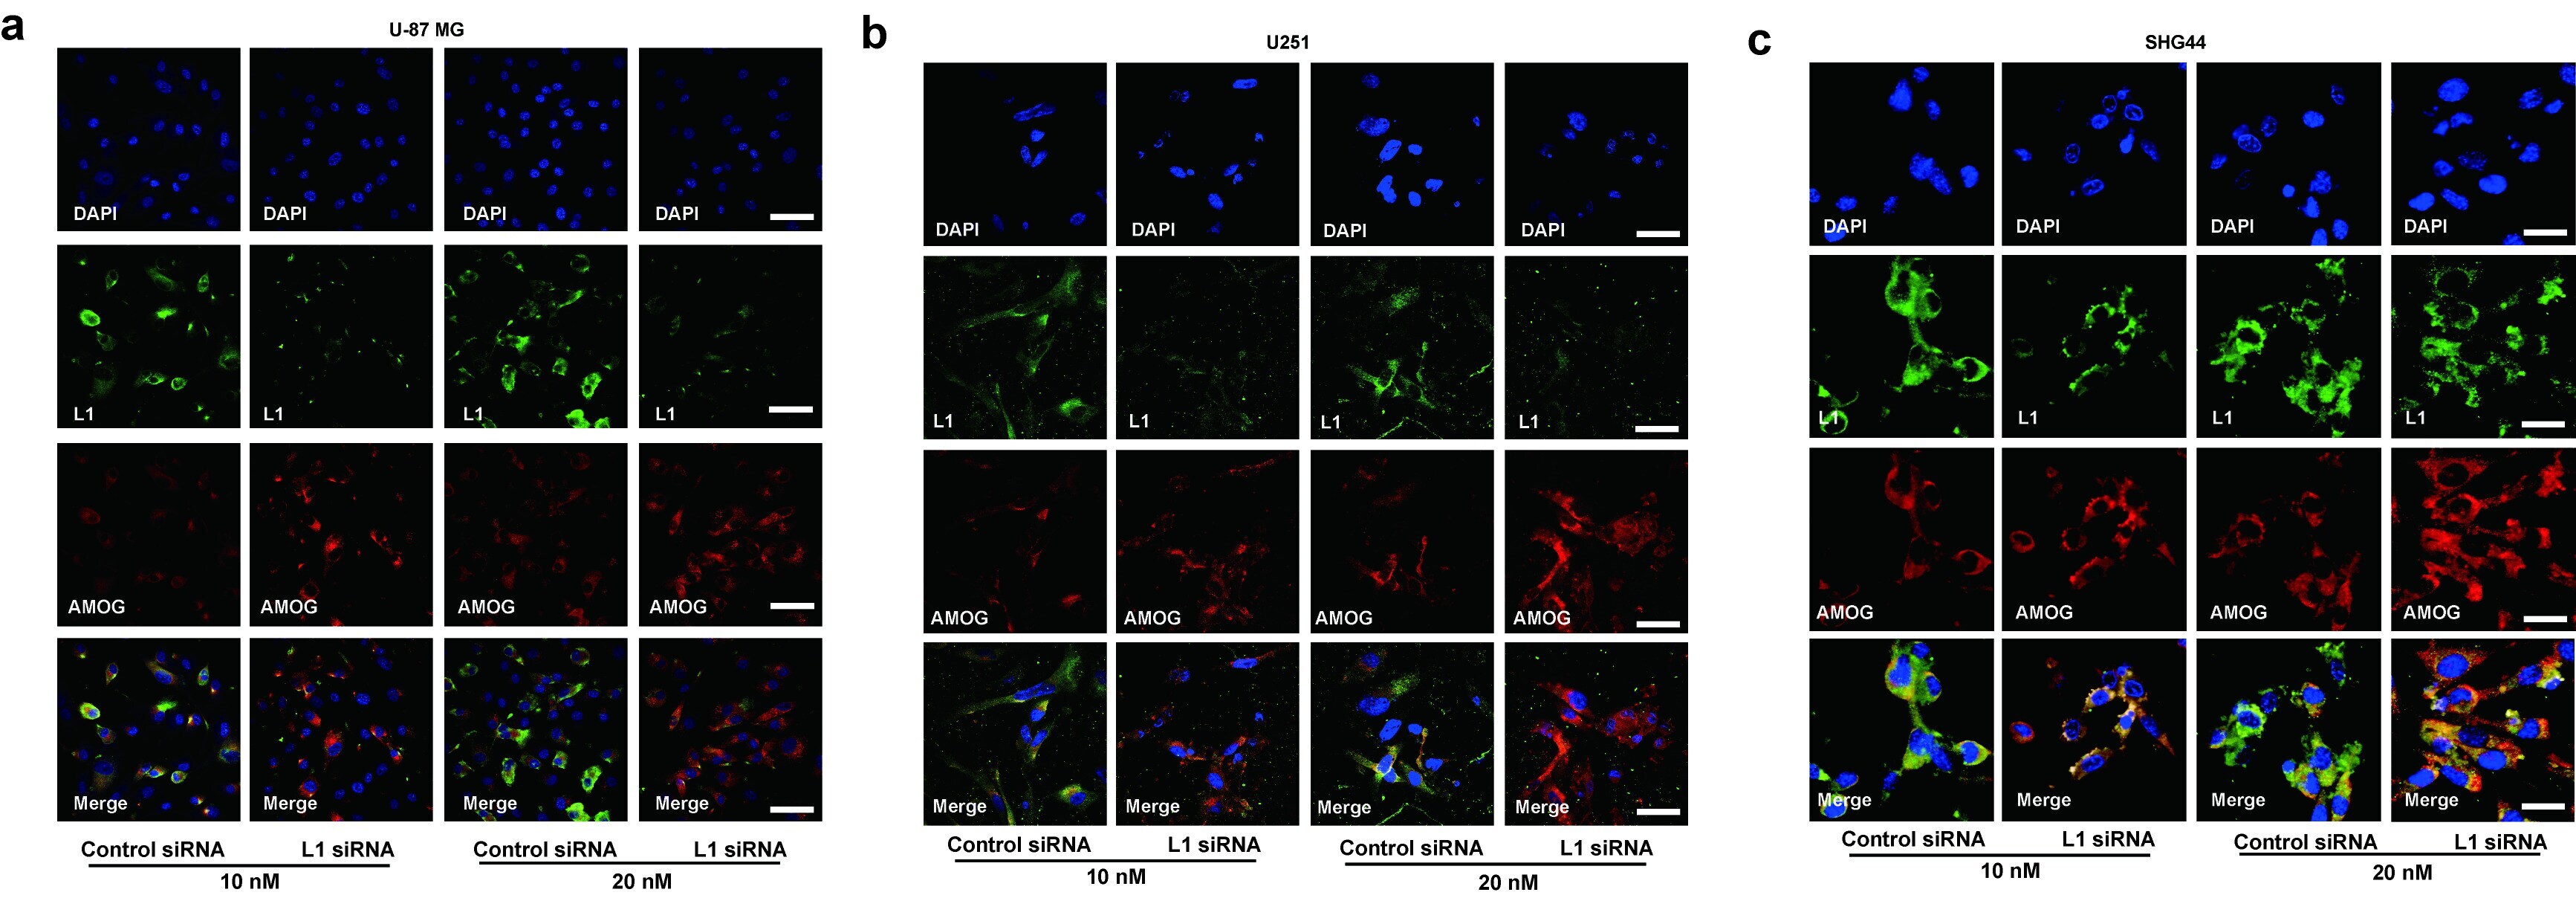
- Additional file 2: Figure S2. Expression of AMOG in relation to L1. Representative images of double immunofluorescence staining of L1 and AMOG after treatment with L1 siRNA at 10 and 20 nM in U-87 MG ( a ), U251 ( b ) and SHG44 ( c ) cells. Scale bars = 50 mum. (TIF 3736 kb)
- Submitted by
- Invitrogen Antibodies (provider)
- Main image
- Experimental details
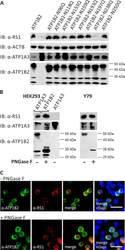
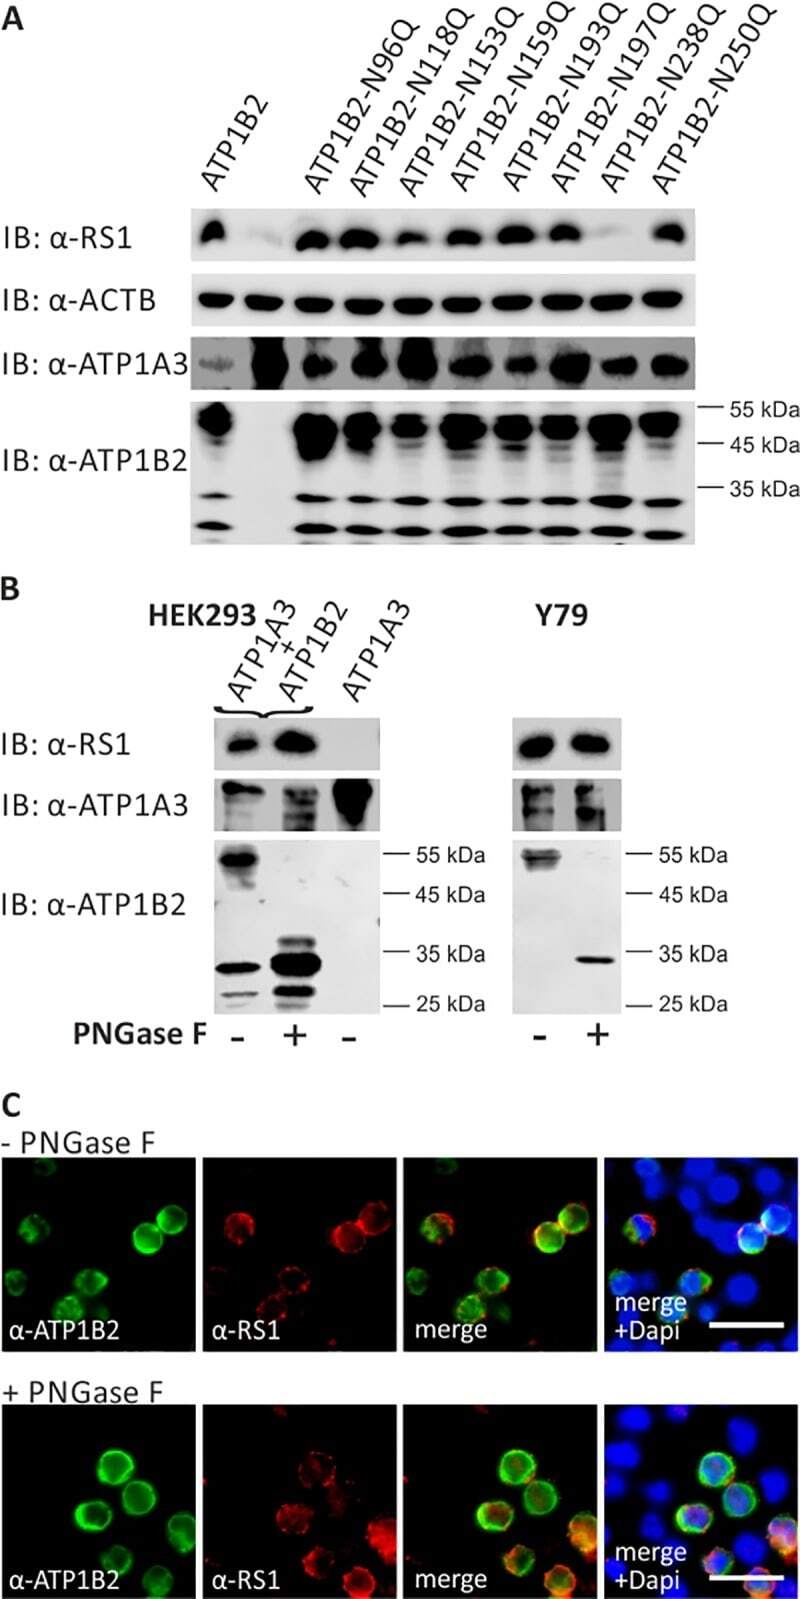
- Fig 2 Retinoschisin binding in dependence of ATP1B2 glycosylation. (A) HEK293 cells were co-transfected with expression constructs for ATP1A3 and expression constructs for ATP1B2 mutants deficient in each one glycosylation site (ATP1B2-N96Q, -N118Q, -N153Q, -N159Q, -N193Q, -N197Q, -N238Q, and -N250Q). 48 h after transfection, cells were incubated with recombinant retinoschisin for 1 h, followed by intensive washing. Cells transfected with only ATP1A3 expression constructs served as a negative control, cells co-transfected with expression constructs for ATP1A3 and for normal ATP1B2 served as a positive control in the retinoschisin binding assay [ 13 ]. Heterologous protein expression as well as retinoschisin binding was investigated by Western blot analyses with antibodies against retinoschisin, ATP1A3, and ATP1B2. The ACTB staining served as loading control. (B) Enriched membrane fractions from HEK293 cells transfected with ATP1A3 and ATP1B2 expression constructs and Y79 cells were subjected to enzymatic deglycosylation using PNGase F. A control sample was subjected to the same treatment, but without PNGase F. Subsequently, membrane fractions were incubated with recombinant retinoschisin for 1 h, followed by intensive washing. Retinoschisin binding, (heterologous) Na/K-ATPase expression, and ATP1B2 deglycosylation were investigated by Western blot analyses with antibodies against retinoschisin, ATP1A3, and ATP1B2. Membranes from HEK293 cells transfected with only ATP1A3 e
- Submitted by
- Invitrogen Antibodies (provider)
- Main image
- Experimental details
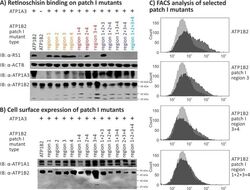
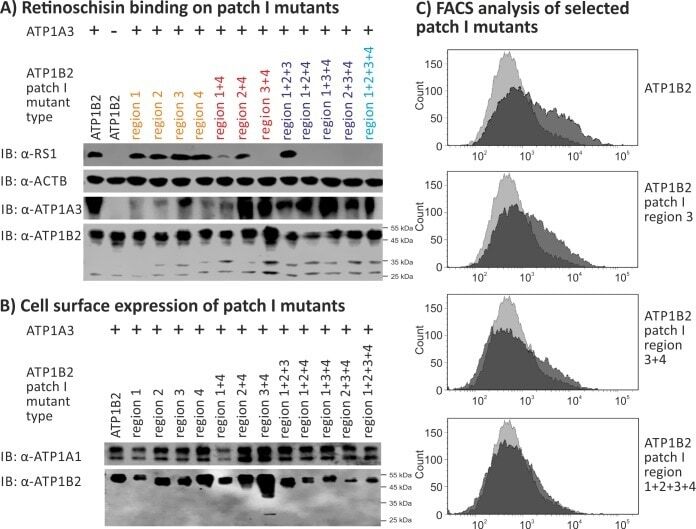
- Fig 4 Retinoschisin binding to ATP1B2 patch I mutants. HEK293 cells were transfected with expression constructs for ATP1A3 in combination with expression constructs for different ATP1B2 variants mutated in patch I regions depicted within the figure. (A) 48 h after transfection, cells were subjected to recombinant retinoschisin for 1 h, followed by intensive washing. Cells transfected with expression constructs for only ATP1B2 served as a negative control, cells transfected with expression constructs for ATP1A3 and normal ATP1B2 served as a positive control in the retinoschisin binding assay [ 13 ]. Heterologous protein expression as well as retinoschisin binding was investigated by Western blot analyses with antibodies against retinoschisin, ATP1A3, and ATP1B2. The ACTB staining served as loading control. (B) 48 h after transfection, cell surface proteins were biotinylated, purified by streptavidin affinity chromatography and analysed by Western blotting using antibodies against ATP1B2. The ATP1A1 immunoblot was performed as loading control. (C) 48 h after transfection, cells were subjected to FACS analyses applying an anti-ATP1B2 antibody. Representative histograms of cells transfected with selected ATP1B2 patch I mutants are given in this figure. Light grey: histogram of untransfected HEK293 cells depicting unspecific background signals. Dark grey: histogram of transfected HEK293 cells.
- Submitted by
- Invitrogen Antibodies (provider)
- Main image

- Experimental details
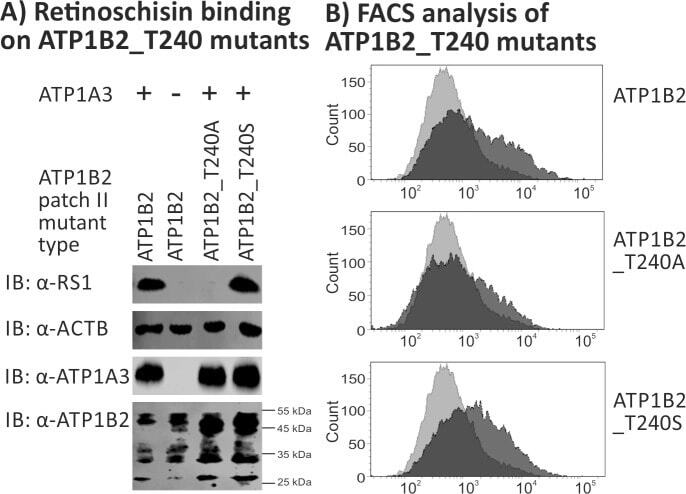
- Fig 6 Retinoschisin binding to ATP1B2_T240A and ATP1B2_T240S. HEK293 cells were transfected with expression constructs for ATP1A3 in combination with expression constructs for ATP1B2_T240A and ATP1B2_T240S. (A) 48 h after transfection, cells were subjected to recombinant retinoschisin for 1 h, followed by intensive washing. Cells transfected with expression constructs for only ATP1B2 served as a negative control, cells transfected with expression constructs for ATP1A3 and normal ATP1B2 served as a positive control in the retinoschisin binding assay [ 13 ]. Heterologous protein expression as well as retinoschisin binding was investigated by Western blot analyses with antibodies against retinoschisin, ATP1A3, and ATP1B2. The ACTB staining served as loading control. (B) 48 h after transfection, cells were subjected to FACS analyses applying an anti-ATP1B2 antibody, representative histograms are given in this figure. Light grey: histogram of untransfected HEK293 cells depicting unspecific background signals. Dark grey: histogram of transfected HEK293 cells.