 Explore
 Validate
 Learn
Learn Western blot
 Immunocytochemistry
Antibody data
- Antibody Data
- Antigen structure
- References [9]
- Comments [0]
- Validations
- Immunocytochemistry [2]
- Immunohistochemistry [3]
- Other assay [8]
Submit
Validation data
Reference
Comment
Report error
- Product number
- PA5-37367 - Provider product page

- Provider
- Invitrogen Antibodies
- Product name
- HMGCR Polyclonal Antibody
- Antibody type
- Polyclonal
- Antigen
- Recombinant full-length protein
- Description
- This antibody detects endogenous protein at a molecular weight of 97 kDa. Purity is >95% by SDS-PAGE.
- Reactivity
- Human, Mouse, Rat
- Host
- Rabbit
- Isotype
- IgG
- Vial size
- 100 μL
- Concentration
- 1 mg/mL
- Storage
- Store at 4°C short term. For long term storage, store at -20°C, avoiding freeze/thaw cycles.
Submitted references Cholesterol biosynthesis defines oligodendrocyte precursor heterogeneity between brain and spinal cord.
Dyrk1b promotes hepatic lipogenesis by bypassing canonical insulin signaling and directly activating mTORC2 in mice.
TDP-43 mediates SREBF2-regulated gene expression required for oligodendrocyte myelination.
A Retrospective Hospital-Based Study of HMGCR Expression in HER2 IHC 2+ and 3+ Breast Cancer.
GPR146 Deficiency Protects against Hypercholesterolemia and Atherosclerosis.
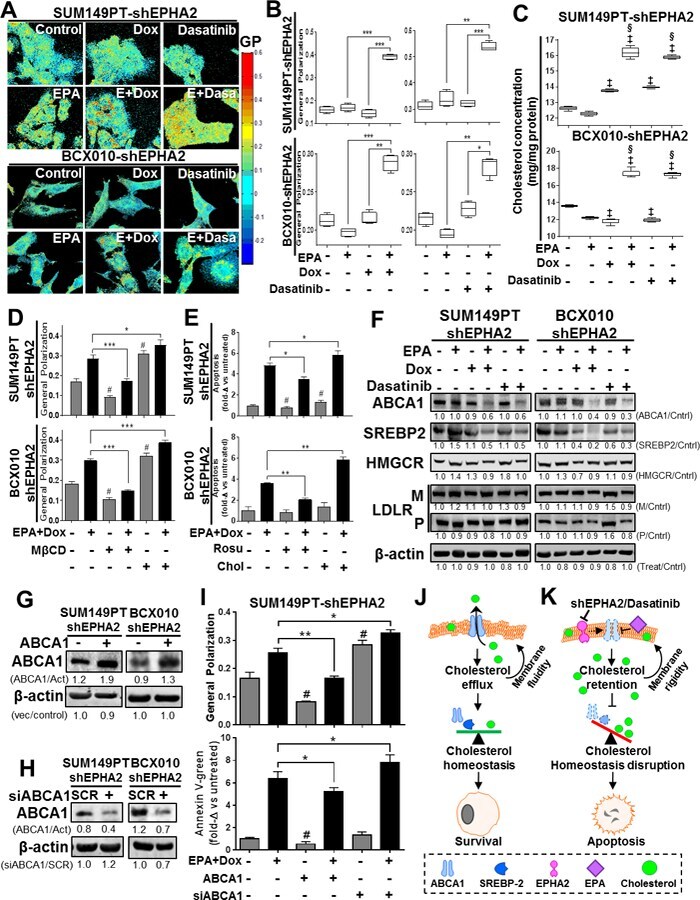
Eicosapentaenoic acid in combination with EPHA2 inhibition shows efficacy in preclinical models of triple-negative breast cancer by disrupting cellular cholesterol efflux.
Lipid and glucose metabolism in hepatocyte cell lines and primary mouse hepatocytes: a comprehensive resource for in vitro studies of hepatic metabolism.
Concomitant attenuation of HMG-CoA reductase expression potentiates the cancer cell growth-inhibitory effect of statins and expands their efficacy in tumor cells with epithelial characteristics.
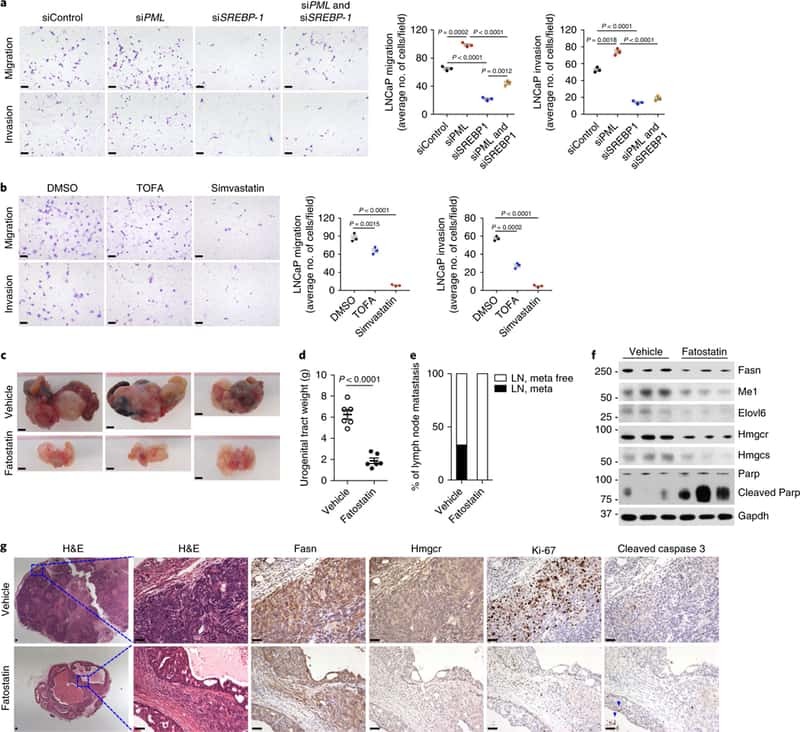
An aberrant SREBP-dependent lipogenic program promotes metastatic prostate cancer.
Khandker L, Jeffries MA, Chang YJ, Mather ML, Evangelou AV, Bourne JN, Tafreshi AK, Ornelas IM, Bozdagi-Gunal O, Macklin WB, Wood TL
Cell reports 2022 Mar 1;38(9):110423
Cell reports 2022 Mar 1;38(9):110423
Dyrk1b promotes hepatic lipogenesis by bypassing canonical insulin signaling and directly activating mTORC2 in mice.
Bhat N, Narayanan A, Fathzadeh M, Kahn M, Zhang D, Goedeke L, Neogi A, Cardone RL, Kibbey RG, Fernandez-Hernando C, Ginsberg HN, Jain D, Shulman GI, Mani A
The Journal of clinical investigation 2022 Feb 1;132(3)
The Journal of clinical investigation 2022 Feb 1;132(3)
TDP-43 mediates SREBF2-regulated gene expression required for oligodendrocyte myelination.
Ho WY, Chang JC, Lim K, Cazenave-Gassiot A, Nguyen AT, Foo JC, Muralidharan S, Viera-Ortiz A, Ong SJM, Hor JH, Agrawal I, Hoon S, Arogundade OA, Rodriguez MJ, Lim SM, Kim SH, Ravits J, Ng SY, Wenk MR, Lee EB, Tucker-Kellogg G, Ling SC
The Journal of cell biology 2021 Sep 6;220(9)
The Journal of cell biology 2021 Sep 6;220(9)
A Retrospective Hospital-Based Study of HMGCR Expression in HER2 IHC 2+ and 3+ Breast Cancer.
Mohamed M, Mohd Nafi SN, Jaafar H, Paiman NM
Asian Pacific journal of cancer prevention : APJCP 2021 Jul 1;22(7):2043-2047
Asian Pacific journal of cancer prevention : APJCP 2021 Jul 1;22(7):2043-2047
GPR146 Deficiency Protects against Hypercholesterolemia and Atherosclerosis.
Yu H, Rimbert A, Palmer AE, Toyohara T, Xia Y, Xia F, Ferreira LMR, Chen Z, Chen T, Loaiza N, Horwitz NB, Kacergis MC, Zhao L, BIOS Consortium, Soukas AA, Kuivenhoven JA, Kathiresan S, Cowan CA
Cell 2019 Nov 27;179(6):1276-1288.e14
Cell 2019 Nov 27;179(6):1276-1288.e14
Eicosapentaenoic acid in combination with EPHA2 inhibition shows efficacy in preclinical models of triple-negative breast cancer by disrupting cellular cholesterol efflux.
Torres-Adorno AM, Vitrac H, Qi Y, Tan L, Levental KR, Fan YY, Yang P, Chapkin RS, Eckhardt BL, Ueno NT
Oncogene 2019 Mar;38(12):2135-2150
Oncogene 2019 Mar;38(12):2135-2150
Lipid and glucose metabolism in hepatocyte cell lines and primary mouse hepatocytes: a comprehensive resource for in vitro studies of hepatic metabolism.
Nagarajan SR, Paul-Heng M, Krycer JR, Fazakerley DJ, Sharland AF, Hoy AJ
American journal of physiology. Endocrinology and metabolism 2019 Apr 1;316(4):E578-E589
American journal of physiology. Endocrinology and metabolism 2019 Apr 1;316(4):E578-E589
Concomitant attenuation of HMG-CoA reductase expression potentiates the cancer cell growth-inhibitory effect of statins and expands their efficacy in tumor cells with epithelial characteristics.
Ishikawa T, Hosaka YZ, Beckwitt C, Wells A, Oltvai ZN, Warita K
Oncotarget 2018 Jun 29;9(50):29304-29315
Oncotarget 2018 Jun 29;9(50):29304-29315
An aberrant SREBP-dependent lipogenic program promotes metastatic prostate cancer.
Chen M, Zhang J, Sampieri K, Clohessy JG, Mendez L, Gonzalez-Billalabeitia E, Liu XS, Lee YR, Fung J, Katon JM, Menon AV, Webster KA, Ng C, Palumbieri MD, Diolombi MS, Breitkopf SB, Teruya-Feldstein J, Signoretti S, Bronson RT, Asara JM, Castillo-Martin M, Cordon-Cardo C, Pandolfi PP
Nature genetics 2018 Feb;50(2):206-218
Nature genetics 2018 Feb;50(2):206-218
No comments: Submit comment
Supportive validation
- Submitted by
- Invitrogen Antibodies (provider)
- Main image

- Experimental details
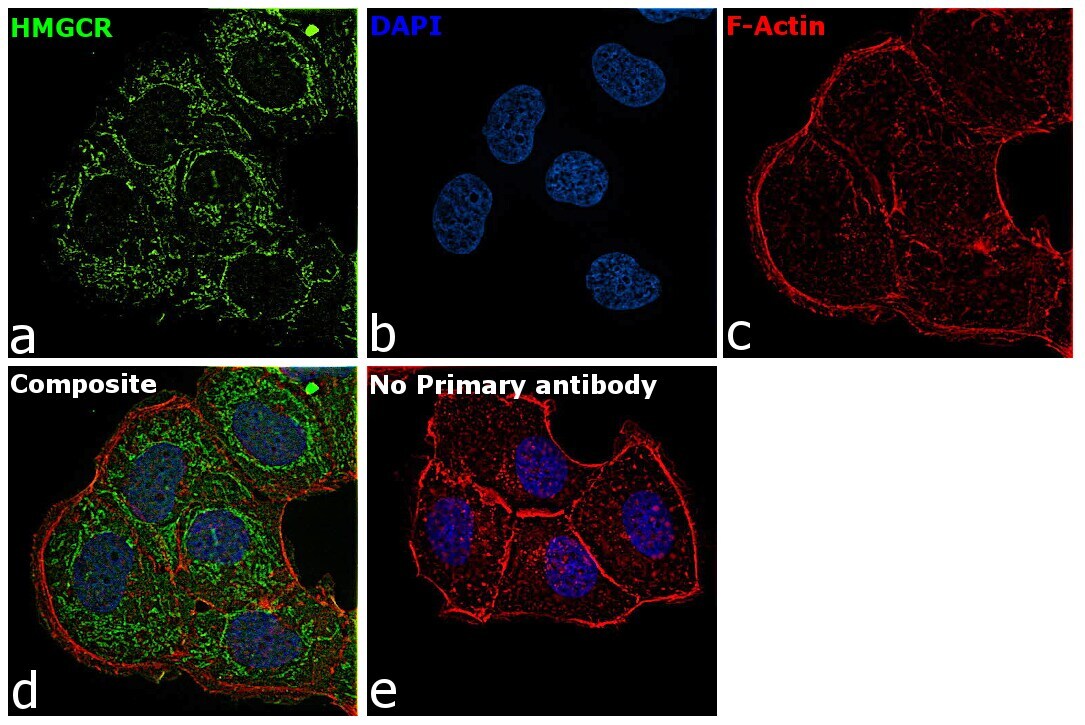
- Immunofluorescence analysis of HMGCR was performed using 70% confluent log phase T-47D cells. The cells were fixed with 4% paraformaldehyde for 10 minutes, permeabilized with 0.1% Triton™ X-100 for 15 minutes, and blocked with 2% BSA for 45 minutes at room temperature. The cells were labeled with HMGCR Polyclonal Antibody (Product # PA5-37367) at 1:200 dilution in 0.1% BSA, incubated at 4 degree celsius overnight and then labeled with Donkey anti-Rabbit IgG (H+L) Highly Cross-Adsorbed Secondary Antibody, Alexa Fluor Plus 488 (Product # A32790), (1:2000), for 45 minutes at room temperature (Panel a: Green). Nuclei (Panel b:Blue) were stained with ProLong™ Diamond Antifade Mountant with DAPI (Product # P36962). F-actin (Panel c: Red) was stained with Rhodamine Phalloidin (Product # R415, 1:300). Panel d represents the merged image showing ER and peroxisomal membrane localization. Panel e represents control cells with no primary antibody to assess background. The images were captured at 60X magnification.

- Submitted by
- Invitrogen Antibodies (provider)
- Main image

- Experimental details
- Immunofluorescence analysis of HMGCR was performed using 70% confluent log phase T-47D cells. The cells were fixed with 4% paraformaldehyde for 10 minutes, permeabilized with 0.1% Triton™ X-100 for 15 minutes, and blocked with 2% BSA for 45 minutes at room temperature. The cells were labeled with HMGCR Polyclonal Antibody (Product # PA5-37367) at 1:200 dilution in 0.1% BSA, incubated at 4 degree celsius overnight and then labeled with Donkey anti-Rabbit IgG (H+L) Highly Cross-Adsorbed Secondary Antibody, Alexa Fluor Plus 488 (Product # A32790), (1:2000), for 45 minutes at room temperature (Panel a: Green). Nuclei (Panel b:Blue) were stained with ProLong™ Diamond Antifade Mountant with DAPI (Product # P36962). F-actin (Panel c: Red) was stained with Rhodamine Phalloidin (Product # R415, 1:300). Panel d represents the merged image showing ER and peroxisomal membrane localization. Panel e represents control cells with no primary antibody to assess background. The images were captured at 60X magnification.
Supportive validation
- Submitted by
- Invitrogen Antibodies (provider)
- Main image
- Experimental details
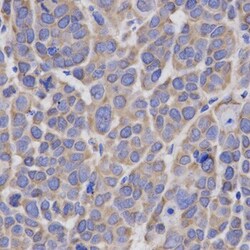
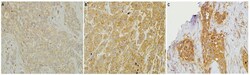
- Immunohistochemistry analysis of HMGCR in paraffin-embedded mouse liver cancer tissue. Samples were incubated with HMGCR polyclonal antibody (Product # PA5-37367).

- Submitted by
- Invitrogen Antibodies (provider)
- Main image
- Experimental details
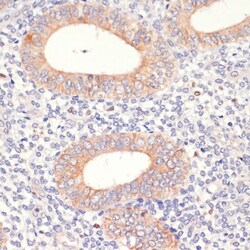
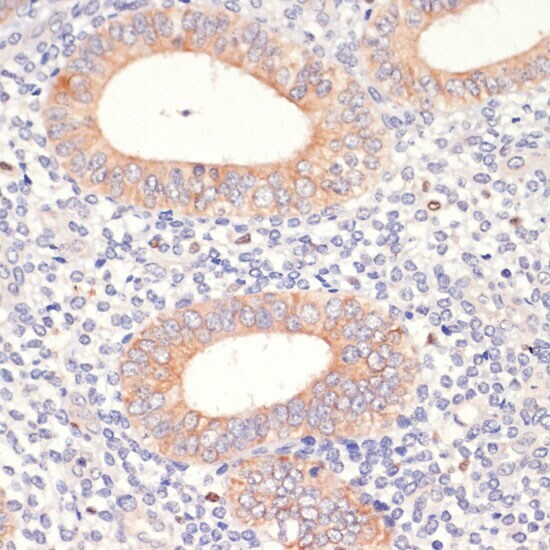
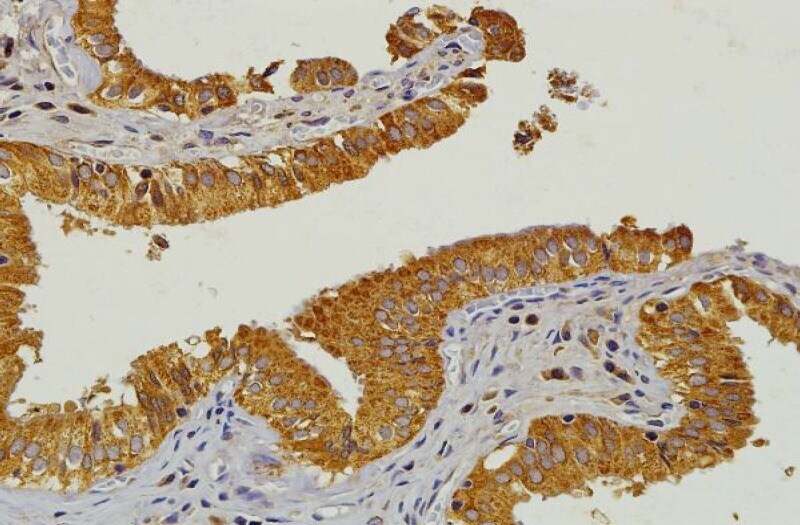
- Immunohistochemistry analysis of HMGCR in paraffin-embedded human uterine cancer. Samples were incubated with HMGCR polyclonal antibody (Product # PA5-37367) using a dilution of 1:200. Perform microwave antigen retrieval with 10 mM PBS buffer pH 7.2 before commencing with IHC staining protocol.
- Submitted by
- Invitrogen Antibodies (provider)
- Main image

- Experimental details
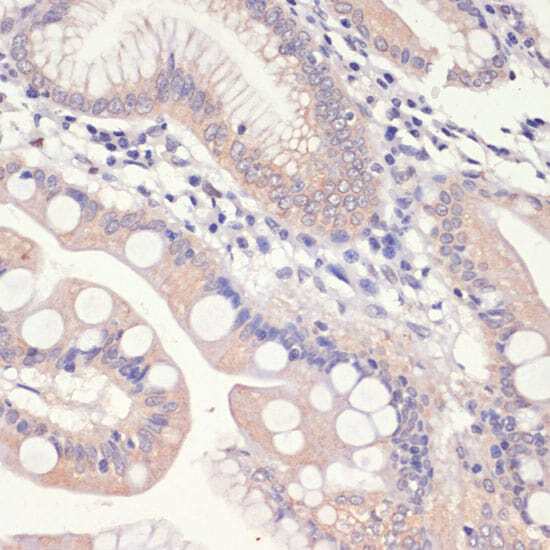
- Immunohistochemistry analysis of HMGCR in paraffin-embedded human small intestine. Samples were incubated with HMGCR polyclonal antibody (Product # PA5-37367) using a dilution of 1:200. Perform microwave antigen retrieval with 10 mM PBS buffer pH 7.2 before commencing with IHC staining protocol.
Supportive validation
- Submitted by
- Invitrogen Antibodies (provider)
- Main image

- Experimental details
- NULL
- Submitted by
- Invitrogen Antibodies (provider)
- Main image

- Experimental details
- Figure 4. Combination of EPA with EPHA2 inhibition modifies plasma cell membrane lipid composition, polarity and apoptosis induction via ABCA1 inhibition in TNBC cell lines. The effects of EPA in combination with EPHA2 inhibition on TNBC cell membranes were determined. ( A-B ) Cell membrane general polarization (GP, an indicator of polarity or rigidity) was determined in doxycycline (Dox)-inducible SUM149PT-shEPHA2 and BCX010-shEPHA2 cells treated with the indicated combinations of Dox, EPHA2 inhibitor dasatinib, and/or EPA. GP was determined by imaging (A) and quantification (B) . Higher GP values indicate greater cell membrane polarization/rigidity. ( C ) Cholesterol concentrations in the membrane fractions of Dox-inducible SUM149PT-shEPHA2 and BCX010-shEPHA2 cells treated with indicated combinations of Dox, dasatinib, and/or EPA were determined by cholesterol quantification assay. ( D-E ) Dox-inducible SUM149PT-shEPHA2 and BCX010-shEPHA2 cells were treated with combination Dox and EPA as indicated, with or without cellular cholesterol removal (by methyl-beta-cyclodextrin [MbetaCD] or rosuvastatin [Rosu]) or supplementation (Chol), and general polarization ( D ) and apoptosis ( E ) were quantified. Higher general polarization values indicate greater cell membrane polarization/rigidity. ( F ) Dox-inducible shEPHA2 cells were treated with EPA, Dox, dasatinib, or combinations and subjected to immunoblotting analysis of key cholesterol homeostasis-regulating proteins: ABCA1,
- Submitted by
- Invitrogen Antibodies (provider)
- Main image

- Experimental details
- Figure 1 IHC Staining for HMGCR in Normal Gallbladder Mucosa. Strong positive expression of HMGCR in gallbladder mucosa (positive control) manifested as brown staining in the cytoplasm. Original magnification, 200x
- Submitted by
- Invitrogen Antibodies (provider)
- Main image
- Experimental details
- Figure 2 HMGCR Expression in HER2 IHC Scores of 2+ and 3+ Breast Cancer. Representative patterns of HMGCR cytoplasmic staining intensity: (A) 1+, weak expression (B) 2+, moderate expression (C) 3+, strong expression. Original magnification, 200x

- Submitted by
- Invitrogen Antibodies (provider)
- Main image
- Experimental details
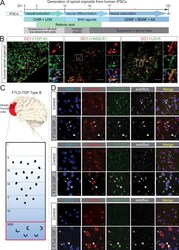
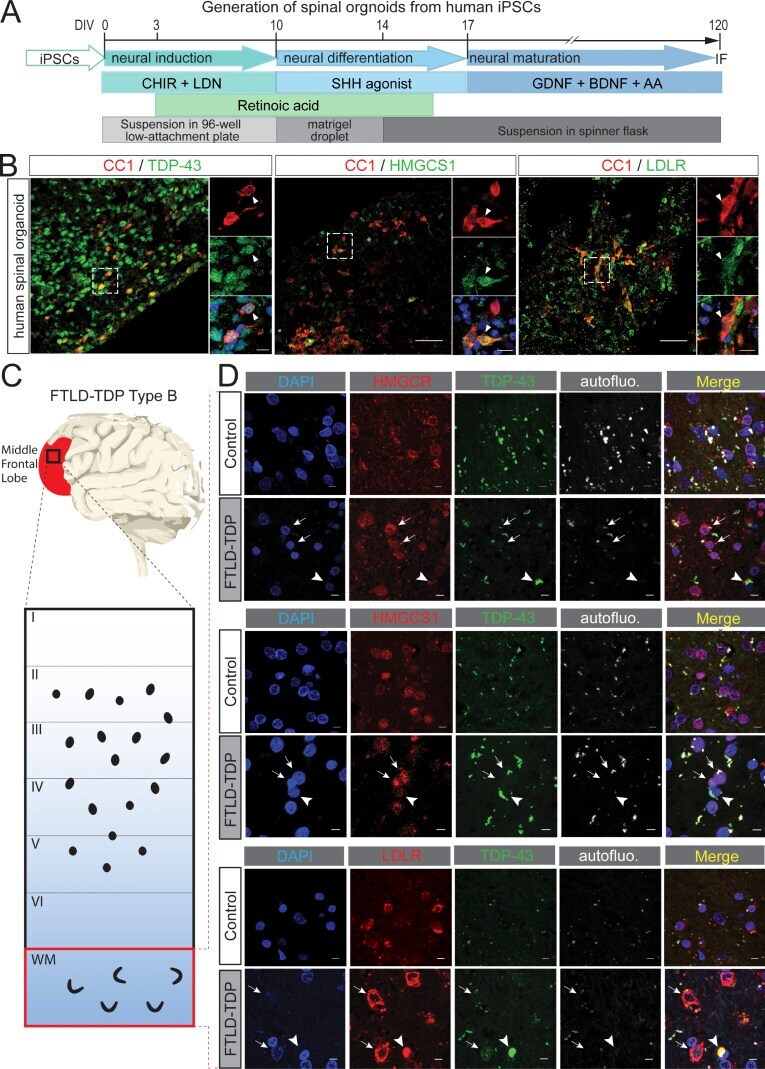
- Figure 9. Reduced expression of cholesterol metabolism in the glia from FTD-TDP patients. (A) Schematic illustration of spinal organoids differentiation from iPSC. (B) Confocal images of TDP-43 (left), HMGCS1 (middle), and HMGCR (right) with mature oligodendrocyte marker (CC1). DAPI nuclear stain in blue. Enlarged images show TDP-43, HMGCS1, and LDLR1 with oligodendrocytes. Scale bar = 50 um. For magnified images, scale bar = 10 um. (C) Schematic of post-mortem human FTLD-TDP tissues used for this study. (D) Double IF shows cytoplasmic TDP-43 inclusions (green) associated with white matter oligodendrocytes. Oligodendrocytes with TDP-43 inclusions appear to show a decrease in HMGCR (top, red, arrowheads) and HMGCS1 (middle, red, arrowheads) staining compared with other glial cells (arrows). LDLR colocalizes with TDP-43 inclusions (bottom, red). DAPI nuclear counterstain is blue. White image was taken using 561-nm excitation and corresponds to autofluorescence (autofluo.). Scale bar = 5 um. DIV, days in vitro; SHH, Sonic Hedgehog; AA, ascorbic acid; WM, white matter.
- Submitted by
- Invitrogen Antibodies (provider)
- Main image

- Experimental details
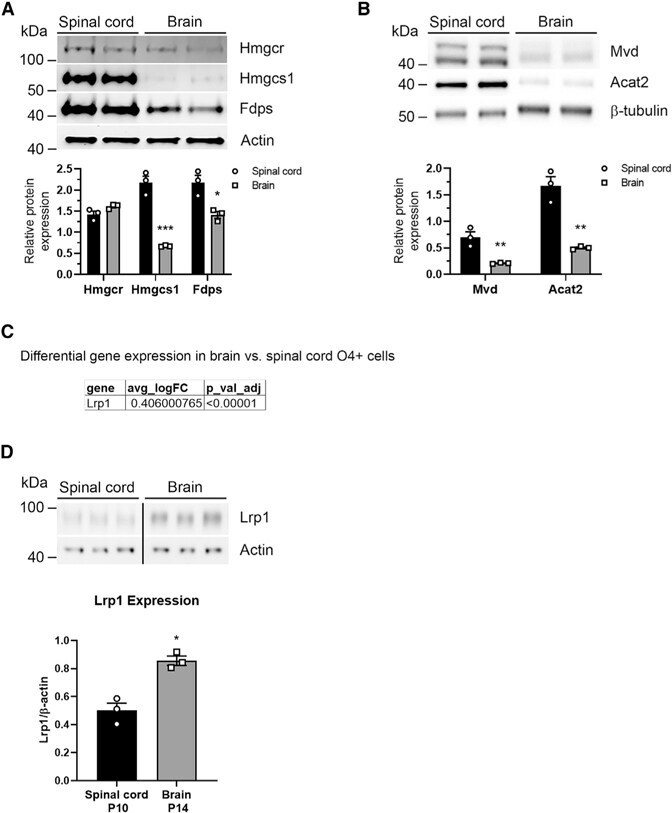
- Figure 2. Brain and spinal cord oligodendroglia have different dependence on cholesterol synthesis and uptake (A and B) Cell-autonomous cholesterol synthesis. Representative western blots showing expression of cholesterol biosynthesis enzymes HMGCR, HMGCS1, and FDPS (A) and MVD and ACAT2 (B) in O4 + cells from P10 spinal cord and P14 brain. Data were quantified from three animals/genotype/CNS region. Values are expressed as the mean +- SEM. (C and D) Receptor-mediated cholesterol uptake. Differential expression of Lrp1 extracted from single-cell data and presented as logFC in all brain clusters compared with all spinal cord clusters (C). Representative western blots showing expression of the LRP1 in O4 + cells from P10 spinal cord and P14 brain (D). Brain and spinal cord samples were run on the same western blot. For full image and additional time points see Figure S5D . Data were quantified from three animals/genotype/CNS region. Values are expressed as the mean +- SEM; *p < 0.05; **p < 0.01; ***p < 0.001.
- Submitted by
- Invitrogen Antibodies (provider)
- Main image

- Experimental details
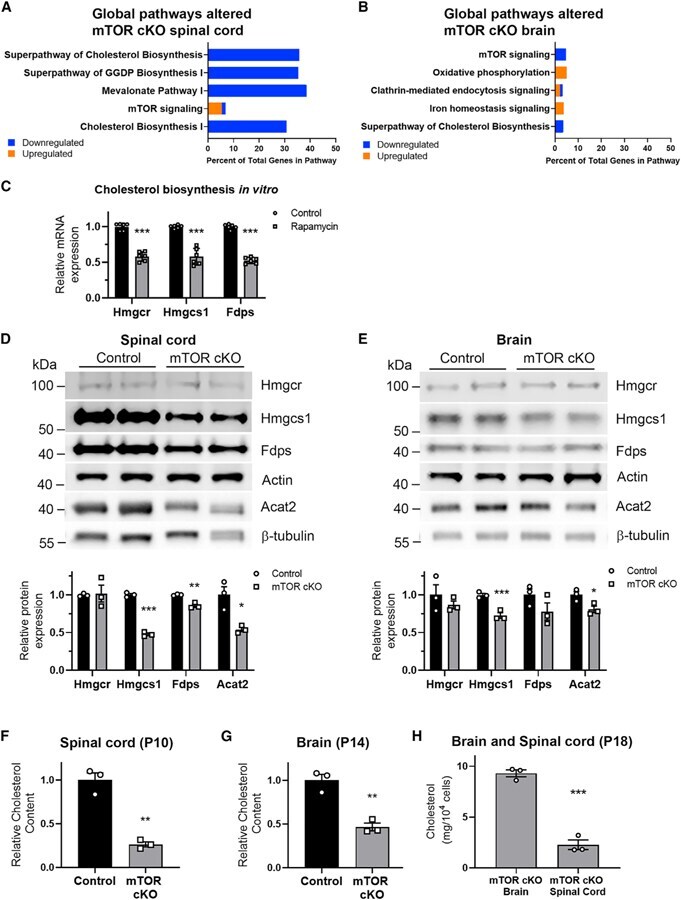
- Figure 4. mTOR is necessary for normal cholesterol biosynthesis in oligodendroglia (A and B) Top five pathways dysregulated in mTOR cKO spinal cord (A) and brain (B). IPA was done on genes differentially expressed in all mTOR cKO cells compared with all control cells; the most significantly altered pathways are shown. Blue, downregulated genes; orange, upregulated genes. (C) Inhibiting mTOR in vitro reduces mRNA expression of cholesterol biosynthesis genes. Expression of Hmgcr, Hmgcs1, and Fdps by qRT-PCR in primary rat OPCs differentiated for 3 days in the presence or absence of 10 nM rapamycin to inhibit mTOR is shown. Expression was normalized to Gapdh as a housekeeping gene and then normalized to control. Data represent six replicates over two independent OPC preps. Values are expressed as the mean +- SD. (D and E) Cholesterol biosynthesis enzymes are reduced in mTOR cKO spinal cord (D) and brain (E), with a greater impact in the spinal cord. Representative western blots show expression of HMGCR, HMGCS1, FDPS, and ACAT2 in control and mTOR cKO spinal cord (D) and brain (E) O4 + cells. HMGCR, HMGCS1, and FDPS expression was normalized first to beta-actin and then to control. ACAT2 expression was normalized first to beta-tubulin and then to control. Graphs present data from three animals/genotype/CNS region. Values are expressed as the mean +- SEM. (F, G, and H) mTOR cKO O4 + cells have lower cholesterol content. Total cholesterol measured in isolated O4 + cells from P10 sp
- Submitted by
- Invitrogen Antibodies (provider)
- Main image
- Experimental details
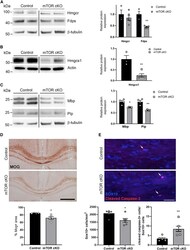
- Figure 5. Deficits in cholesterol biosynthesis persist at 8 weeks of age, myelin protein expression is downregulated, and brain oligodendroglia undergo apoptosis (A and B) Cholesterol biosynthesis enzymes are downregulated at 8 weeks in mTOR cKO corpus callosum. Representative western blots showing expression of HMGCR and FDPS (A) and HMGCS1 (B) in control and mTOR cKO microdissected corpus collosum. Graphs present data from three control and five mTOR cKO animals. (C) Representative western blots showing expression of MBP and PLP in control and mTOR cKO microdissected corpus collosum at 8 weeks of age. Graph presents data from four control and four mTOR cKO animals. For (A), (B), and (C), control and mTOR cKO samples were run on the same western blot. Expression was normalized first to beta-tubulin or actin and then to control. Values are expressed as the mean +- SEM. (D) MOG expression is dysregulated in mTOR cKO corpus callosum. Representative images of MOG staining show area of positivity in corpus callosum. Scale bar, 500 mum. Graph presents data from four control and five mTOR cKO animals. All values are expressed as the mean +- SEM. (E) Representative images of SOX10 (blue, oligodendroglial marker) and cleaved caspase-3 (red, marker of apoptosis) immunostaining from control and mTOR cKO corpus callosum at 7-8 weeks of age. Scale bar, 50 mum. Arrows indicate cleaved caspase-3 + /SOX10 + cells. Graphs present data from six animals/genotype. All values are expressed as th
