 Explore
 Validate
 Learn
Learn Immunohistochemistry
Antibody data
- Antibody Data
- Antigen structure
- References [1]
- Comments [0]
- Validations
- Immunohistochemistry [1]
- Other assay [3]
Submit
Validation data
Reference
Comment
Report error
- Product number
- PA5-55591 - Provider product page

- Provider
- Invitrogen Antibodies
- Product name
- FAM150A Polyclonal Antibody
- Antibody type
- Polyclonal
- Antigen
- Recombinant protein fragment
- Description
- Immunogen sequence: ARVTDKEPKP LLFLPAAGAG RTPSGSRSAE IFPRDSNLKD KFIKHFTGPV TFSPECSKHF Highest antigen sequence identity to the following orthologs: Mouse - 65%, Rat - 70%.
- Reactivity
- Human
- Host
- Rabbit
- Isotype
- IgG
- Vial size
- 100 μL
- Concentration
- 0.1 mg/mL
- Storage
- Store at 4°C short term. For long term storage, store at -20°C, avoiding freeze/thaw cycles.
Submitted references ALKAL1 gene silencing prevents colorectal cancer progression via suppressing Sonic Hedgehog (SHH) signaling pathway.
Chen S, Wang B, Fu X, Liang Y, Chai X, Ye Z, Li R, He Y, Kong G, Lian J, Li X, Chen T, Zhang X, Qiu X, Tang X, Zhou K, Lin B, Zeng J
Journal of Cancer 2021;12(1):150-162
Journal of Cancer 2021;12(1):150-162
No comments: Submit comment
Supportive validation
- Submitted by
- Invitrogen Antibodies (provider)
- Main image
- Experimental details
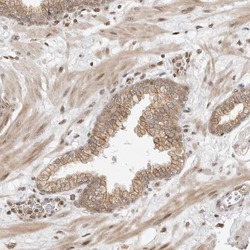
- Immunohistochemical analysis of FAM150A in human prostate using FAM150A Polyclonal Antibody (Product # PA5-55591) shows moderate cytoplasmic positivity in glandular cells.

Supportive validation
- Submitted by
- Invitrogen Antibodies (provider)
- Main image
- Experimental details
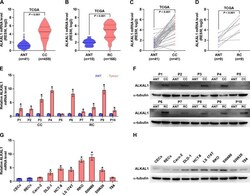
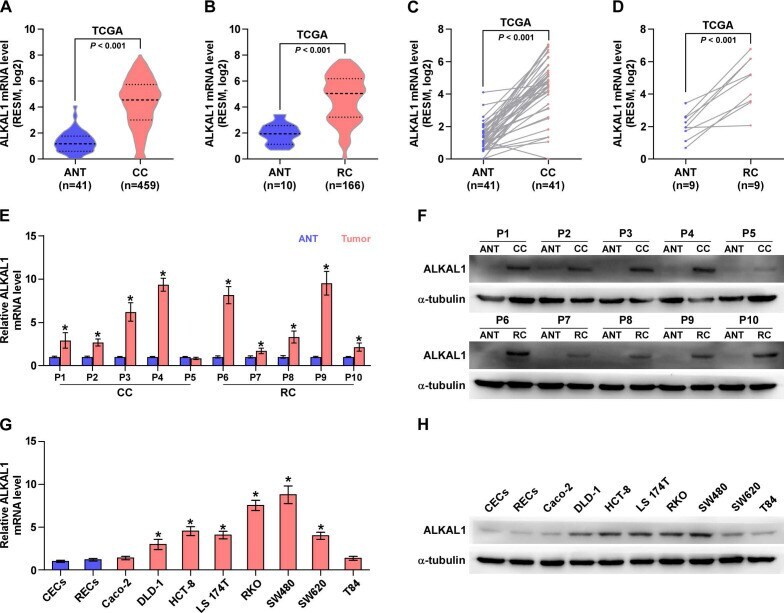
- Figure 1 ALKAL1 is upregulated in colorectal cancer tissues and cell lines. A-D) ALKAL1 expression levels was markedly upregulated in colorectal cancer tissues as assessed by analyzing TCGA colorectal cancer miRNA sequencing datasets. (E) Real-time PCR analysis of ALKAL1 in 10 primary colorectal cancer tissues compared with the matched adjacent normal tissues (ANT). (F) ALKAL1 protein expression in 10 paired CRC and adjacent normal tissues (ANT) from the same patient were detected by Western blot. alpha-tubulin was used as the loading control. (G) ALKAL1 mRNA expression was determined by RT-PCR in selected 8 colorectal cancer cell lines (Caco-2, DLD-1, HCT-8, LS 174T, RKO, SW480, SW620 and T84). (H) ALKAL1 protein expression was determined by Western blot in selected 8 colorectal cancer cell lines (Caco-2, DLD-1, HCT-8, LS 174T, RKO, SW480, SW620 and T84).
- Submitted by
- Invitrogen Antibodies (provider)
- Main image
- Experimental details
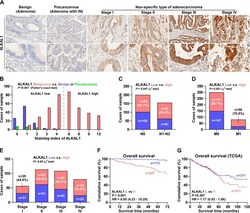
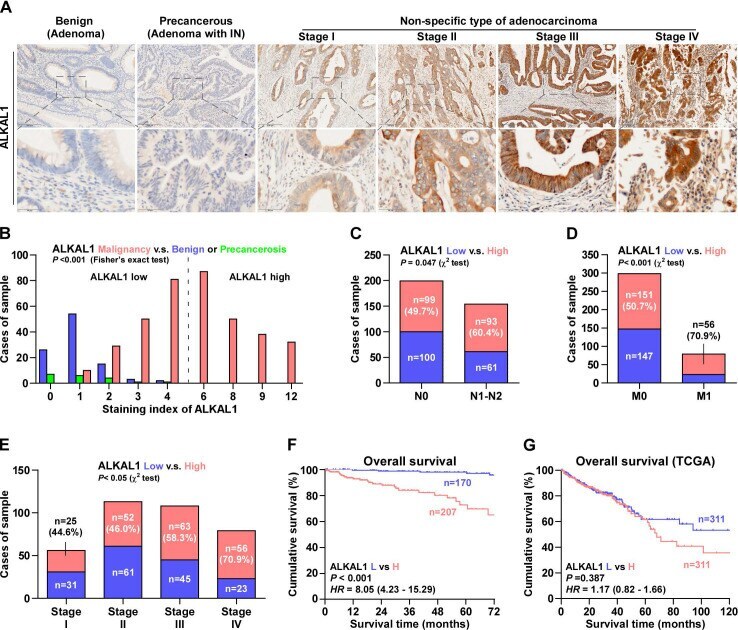
- Figure 2 Upregulation of ALKAL1 correlates with tumor malignancy and poor prognosis in colorectal cancer. (A) Representative photomicrographs of immunohistochemical analysis for ALKAL1 expression at various pathological stages, including benign, precancerous, and tumor stages I to IV. ALKAL1 was stained in brown. (B) Distribution of ALKAL1 immunostaining index across a variety of pathological stages of colorectal cancer. High expression of ALKAL1 was observed in 240/353 colorectal cancer tissue samples. (C-E) High expression of ALKAL1 was strong positive correlated with tumor classification, node classification and pathological stages. (F) Kaplan-Meier survival analysis revealed that patients with high ALKAL1 expression had poor overall survival. (G) Kaplan-Meier analysis of overall survival curves of colorectal cancer patients datasets from TCGA.
- Submitted by
- Invitrogen Antibodies (provider)
- Main image
- Experimental details
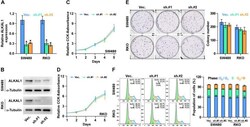
- Figure 3 ALKAL1 silencing is not associated with colorectal cancer cell proliferation. (A) Real-time PCR analysis of ALKAL1 expression in ALKAL1 silencing RKO and SW480 cell lines by endogenously knocking down ALKAL1 with retrovirus (sh.#1 and sh.#2) infection. (B) Western blot analysis of ALKAL1 expression in ALKAL1 silencing RKO and SW480 cell lines by endogenously knocking down ALKAL1 with retrovirus (sh.#1 and sh.#2) infection. (C-D) CCK-8 analysis of RKO and SW480 cells proliferation. (E) Plate colony formation analysis of RKO and SW480 cell by endogenously knocking down ALKAL1 with retrovirus (sh.#1 and sh.#2) infection. (F) Cell cycle analysis with PI staining analysis of RKO and SW480 cells by endogenously knocking down ALKAL1 with retrovirus (sh.#1 and sh.#2) infection. Error bars represent the mean +- S.D. of three independent experiments. * P < 0.05.
