 Explore
 Validate
 Learn
Learn Western blot
Antibody data
- Antibody Data
- Antigen structure
- References [1]
- Comments [0]
- Validations
- Western blot [1]
- Immunohistochemistry [1]
- Other assay [2]
Submit
Validation data
Reference
Comment
Report error
- Product number
- PA5-103622 - Provider product page

- Provider
- Invitrogen Antibodies
- Product name
- A2BP1 Polyclonal Antibody
- Antibody type
- Polyclonal
- Antigen
- Synthetic peptide
- Description
- Antibody detects endogenous levels of total FOX1.
- Reactivity
- Human, Mouse, Rat
- Host
- Rabbit
- Isotype
- IgG
- Vial size
- 100 μL
- Concentration
- 1 mg/mL
- Storage
- -20°C
Submitted references Ischemic heart injury leads to HIF1-dependent differential splicing of CaMK2γ.
Williams AL, Walton CB, Pinell B, Khadka VS, Dunn B, Lee K, Anagaran MCT, Avelar A, Shohet RV
Scientific reports 2021 Jun 23;11(1):13116
Scientific reports 2021 Jun 23;11(1):13116
No comments: Submit comment
Supportive validation
- Submitted by
- Invitrogen Antibodies (provider)
- Main image

- Experimental details
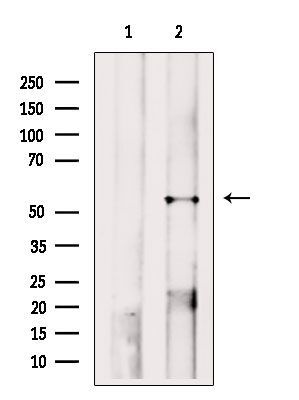
- Western blot analysis of A2BP1 in rat lung tissue lysate (left lane: treated with blocking peptide). Samples were incubated with A2BP1 polyclonal antibody (Product # PA5-103622).
Supportive validation
- Submitted by
- Invitrogen Antibodies (provider)
- Main image
- Experimental details
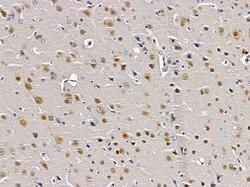
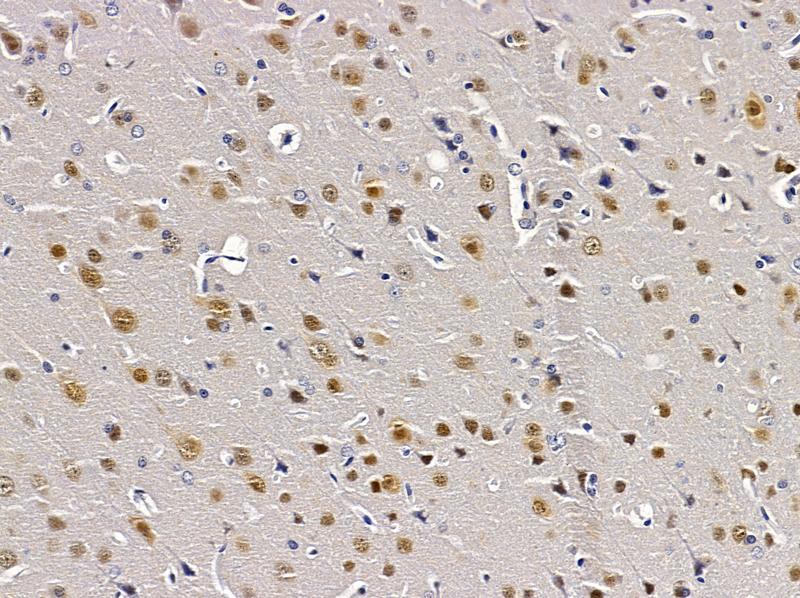
- Immunohistochemistry analysis of A2BP1 in rat brain tissue. The sample was formaldehyde fixed and a heat mediated antigen retrieval step in citrate buffer was performed. Samples were incubated with A2BP1 polyclonal antibody (Product # PA5-103622) using a dilution of 1:100 (4°C overnight) followed by HRP conjugated anti-Rabbit secondary antibody.
Supportive validation
- Submitted by
- Invitrogen Antibodies (provider)
- Main image

- Experimental details
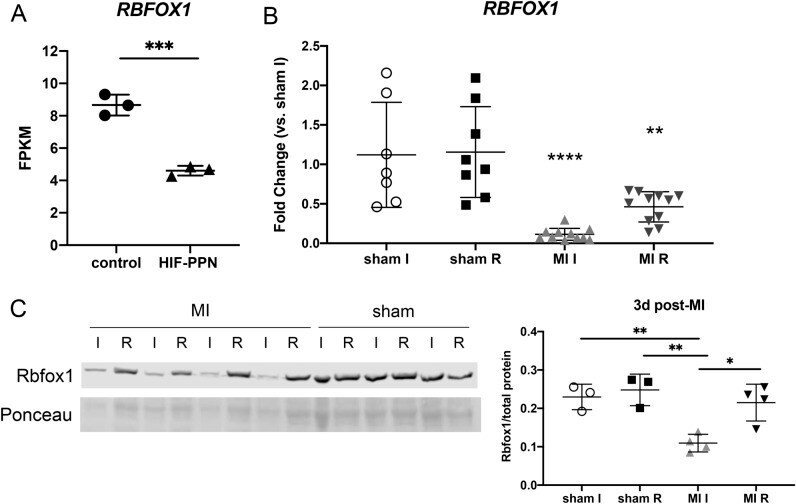
- Figure 5 Rbfox1 expression in HIF-PPN and post-MI hearts. ( A ) RNA-seq data for RBFOX1 RNA abundance in HIF-PPN vs. control (on dox) hearts. n = 3 per group. Student's t test. *** p < 0.001. Data displayed as fragments per kilobase of exon per million reads mapped (FPKM). ( B ) rt-PCR data for RBFOX1 expression in WT hearts 3 days post-MI. Using one-way ANOVA with Tukey's multiple comparisons, overall p -value < 0.0001. ** p < 0.01, **** p < 0.0001 for between group comparisons. n = 7-11 per group. ( C ) Western blot for Rbfox1 in 3d post-MI hearts. Cropped blots shown, with Ponceau staining used to visualize total protein and normalization. Quantification of blot below. For sham n = 3, MI n = 4. Overall p -value was p = 0.0022 using one-way ANOVA with Tukey's multiple comparisons. * p < 0.05, ** p < 0.01 for between group comparisons. I = ischemic tissue, R = remote. Uncropped western blots shown in Supplementary Fig. 2 .
- Submitted by
- Invitrogen Antibodies (provider)
- Main image
- Experimental details
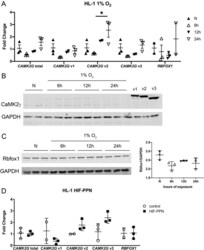
- Figure 6 CAMK2G splicing with HIF-PPN or hypoxia in vitro. ( A ) rt-PCR data for RBFOX1 and CAMK2G splice variant expression in HL-1 cells exposed to 1% O 2 . Fold change compared to normoxia, n = 2-3 per condition. Overall p -values for total CAMK2G , CAMK2G v1, CAMK2G v2, CAMK2G v3 and RBFOX1 were p = 0.06, p = 0.19, p = 0.04, p = 0.10 and p = p = 0.51, respectively, using one-way ANOVA with Tukey's multiple comparisons. * p < 0.05 for between group comparisons. ( B , C ) Western blots for CaMK2gamma ( B ) and Rbfox1 ( C ) for HL-1 cells exposed to 1% O 2 . Cropped blots shown, with GAPDH used for loading control and normalization. Recombinant proteins for each CaMK2gamma variant were used for comparison. n = 2-3 per condition. For panel D, quantification graph shown to the right. Using one-way ANOVA with Tukey's multiple comparisons, overall p -value = 0.06. Uncropped western blots shown in Supplementary Fig. 4 . Data representative of at least 3 independent experiments. ( D ) rt-PCR data for RBFOX1 and CAMK2G splice variant expression in HL-1 cells transfected with HIF-PPN. Fold change compared to control, n = 2-3 per group. Using student's t test, p = 0.91, p = 0.24, p = 0.12, p = 0.07 and p = 0.97 for total CAMK2G , CAMK2G v1, CAMK2G v2, CAMK2G v3 and RBFOX1 , respectively.
