 Explore
 Validate
 Learn
Learn Western blot
 Immunocytochemistry
Antibody data
- Antibody Data
- Antigen structure
- References [1]
- Comments [0]
- Validations
- Immunocytochemistry [2]
- Immunohistochemistry [1]
- Other assay [1]
Submit
Validation data
Reference
Comment
Report error
- Product number
- PA5-56448 - Provider product page

- Provider
- Invitrogen Antibodies
- Product name
- LYRM4 Polyclonal Antibody
- Antibody type
- Polyclonal
- Antigen
- Recombinant protein fragment
- Description
- Immunogen sequence: RAMLRESKRF SAYNYRTYAV RRIRDAFREN KNVKDPVEIQ TLVNKAKRDL GVIRRQVHIG QLYSTDKLII ENRD Highest antigen sequence identity to the following orthologs: Mouse - 89%, Rat - 88%.
- Reactivity
- Human
- Host
- Rabbit
- Isotype
- IgG
- Vial size
- 100 μL
- Concentration
- 0.3 mg/mL
- Storage
- Store at 4°C short term. For long term storage, store at -20°C, avoiding freeze/thaw cycles.
Submitted references Mitochondrial fatty acid synthesis coordinates oxidative metabolism in mammalian mitochondria.
Nowinski SM, Solmonson A, Rusin SF, Maschek JA, Bensard CL, Fogarty S, Jeong MY, Lettlova S, Berg JA, Morgan JT, Ouyang Y, Naylor BC, Paulo JA, Funai K, Cox JE, Gygi SP, Winge DR, DeBerardinis RJ, Rutter J
eLife 2020 Aug 17;9
eLife 2020 Aug 17;9
No comments: Submit comment
Supportive validation
- Submitted by
- Invitrogen Antibodies (provider)
- Main image
- Experimental details
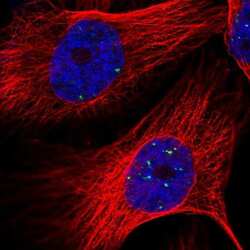
- Immunofluorescent staining of LYRM4 in human cell line U-251 MG shows positivity in nucleus. Samples were probed using a LYRM4 Polyclonal Antibody (Product # PA5-56448).
- Submitted by
- Invitrogen Antibodies (provider)
- Main image

- Experimental details
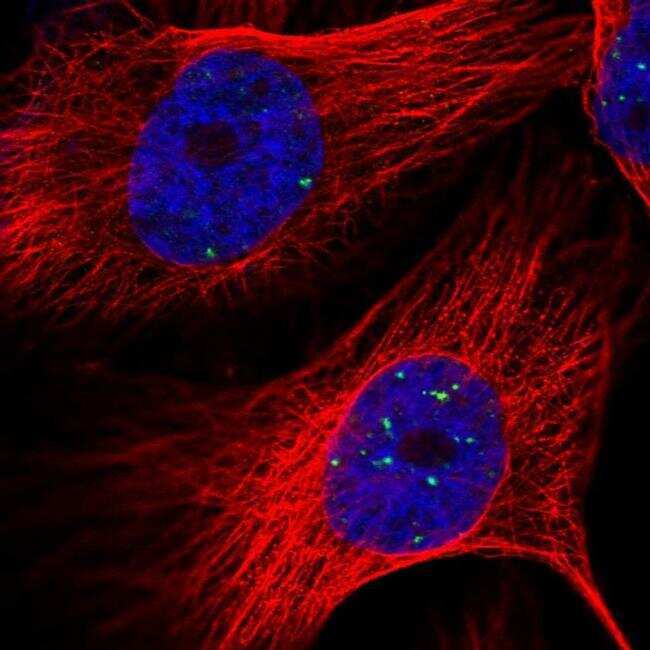
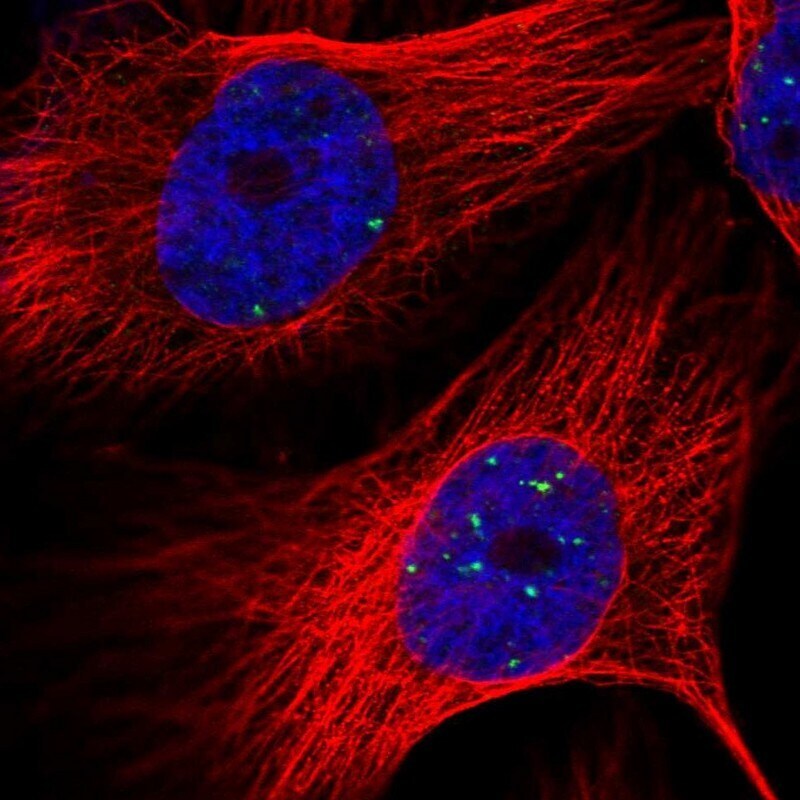
- Immunofluorecent analysis of LYRM4 in human cell line U-251 MG using LYRM4 Polyclonal Antibody (Product # PA5-56448). Staining shows localization to nuclear bodies.
Supportive validation
- Submitted by
- Invitrogen Antibodies (provider)
- Main image
- Experimental details
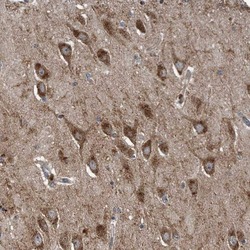
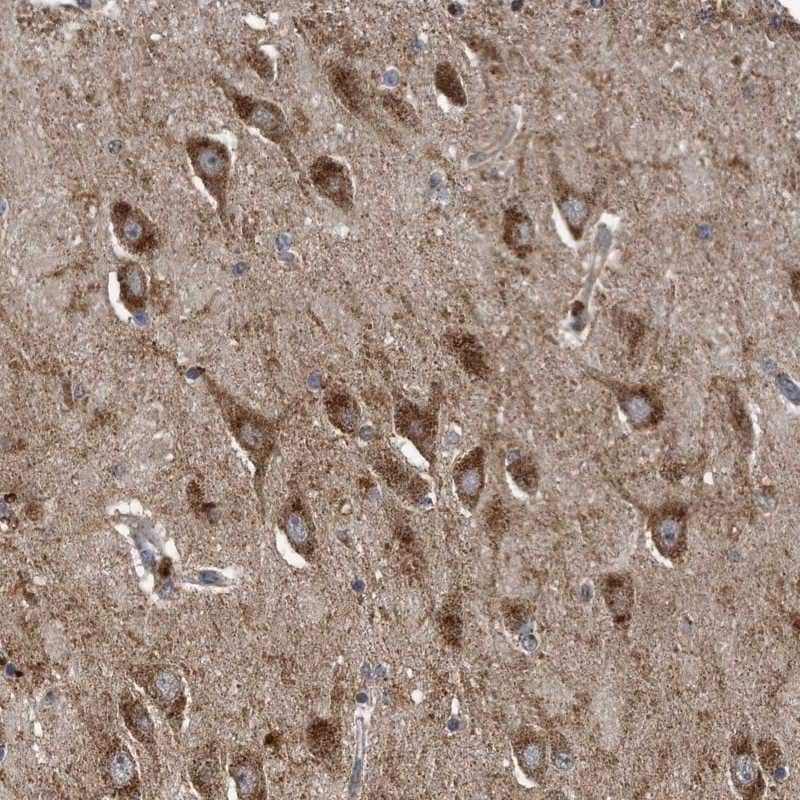
- Immunohistochemical analysis of LYRM4 in human hippocampus using LYRM4 Polyclonal Antibody (Product # PA5-56448) shows strong cytoplasmic positivity in neuronal cells.
Supportive validation
- Submitted by
- Invitrogen Antibodies (provider)
- Main image
- Experimental details
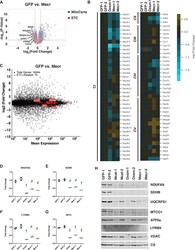
- Figure 3. Posttranslational loss of ETC components in mtFAS mutants is specific to LYR proteins and their targets. ( A-B ) Duplicate samples from the indicated cell lines were grown under proliferative conditions and subjected to TMT labeling and quantitative proteomics analysis. ( A ) Volcano plot of compiled Mecr clones vs. GFP controls showing all proteins (gray), mitochondrial proteins (blue), and electron transport chain subunits (ETC, red). Dashed gray lines indicate cutoffs for significance at -log10(p-value) = 1.3 and log2(Fold Change) = +/- 0.59. ( B ) Heatmap depicting log 2 (Fold Change) of OXPHOS subunits in the indicated cell lines. ( C ) Quadruplicate samples from mtFAS mutant cells and controls were grown under proliferative conditions. Total RNA was isolated, used as input for mRNA library prep, and sequenced. Resulting data were aligned to the mouse genome and analyzed for differential expression. ETC subunit-encoding transcripts are shown in red vs. all other transcripts (gray). ( D-G ) Relative abundance of the indicated LYR proteins or their targets in the indicated cell lines from the quantitative proteomics experiment described in ( A-B ) #=p < 0.01, +=p < 0.001, ++=p < 0.0001, error bars are SD. All statistical comparisons shown are between mtFAS mutants and GFP-1 clone; p-values when compared with GFP-2 clone were similar or smaller than when compared with GFP-1 clone. ( H ) Crude mitochondrial lysates generated from the indicated cell lines by differe
