 Explore
 Validate
 Learn
Learn Western blot
 Immunohistochemistry
Antibody data
- Antibody Data
- Antigen structure
- References [1]
- Comments [0]
- Validations
- Immunohistochemistry [1]
- Other assay [1]
Submit
Validation data
Reference
Comment
Report error
- Product number
- PA5-52739 - Provider product page

- Provider
- Invitrogen Antibodies
- Product name
- FAM163A Polyclonal Antibody
- Antibody type
- Polyclonal
- Antigen
- Recombinant protein fragment
- Description
- Immunogen sequence: YYCCKKSGTE VADEEEEREH DLPTHPRGPT CNACSSQALD GRGSLAPLTS EPCSQPCGVA ASHCTTCSPY SSPFYIRTAD MVPNGGGGER LSFAPTYYKE GGPPSLKLAA PQSYPVTWPG SGREAFTNPR AIST Highest antigen sequence identity to the following orthologs: Mouse - 81%, Rat - 85%.
- Reactivity
- Human
- Host
- Rabbit
- Isotype
- IgG
- Vial size
- 100 μL
- Concentration
- 0.05 mg/mL
- Storage
- Store at 4°C short term. For long term storage, store at -20°C, avoiding freeze/thaw cycles.
Submitted references The Role of Aberrant DNA Methylation in Misregulation of Gene Expression in Gonadotroph Nonfunctioning Pituitary Tumors.
Kober P, Boresowicz J, Rusetska N, Maksymowicz M, Paziewska A, Dąbrowska M, Kunicki J, Bonicki W, Ostrowski J, Siedlecki JA, Bujko M
Cancers 2019 Oct 25;11(11)
Cancers 2019 Oct 25;11(11)
No comments: Submit comment
Supportive validation
- Submitted by
- Invitrogen Antibodies (provider)
- Main image

- Experimental details
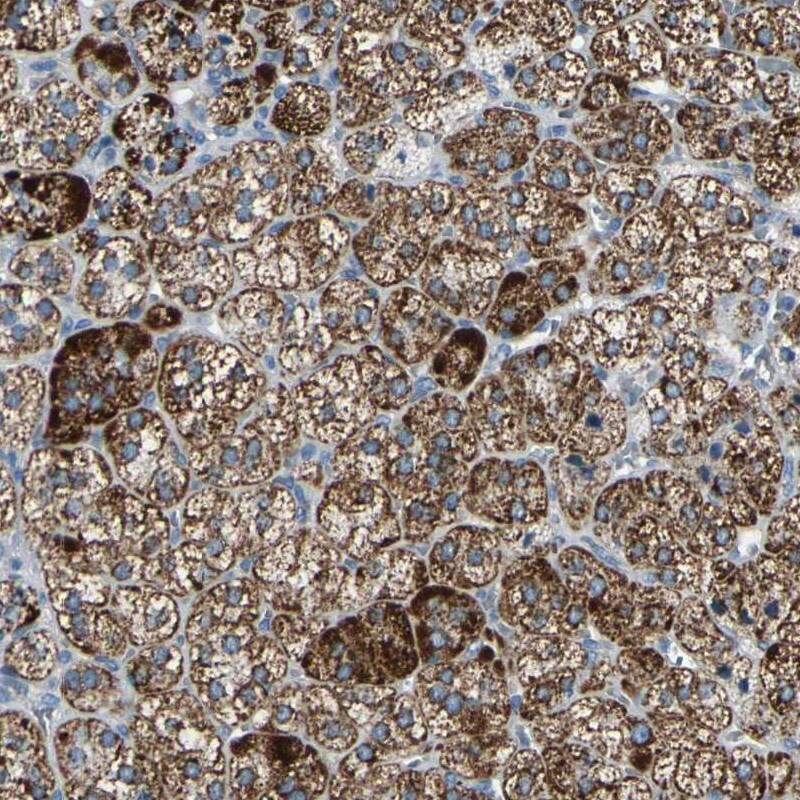
- Immunohistochemical analysis of FAM163A in human adrenal gland using FAM163A Polyclonal Antibody (Product # PA5-52739) shows strong cytoplasmic positivity in glandular cells.
Supportive validation
- Submitted by
- Invitrogen Antibodies (provider)
- Main image
- Experimental details
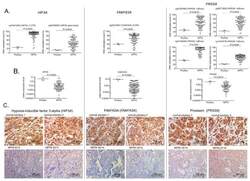
- Figure 4 Difference in DNA methylation at regulatory regions, and expression levels of HIF3A , FAM163A , and PRSS8 in gonadotroph NFPA samples and normal pituitary. ( A ) Pyrosequencing analysis of CpG sites. Each dot represents the methylation level in a particular sample. Mean values are shown as horizontal lines. ( B ) Relative expression levels of HIF3A , FAM163A , and PRSS8 in normal pituitary and NFPAs. Each dot represents the expression level in the sample. Mean values are shown as horizontal lines. ( C ) Examples of immunohistochemical staining of normal pituitary and NFPAs with antibodies against HIF3A, FAM163A, and prostasin (PRSS8). Magnification, x400.
