 Explore
 Validate
 Learn
Learn Western blot
 Immunocytochemistry
Antibody data
- Antibody Data
- Antigen structure
- References [6]
- Comments [0]
- Validations
- Immunocytochemistry [2]
- Immunohistochemistry [1]
- Flow cytometry [1]
- Other assay [13]
Submit
Validation data
Reference
Comment
Report error
- Product number
- 40-6400 - Provider product page

- Provider
- Invitrogen Antibodies
- Product name
- Metadherin Polyclonal Antibody
- Antibody type
- Polyclonal
- Antigen
- Other
- Reactivity
- Human, Mouse
- Host
- Rabbit
- Isotype
- IgG
- Vial size
- 100 μg
- Concentration
- 0.25 mg/mL
- Storage
- -20°C
Submitted references Expression of astrocyte-elevated gene-1 indicates prognostic value of fluoropyrimidine-based adjuvant chemotherapy in resectable stage III colorectal cancer.
MiR-128 suppresses metastatic capacity by targeting metadherin in breast cancer cells.
Astrocyte-elevated gene-1 confers resistance to pemetrexed in non-small cell lung cancer by upregulating thymidylate synthase expression.
MiR-630 suppresses breast cancer progression by targeting metadherin.
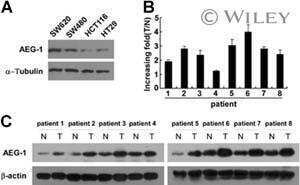
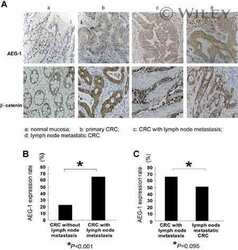
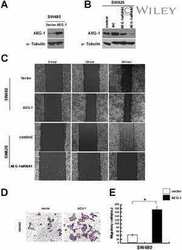
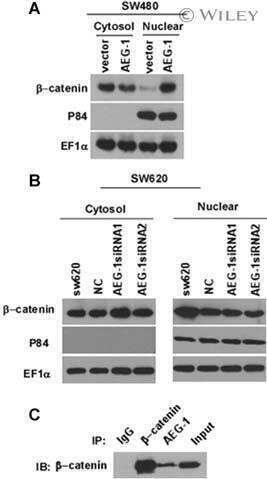
Astrocyte elevated gene-1 interacts with β-catenin and increases migration and invasion of colorectal carcinoma.
Pathologically decreased miR-26a antagonizes apoptosis and facilitates carcinogenesis by targeting MTDH and EZH2 in breast cancer.
Lin LW, Lai PS, Chen YY, Chen CY
Pathology international 2021 Nov;71(11):752-764
Pathology international 2021 Nov;71(11):752-764
MiR-128 suppresses metastatic capacity by targeting metadherin in breast cancer cells.
Cao D, Zhu H, Zhao Q, Huang J, Zhou C, He J, Liang Y
Biological research 2020 Sep 29;53(1):43
Biological research 2020 Sep 29;53(1):43
Astrocyte-elevated gene-1 confers resistance to pemetrexed in non-small cell lung cancer by upregulating thymidylate synthase expression.
Chen CY, Chen YY, Chen JJW, Chen KY, Ho CC, Shih JY, Chang YL, Yu CJ, Yang PC
Oncotarget 2017 Sep 22;8(37):61901-61916
Oncotarget 2017 Sep 22;8(37):61901-61916
MiR-630 suppresses breast cancer progression by targeting metadherin.
Zhou CX, Wang CL, Yu AL, Wang QY, Zhan MN, Tang J, Gong XF, Yin QQ, He M, He JR, Chen GQ, Zhao Q
Oncotarget 2016 Jan 12;7(2):1288-99
Oncotarget 2016 Jan 12;7(2):1288-99
Astrocyte elevated gene-1 interacts with β-catenin and increases migration and invasion of colorectal carcinoma.
Zhang F, Yang Q, Meng F, Shi H, Li H, Liang Y, Han A
Molecular carcinogenesis 2013 Aug;52(8):603-10
Molecular carcinogenesis 2013 Aug;52(8):603-10
Pathologically decreased miR-26a antagonizes apoptosis and facilitates carcinogenesis by targeting MTDH and EZH2 in breast cancer.
Zhang B, Liu XX, He JR, Zhou CX, Guo M, He M, Li MF, Chen GQ, Zhao Q
Carcinogenesis 2011 Jan;32(1):2-9
Carcinogenesis 2011 Jan;32(1):2-9
No comments: Submit comment
Supportive validation
- Submitted by
- Invitrogen Antibodies (provider)
- Main image

- Experimental details
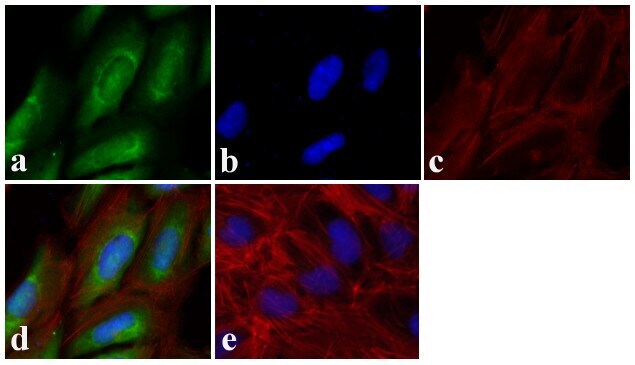
- Immunofluorescence analysis of Metadherin was done on 70% confluent log phase U2OS cells. The cells were fixed with 4% paraformaldehyde for 15 minutes, permeabilized with 0.25% Triton™ X-100 for 10 minutes, and blocked with 5% BSA for 1 hour at room temperature. The cells were labeled with Metadherin Rabbit Polyclonal Antibody (Product # 40-6400) at 1.5 µg/mL and incubated for 3 hours at room temperature and then labeled with Alexa Fluor 488 Goat Anti-Rabbit IgG Secondary Antibody (Product # A-11008) at a dilution of 1:400 for 30 minutes at room temperature (Panel a: green). Nuclei (Panel b: blue) were stained with SlowFade® Gold Antifade Mountant with DAPI (Product # S36938). F-actin (Panel c: red) was stained with Alexa Fluor 594 Phalloidin (Product # A12381). Panel d is a merged image showing cytoplasmic localization. Panel e shows no primary antibody control. The images were captured at 20X magnification.
- Submitted by
- Invitrogen Antibodies (provider)
- Main image
- Experimental details
- Immunofluorescence analysis of Metadherin was done on 70% confluent log phase U2OS cells. The cells were fixed with 4% paraformaldehyde for 15 minutes, permeabilized with 0.25% Triton X-100 for 10 minutes, and blocked with 5% BSA for 1 hour at room temperature. The cells were labeled with Metadherin Rabbit Polyclonal Antibody (Product # 40-6400) at 1.5 µg/mL and incubated for 3 hours at room temperature and then labeled with Alexa Fluor 488 Goat Anti-Rabbit IgG Secondary Antibody (Product # A-11008) at a dilution of 1:400 for 30 minutes at room temperature (Panel a: green). Nuclei (Panel b: blue) were stained with SlowFade® Gold Antifade Mountant with DAPI (Product # S36938). F-actin (Panel c: red) was stained with Alexa Fluor 594 Phalloidin (Product # A12381). Panel d is a merged image showing cytoplasmic localization. Panel e shows no primary antibody control. The images were captured at 20X magnification.

Supportive validation
- Submitted by
- Invitrogen Antibodies (provider)
- Main image

- Experimental details
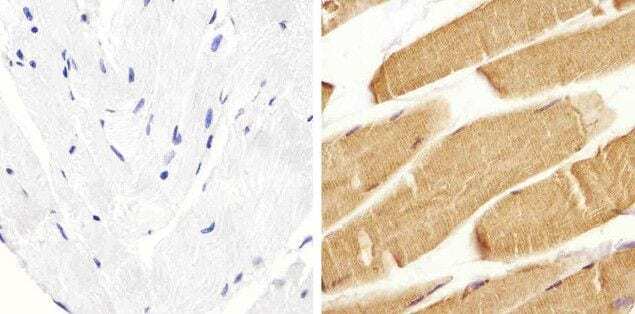
- Immunohistochemistry analysis of Metadherin (C-Term) showing staining in the cytoplasm of paraffin-embedded human skeletal muscle (right) compared to a negative control without primary antibody (left). To expose target proteins, antigen retrieval was performed using 10mM sodium citrate (pH 6.0), microwaved for 8-15 min. Following antigen retrieval, tissues were blocked in 3% H2O2-methanol for 15 min at room temperature, washed with ddH2O and PBS, and then probed with a Metadherin (C-Term) Rabbit Polyclonal Antibody (Product # 40-6400) diluted in 3% BSA-PBS at a dilution of 1:100 overnight at 4°C in a humidified chamber. Tissues were washed extensively in PBST and detection was performed using an HRP-conjugated secondary antibody followed by colorimetric detection using a DAB kit. Tissues were counterstained with hematoxylin and dehydrated with ethanol and xylene to prep for mounting.
Supportive validation
- Submitted by
- Invitrogen Antibodies (provider)
- Main image

- Experimental details
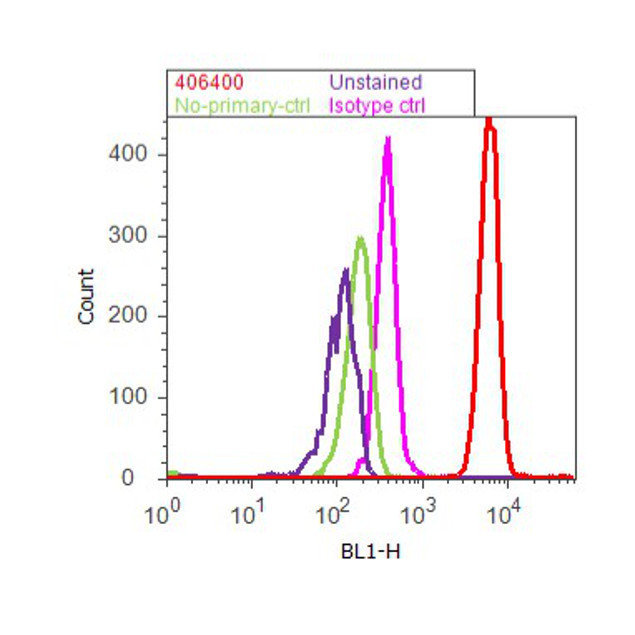
- Flow cytometry analysis of Metadherin was done on A549 cells. Cells were fixed with 70% ethanol for 10 minutes, permeabilized with 0.25% Triton™ X-100 for 20 minutes, and blocked with 5% BSA for 30 minutes at room temperature. Cells were labeled with Metadherin Rabbit Polyclonal Antibody (406400, red histogram) or with rabbit isotype control (pink histogram) at 3-5 µg/million cells in 2.5% BSA. After incubation at room temperature for 2 hours, the cells were labeled with Alexa Fluor® 488 Goat Anti-Rabbit Secondary Antibody (A11008) at a dilution of 1:400 for 30 minutes at room temperature. The representative 10,000 cells were acquired and analyzed for each sample using an Attune® Acoustic Focusing Cytometer. The purple histogram represents unstained control cells and the green histogram represents no-primary-antibody control.
Supportive validation
- Submitted by
- Invitrogen Antibodies (provider)
- Main image

- Experimental details
- NULL
- Submitted by
- Invitrogen Antibodies (provider)
- Main image
- Experimental details
- NULL

- Submitted by
- Invitrogen Antibodies (provider)
- Main image
- Experimental details
- NULL

- Submitted by
- Invitrogen Antibodies (provider)
- Main image

- Experimental details
- NULL
- Submitted by
- Invitrogen Antibodies (provider)
- Main image
- Experimental details
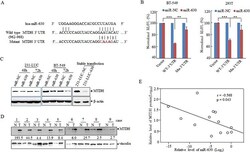
- Figure 3 MiR-630 targets MTDH directly in breast cancer cell lines A. A schematic diagram illustrating the miR-630-binding sites and 3 mutated bases in MTDH 3'UTR. B. Dual-luciferase assays showing repression of wild-type UTR or mutant UTR following transfection of miR-630 or NC http://mimics.in BT-549 (Left) and HEK293T (Right) cells. Data represent mean +- SD. * P < 0.05; ** P < 0.01; *** P < 0.001; All experiments were repeated independently three times. C. Western blot analysis showing the depression of MTDH in breast cancer cell lines 231-LUC (Left) and BT-549 (Right) transfected with miR-NC or miR-630 with beta-actin as a loading control. D. Western blot describing the MTDH expression in clinical specimens with vinculin as a loading control. The folds change indicated the MTDH expression in tumors against paratumor normalized to vinculin. E. Expression and correlation of miR-630(Log 2 ) and MTDH (log 10 ) in paired clinical breast cancer samples.
- Submitted by
- Invitrogen Antibodies (provider)
- Main image
- Experimental details
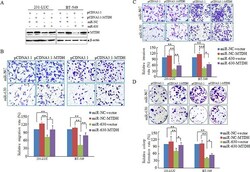
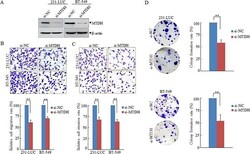
- Figure 5 MTDH partially mediates pathology functions of miR-630 in breast cancer A. Western blot analyzing the expression of MTDH in 231-LUC cells and BT-549 cells transfected with miR-NC or miR-630 mimics together with either pcDNA3.1-MTDH or control vector with beta-actin as a loading control. B. Transwell migration assay measuring migration of 231-LUC and BT-549 transfected with miR-NC or miR-630 mimics together with either pcDNA3.1-MTDH or control vector. C. Matrigel invasion assay measuring invasion of 231-LUC and BT-549 transfected with miR-NC or miR-630 mimics together with either pcDNA3.1-MTDH or control vector. D. Colony formation assay in 231-LUC cells and BT-549 cells transfected with miR-NC or miR-630 mimics together with either pcDNA3.1-MTDH or control vector. After transfection of pcDNA3.1-MTDH or control vector for 24 h, these cells were further transfected with miR-NC or miR-630 mimics. Data represent mean +- SD. * P < 0.05; ** P < 0.01; *** P < 0.001. All experiments were repeated independent three times.
- Submitted by
- Invitrogen Antibodies (provider)
- Main image

- Experimental details
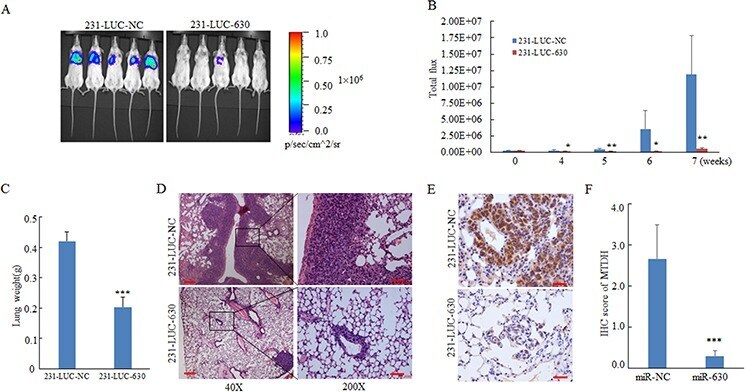
- Figure 6 MiR-630 suppresses metastasis in a xenograft mouse model A. IVIS luciferase in vivo images of lung metastasis. B. Representative lung metastasis burden of xenografted animals on day 0, 14, 21, 28, 35, 42, 49 after injected with 231-LUC-NC cells or 231-LUC-miR-630 cells.; lung metastasis models were established ( n = 6 per group) as described in ""Materials and methods"" and lung metastasis burden of xenografted animals were monitored using bioluminescent imaging (BLI). C. Lung tissue weight of the mice sacrificed on the day 49. D, E. Representative H&E staining (D) and MTDH immunohistochemical staining (E) of lung sections were performed on day 49 after cell injection. Scale bar, 50 mum. Lung tissues were fixed with 4% paraformaldehyde immediately after isolated for standard immunohistochemistry analysis as standard immunohistochemistry protocol. F. The IRS scores of MTDH expression in lung sections of mice orthotopically injected with 231-LUC-NC or 231-LUC-miR-630 cells. Data represent mean +- SD. * P < 0.05; ** P < 0.01; *** P < 0.001.
- Submitted by
- Invitrogen Antibodies (provider)
- Main image
- Experimental details
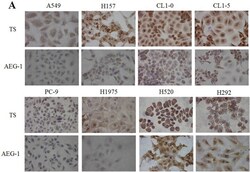
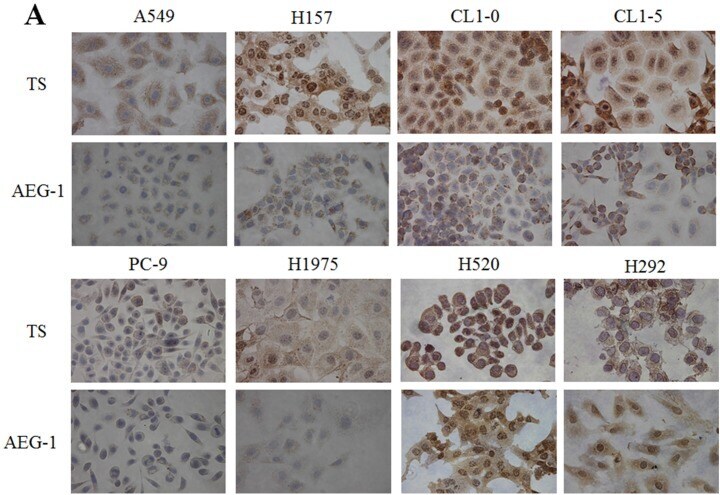
- Figure 1 Expression of astrocyte-elevated gene-1 and thymidylate synthase in several non-small cell lung cancer cell lines (A) Immunohistochemical staining revealed upregulation of astrocyte-elevated gene-1 (AEG-1) and thymidylate synthase (TS) protein expression in the primary non-small cell lung cancer (NSCLC) cell lines H157, CL1-0, CL1-5, H520, and H292. (B) Expression of AEG-1 and TS proteins in NSCLC cell lines was analyzed with western blotting. (C) AEG-1 and TS gene expression levels were determined by qPCR. *: compare with PC-9, p < 0.05. (D) Pemetrexed concentration-cell viability relationship was determined in eight NSCLC cell-lines. Lower pemetrexed IC 50 values were noted in NSCLC cell lines expressing lower TS levels. (E) Flow cytometry dot plots and quantitative analysis showed apoptosis rates in three representative cell lines (H520, CL1-0, and PC-9) with different TS expression levels. Measurements from control cells and cells treated with pemetrexed are shown.* p < 0.05.
- Submitted by
- Invitrogen Antibodies (provider)
- Main image

- Experimental details
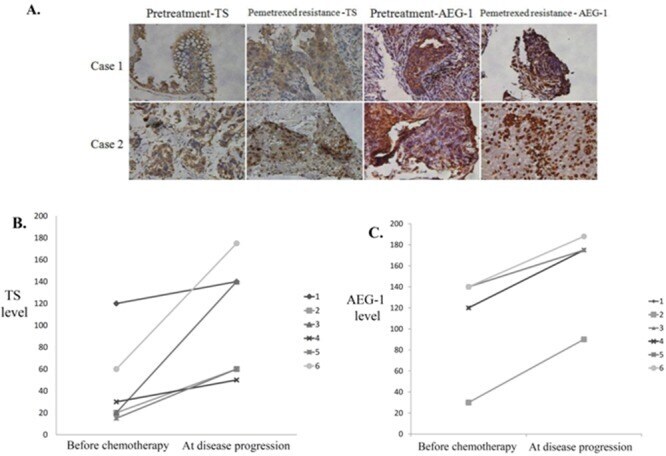
- Figure 5 Increased expression of astrocyte-elevated gene-1 and thymidylate synthase after acquired pemetrexed resistance in lung adenocarcinoma (A) Immunohistochemical staining for thymidylate synthase (TS) and astrocyte-elevated gene-1 (AEG-1) proteins in tissue samples from two patients before pemetrexed treatment and after the development of pemetrexed resistance. (B) Immunohistochemical staining-derived H-scores for TS (B) and AEG-1 (C) expression levels were obtained in tissues from six patients before chemotherapy and at disease progression. Mean TS H-score increased from 44.2 at baseline to 104.2 at disease progression ( P = 0.024), which was concomitant with a comparable increase of AEG-1 H-score from 115.0 to 163.0 ( P < 0.001).
- Submitted by
- Invitrogen Antibodies (provider)
- Main image
- Experimental details
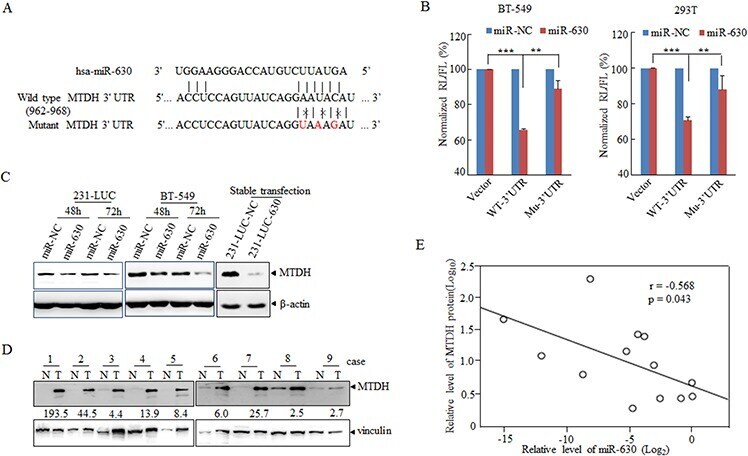
- Figure 4 MTDH is involved in the pathological functions of miR-630 A. Western blot analyzing the efficiency of RNAi against MTHD with beta-actin as a loading control. B, C. Effects of knockdown MTDH expression on Transwell migration (B) and Matrigel invasion (C) of 231-LUC and BT-549 transfected with si-NC or si-MTDH respectively. D. Effects of silencing MTDH expression on colony formation of 231-LUC cells (top) and BT-549 cells (bottom) transfected with si-NC or si-MTDH, respectively. Data represent mean +- SD. ** P < 0.01. All experiments were repeated independent three.

- Submitted by
- Invitrogen Antibodies (provider)
- Main image

- Experimental details
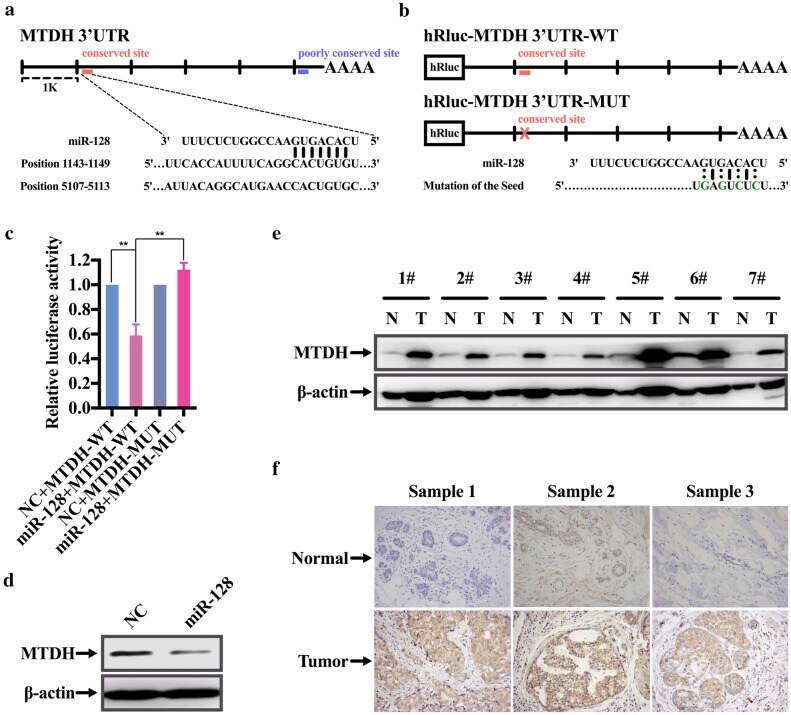
- Fig. 3 MTDH is a direct target of miR-128. a Schematic diagram of 3'UTR of MTDH gene and two predicted binding sites of miR-128. b Schematic representation of the luciferase reporter vectors including hRluc-MTDH 3'UTR-WT with wild-type binding site and hRluc-MTDH 3'UTR-WT containing four separate mutated bases in the binding site. c Relative activity of the luciferase gene fused with the wild-type or mutant 3'UTR of MTDH gene. d Western blot assay for detecting MTDH protein level of MDA-MB-231 cells transfected with NC or miR-124 mimics with beta-actin served as internal control. e Expression of MTDH in seven paired clinical breast cancer specimens. N and T present adjacent normal tissue and paired breast cancer specimen, respectively. f Representative images of immunohistochemical staining for MTDH of three randomly selected clinical cases. The brown or sepia staining signal denotes MTDH-positive regions. The symbol ** represents P < 0.01, using a two-tailed Student's t-test
- Submitted by
- Invitrogen Antibodies (provider)
- Main image

- Experimental details
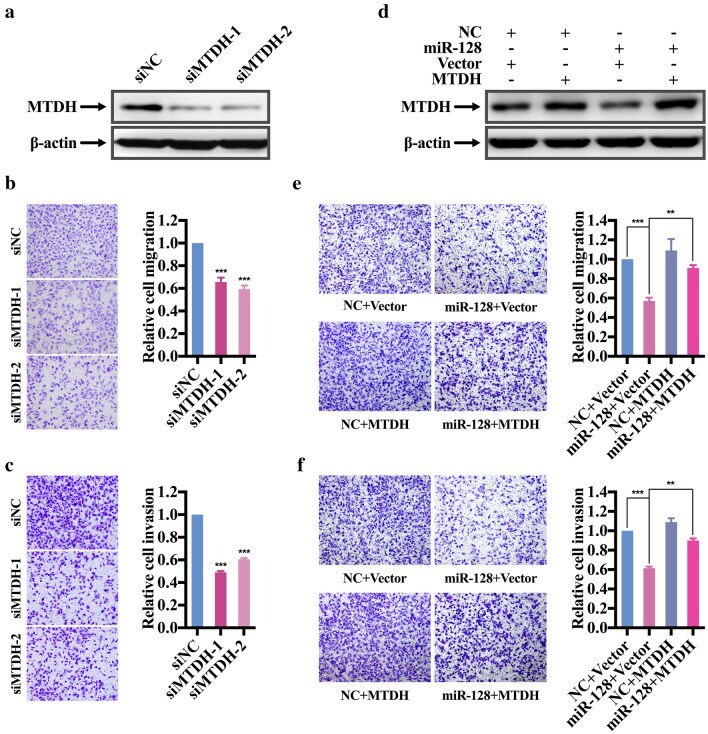
- Fig. 4 MTDH knockdown mimics miR-128-mediated phenotype and overexpression of MTDH restored miR-128-induced suppression of migration and invasion in MDA-MB-231 cells. a Immunoblotting analysis for expression of endogenous MTDH in MDA-MB-231 cells transfected with siNC and siMTDH-1/2. b , c Transwell migration and invasion assay of MDA-MB-231 cells transfected with siNC and siMTDH-1/2. Representative pictures of migrated or invaded cells with crystal violet staining are shown. Bars represent the relative migrated or invaded cells. d Western blot assay of MTDH in MDA-MB-231 cells cotransfected with NC or miR-128 mimics and pcDNA3.1-vector or pcDNA3.1-MTDH. e , f Transwell migration and invasion assay of MDA-MB-231 cells cotransfected with NC or miR-128 mimics and pcDNA3.1-vector or pcDNA3.1-MTDH. Representative pictures of migrated or invaded cells with crystal violet staining are shown. Bars represent the relative migrated or invaded cells. The symbol ** and *** represent P < 0.01 and P < 0.001, respectively, using a two-tailed Student's t-test
- Submitted by
- Invitrogen Antibodies (provider)
- Main image
- Experimental details
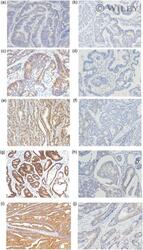
- 1 Figure Different expression levels of astrocyte-elevated gene-1 (AEG-1), thymidylate synthase (TS), excision repair cross-complementation group 1 (ERCC1), epidermal growth factor receptor (EGFR), and vascular endothelial growth factor (VEGF) detected through immunohistochemical staining in colorectal cancer. Original magnification x200. (a) High AEG-1 ( H -score = 270); (b) low AEG-1 ( H -score = 10); (c) high TS ( H -score = 240); (d) low TS ( H -score = 30); (e) high ERCC1 ( H -score = 300); (f) low ERCC1 ( H -score = 60); (g) high EGFR ( H -score = 300); (h) low EGFR ( H -score = 100); (i) high VEGF ( H -score = 300); and (j) low VEGF ( H -score = 100)
