Explore
 Validate
 Learn
Learn40-6500
antibody from Invitrogen Antibodies
Targeting: MTDH
3D3, AEG-1, LYRIC
 Western blot
 Immunocytochemistry
 Immunoprecipitation Immunohistochemistry Flow cytometry Other assay
Antibody data
- Antibody Data
- Antigen structure
- References [13]
- Comments [0]
- Validations
- Immunocytochemistry [2]
- Immunohistochemistry [3]
- Flow cytometry [1]
- Other assay [22]
Submit
Validation data
Reference
Comment
Report error
- Product number
- 40-6500 - Provider product page

- Provider
- Invitrogen Antibodies
- Product name
- Metadherin Polyclonal Antibody
- Antibody type
- Polyclonal
- Antigen
- Synthetic peptide
- Reactivity
- Human, Mouse, Canine
- Host
- Rabbit
- Isotype
- IgG
- Vial size
- 100 μg
- Concentration
- 0.25 mg/mL
- Storage
- -20°C
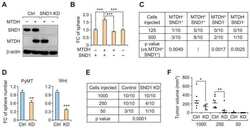
Submitted references Small-molecule inhibitors that disrupt the MTDH-SND1 complex suppress breast cancer progression and metastasis.
Disruption of SND1-MTDH Interaction by a High Affinity Peptide Results in SND1 Degradation and Cytotoxicity to Breast Cancer Cells In Vitro and In Vivo.
AEG-1 Regulates TWIK-1 Expression as an RNA-Binding Protein in Astrocytes.
MTDH/AEG-1 downregulation using pristimerin-loaded nanoparticles inhibits Fanconi anemia proteins and increases sensitivity to platinum-based chemotherapy.
Metadherin promotes metastasis by supporting putative cancer stem cell properties and epithelial plasticity in pancreatic cancer.
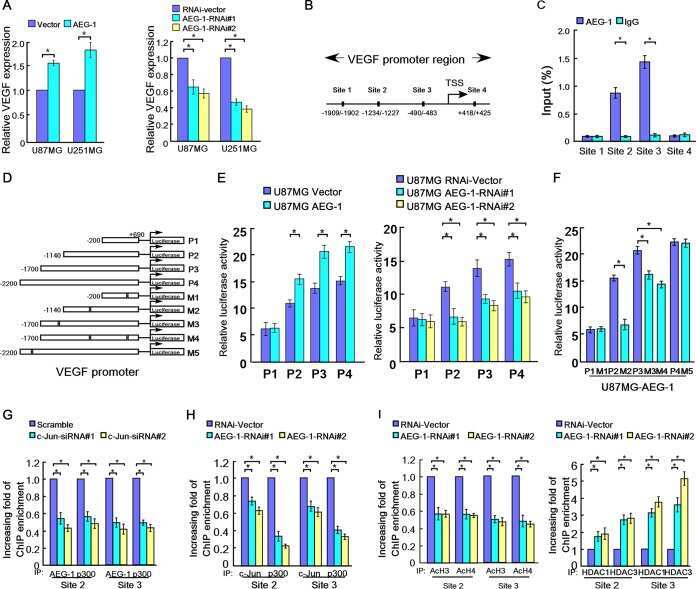
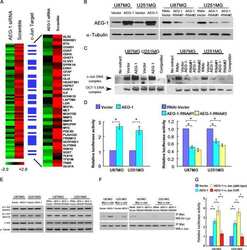
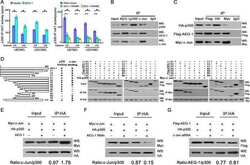
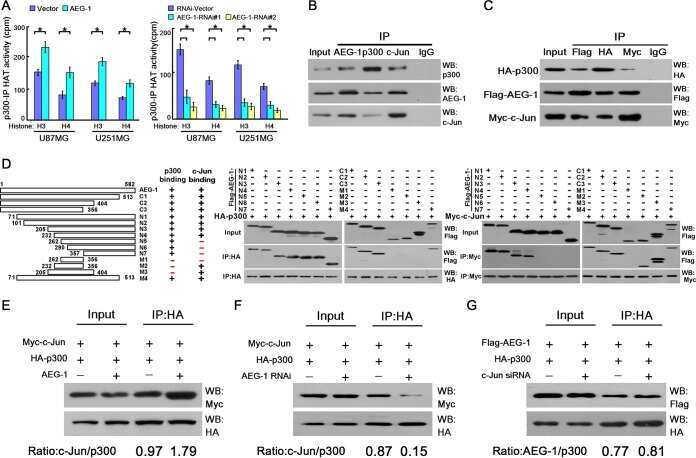
Astrocyte Elevated Gene 1 Interacts with Acetyltransferase p300 and c-Jun To Promote Tumor Aggressiveness.
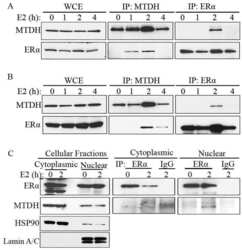
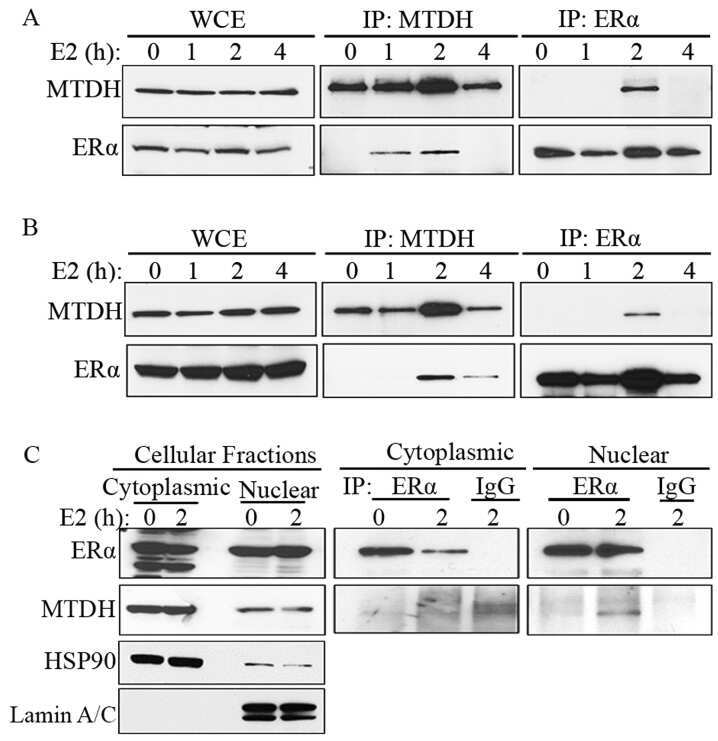
Role of metadherin in estrogen-regulated gene expression.
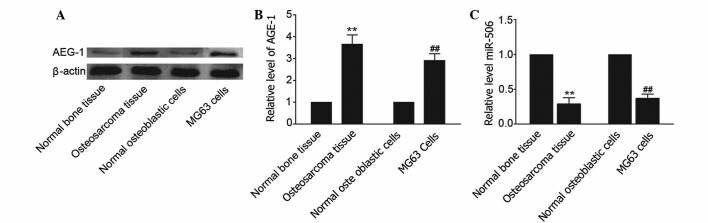
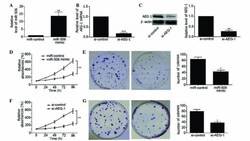
Overexpression of miR-506 suppresses proliferation and promotes apoptosis of osteosarcoma cells by targeting astrocyte elevated gene-1.
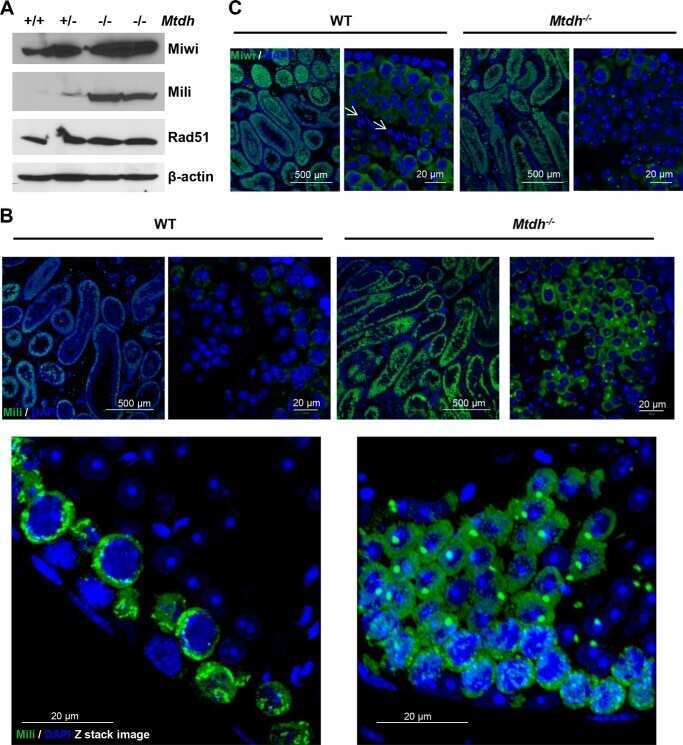
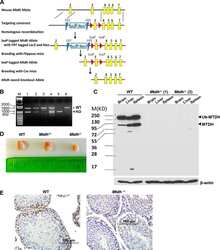
Genetic Deficiency of Mtdh Gene in Mice Causes Male Infertility via Impaired Spermatogenesis and Alterations in the Expression of Small Non-coding RNAs.
Metadherin contributes to the pathogenesis of chronic lymphocytic leukemia partially through Wnt/β-catenin pathway.
Genetic ablation of metadherin inhibits autochthonous prostate cancer progression and metastasis.
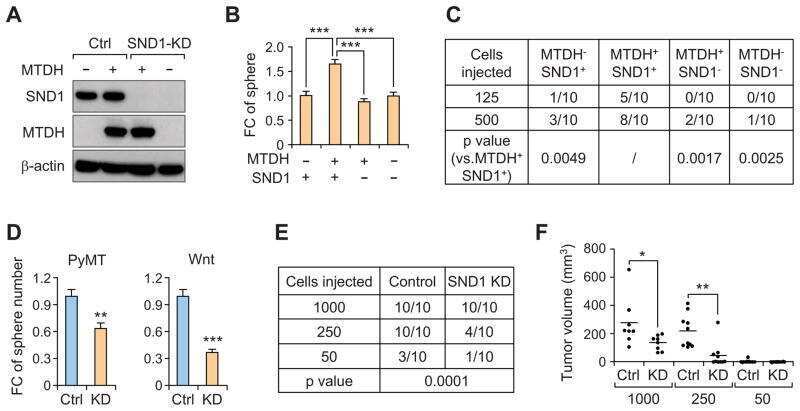
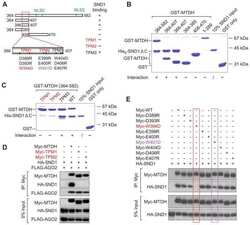
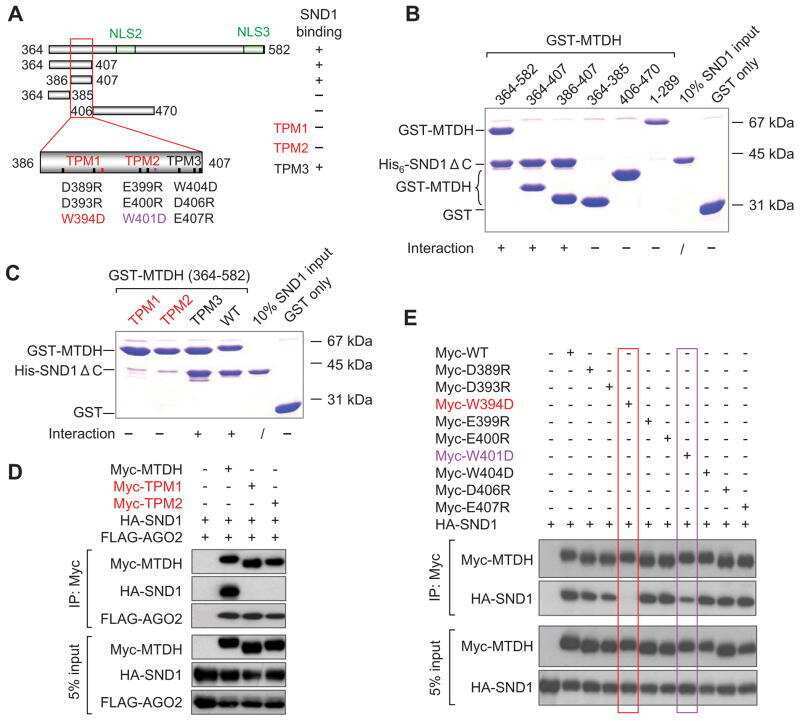
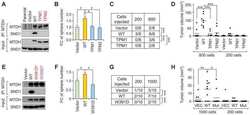
MTDH-SND1 interaction is crucial for expansion and activity of tumor-initiating cells in diverse oncogene- and carcinogen-induced mammary tumors.
Exposure to cadmium chloride influences astrocyte-elevated gene-1 (AEG-1) expression in MDA-MB231 human breast cancer cells.
Shen M, Wei Y, Kim H, Wan L, Jiang YZ, Hang X, Raba M, Remiszewski S, Rowicki M, Wu CG, Wu S, Zhang L, Lu X, Yuan M, Smith HA, Zheng A, Bertino J, Jin JF, Xing Y, Shao ZM, Kang Y
Nature cancer 2022 Jan;3(1):43-59
Nature cancer 2022 Jan;3(1):43-59
Disruption of SND1-MTDH Interaction by a High Affinity Peptide Results in SND1 Degradation and Cytotoxicity to Breast Cancer Cells In Vitro and In Vivo.
Li P, He Y, Chen T, Choy KY, Chow TS, Wong ILK, Yang X, Sun W, Su X, Chan TH, Chow LMC
Molecular cancer therapeutics 2021 Jan;20(1):76-84
Molecular cancer therapeutics 2021 Jan;20(1):76-84
AEG-1 Regulates TWIK-1 Expression as an RNA-Binding Protein in Astrocytes.
Jung HG, Kim A, Kim SC, Park JY, Hwang EM
Brain sciences 2021 Jan 11;11(1)
Brain sciences 2021 Jan 11;11(1)
MTDH/AEG-1 downregulation using pristimerin-loaded nanoparticles inhibits Fanconi anemia proteins and increases sensitivity to platinum-based chemotherapy.
Bi J, Areecheewakul S, Li Y, Yang S, Zhang Y, Ebeid K, Li L, Thiel KW, Zhang J, Dai D, Salem AK, Leslie KK, Meng X
Gynecologic oncology 2019 Nov;155(2):349-358
Gynecologic oncology 2019 Nov;155(2):349-358
Metadherin promotes metastasis by supporting putative cancer stem cell properties and epithelial plasticity in pancreatic cancer.
Suzuki K, Takano S, Yoshitomi H, Nishino H, Kagawa S, Shimizu H, Furukawa K, Miyazaki M, Ohtsuka M
Oncotarget 2017 Sep 12;8(39):66098-66111
Oncotarget 2017 Sep 12;8(39):66098-66111
Astrocyte Elevated Gene 1 Interacts with Acetyltransferase p300 and c-Jun To Promote Tumor Aggressiveness.
Liu L, Guan H, Li Y, Ying Z, Wu J, Zhu X, Song L, Li J, Li M
Molecular and cellular biology 2017 Mar 1;37(5)
Molecular and cellular biology 2017 Mar 1;37(5)
Role of metadherin in estrogen-regulated gene expression.
Li Y, Gonzalez Bosquet J, Yang S, Thiel KW, Zhang Y, Liu H, Leslie KK, Meng X
International journal of molecular medicine 2017 Aug;40(2):303-310
International journal of molecular medicine 2017 Aug;40(2):303-310
Overexpression of miR-506 suppresses proliferation and promotes apoptosis of osteosarcoma cells by targeting astrocyte elevated gene-1.
Yao J, Qin L, Miao S, Wang X, Wu X
Oncology letters 2016 Sep;12(3):1840-1848
Oncology letters 2016 Sep;12(3):1840-1848
Genetic Deficiency of Mtdh Gene in Mice Causes Male Infertility via Impaired Spermatogenesis and Alterations in the Expression of Small Non-coding RNAs.
Meng X, Yang S, Zhang Y, Wang X, Goodfellow RX, Jia Y, Thiel KW, Reyes HD, Yang B, Leslie KK
The Journal of biological chemistry 2015 May 8;290(19):11853-64
The Journal of biological chemistry 2015 May 8;290(19):11853-64
Metadherin contributes to the pathogenesis of chronic lymphocytic leukemia partially through Wnt/β-catenin pathway.
Li PP, Feng LL, Chen N, Ge XL, Lv X, Lu K, Ding M, Yuan D, Wang X
Medical oncology (Northwood, London, England) 2015 Feb;32(2):479
Medical oncology (Northwood, London, England) 2015 Feb;32(2):479
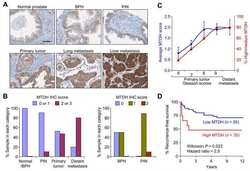
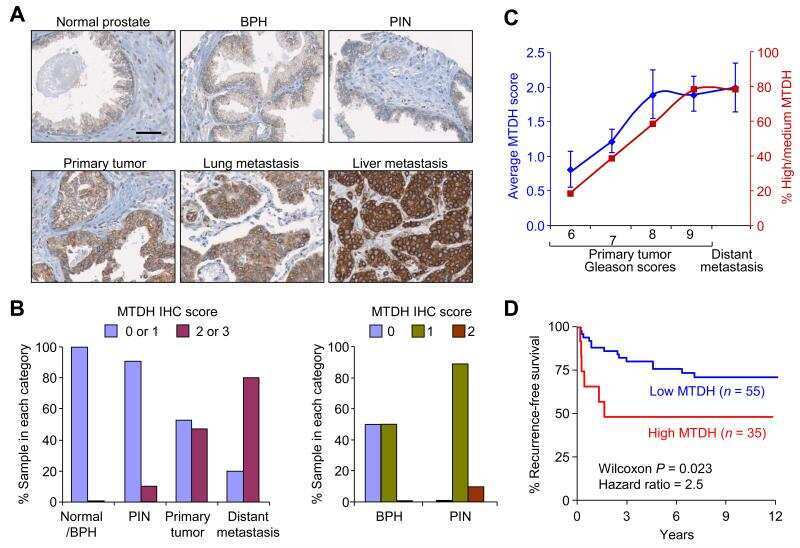
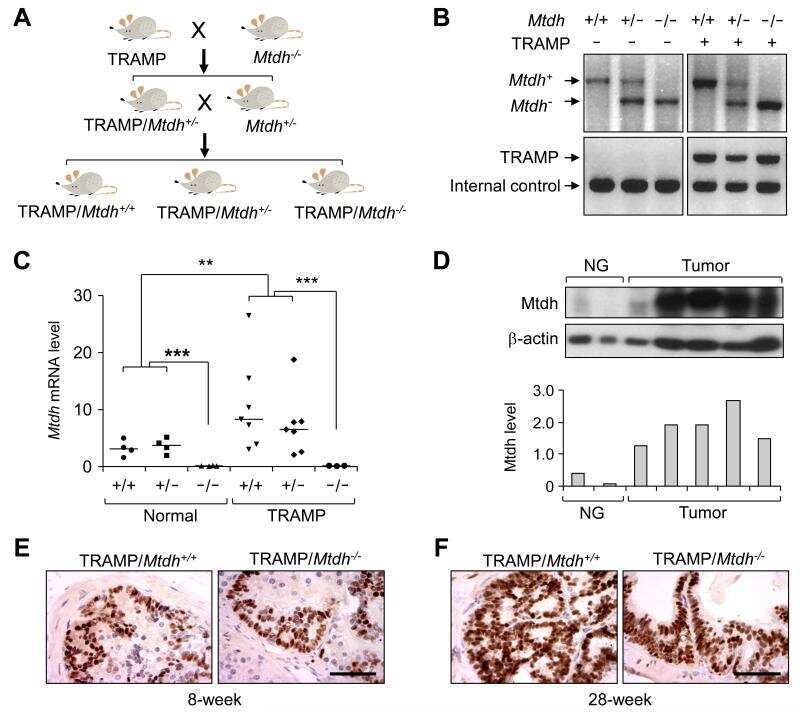
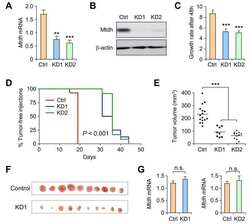
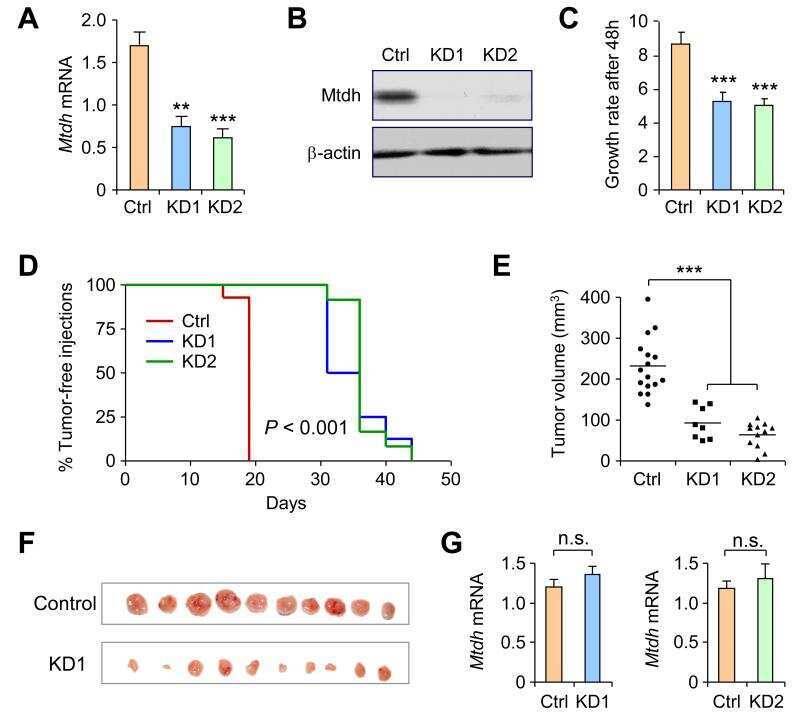
Genetic ablation of metadherin inhibits autochthonous prostate cancer progression and metastasis.
Wan L, Hu G, Wei Y, Yuan M, Bronson RT, Yang Q, Siddiqui J, Pienta KJ, Kang Y
Cancer research 2014 Sep 15;74(18):5336-47
Cancer research 2014 Sep 15;74(18):5336-47
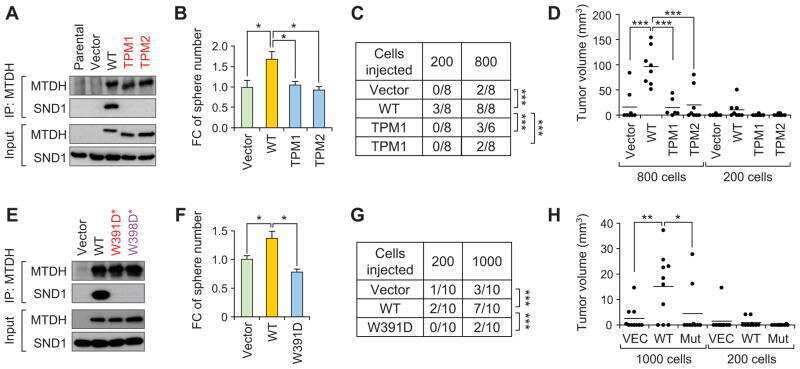
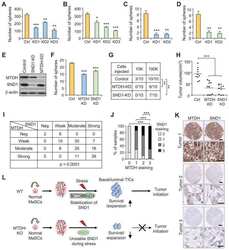
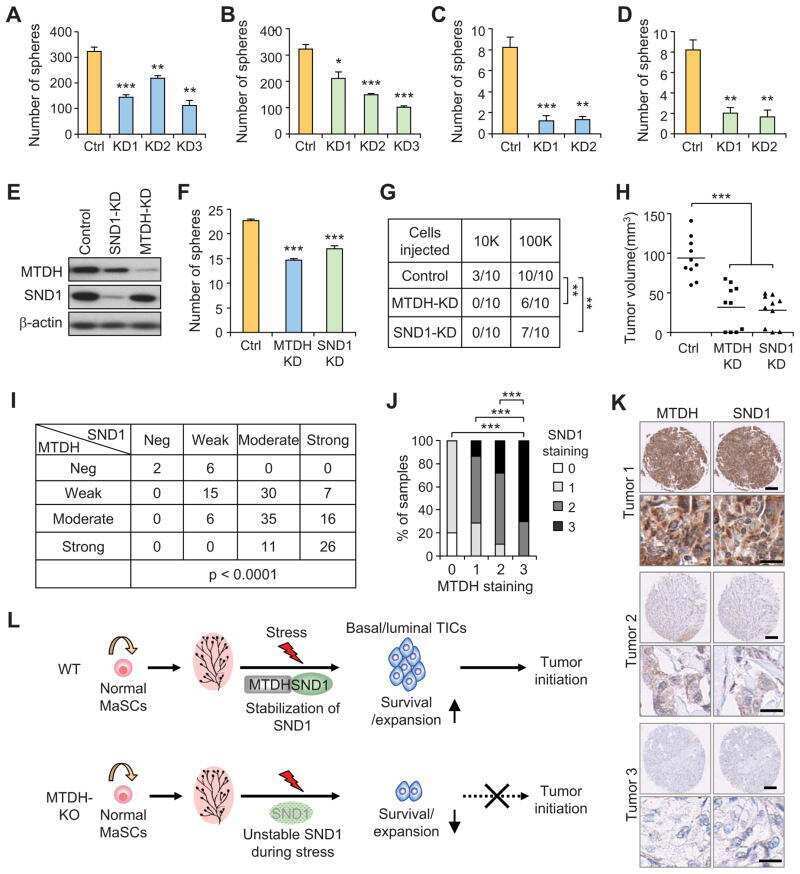
MTDH-SND1 interaction is crucial for expansion and activity of tumor-initiating cells in diverse oncogene- and carcinogen-induced mammary tumors.
Wan L, Lu X, Yuan S, Wei Y, Guo F, Shen M, Yuan M, Chakrabarti R, Hua Y, Smith HA, Blanco MA, Chekmareva M, Wu H, Bronson RT, Haffty BG, Xing Y, Kang Y
Cancer cell 2014 Jul 14;26(1):92-105
Cancer cell 2014 Jul 14;26(1):92-105
Exposure to cadmium chloride influences astrocyte-elevated gene-1 (AEG-1) expression in MDA-MB231 human breast cancer cells.
Luparello C, Longo A, Vetrano M
Biochimie 2012 Jan;94(1):207-13
Biochimie 2012 Jan;94(1):207-13
No comments: Submit comment
Supportive validation
- Submitted by
- Invitrogen Antibodies (provider)
- Main image

- Experimental details
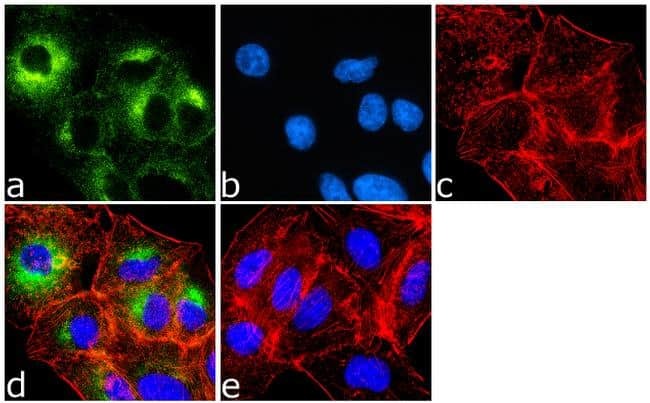
- Immunofluorescence analysis of Metadherin was done on 70% confluent log phase A549 cells. The cells were fixed with 4% paraformaldehyde for 10 minutes, permeabilized with 0.1% Triton™ X-100 for 10 minutes, and blocked with 1% BSA for 1 hour at room temperature. The cells were labeled with Metadherin Rabbit Polyclonal Antibody (Product # 40-6500) at 2 µg/mL in 0.1% BSA and incubated for 3 hours at room temperature and then labeled with Goat anti-Rabbit IgG (H+L) Superclonal™ Secondary Antibody, Alexa Fluor® 488 conjugate (Product # A27034) at a dilution of 1:2000 for 45 minutes at room temperature (Panel a: green). Nuclei (Panel b: blue) were stained with SlowFade® Gold Antifade Mountant with DAPI (Product # S36938). F-actin (Panel c: red) was stained with Alexa Fluor® 555 Rhodamine Phalloidin (Product # R415, 1:300). Panel d is a merged image showing cytoplasmic localization. Panel e is a no primary antibody control. The images were captured at 60X magnification.
- Submitted by
- Invitrogen Antibodies (provider)
- Main image

- Experimental details
- Immunofluorescence analysis of Metadherin was done on 70% confluent log phase A549 cells. The cells were fixed with 4% paraformaldehyde for 10 minutes, permeabilized with 0.1% Triton™ X-100 for 10 minutes, and blocked with 1% BSA for 1 hour at room temperature. The cells were labeled with Metadherin Rabbit Polyclonal Antibody (Product # 40-6500) at 2 µg/mL in 0.1% BSA and incubated for 3 hours at room temperature and then labeled with Goat anti-Rabbit IgG (Heavy Chain) Superclonal™ Secondary Antibody, Alexa Fluor® 488 conjugate (Product # A27034) at a dilution of 1:2000 for 45 minutes at room temperature (Panel a: green). Nuclei (Panel b: blue) were stained with SlowFade® Gold Antifade Mountant with DAPI (Product # S36938). F-actin (Panel c: red) was stained with Alexa Fluor® 555 Rhodamine Phalloidin (Product # R415, 1:300). Panel d is a merged image showing cytoplasmic localization. Panel e is a no primary antibody control. The images were captured at 60X magnification.

Supportive validation
- Submitted by
- Invitrogen Antibodies (provider)
- Main image
- Experimental details
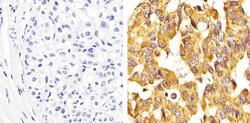
- Immunohistochemistry analysis of Metadherin (Mid) showing staining in the cytoplasm of paraffin-embedded human breast carcinoma tissue (right) compared to a negative control without primary antibody (left). To expose target proteins, antigen retrieval was performed using 10mM sodium citrate (pH 6.0), microwaved for 8-15 min. Following antigen retrieval, tissues were blocked in 3% H2O2-methanol for 15 min at room temperature, washed with ddH2O and PBS, and then probed with a Metadherin (Mid) polyclonal antibody (Product # 40-6500) diluted in 3% BSA-PBS at a dilution of 1:50 overnight at 4ºC in a humidified chamber. Tissues were washed extensively in PBST and detection was performed using an HRP-conjugated secondary antibody followed by colorimetric detection using a DAB kit. Tissues were counterstained with hematoxylin and dehydrated with ethanol and xylene to prep for mounting.

- Submitted by
- Invitrogen Antibodies (provider)
- Main image
- Experimental details
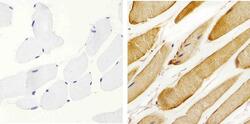
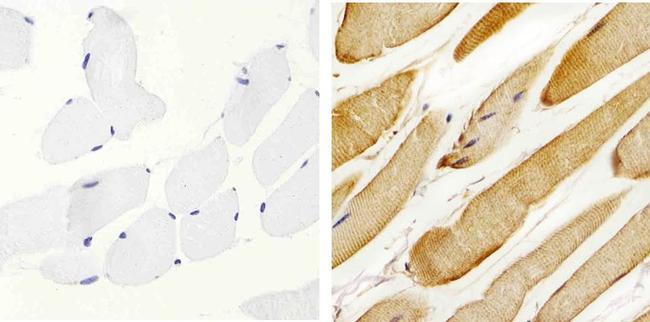
- Immunohistochemistry analysis of Metadherin (Mid) showing staining in the cytoplasm of paraffin-embedded human skeletal muscle tissue (right) compared to a negative control without primary antibody (left). To expose target proteins, antigen retrieval was performed using 10mM sodium citrate (pH 6.0), microwaved for 8-15 min. Following antigen retrieval, tissues were blocked in 3% H2O2-methanol for 15 min at room temperature, washed with ddH2O and PBS, and then probed with a Metadherin (Mid) polyclonal antibody (Product # 40-6500) diluted in 3% BSA-PBS at a dilution of 1:20 overnight at 4ºC in a humidified chamber. Tissues were washed extensively in PBST and detection was performed using an HRP-conjugated secondary antibody followed by colorimetric detection using a DAB kit. Tissues were counterstained with hematoxylin and dehydrated with ethanol and xylene to prep for mounting.
- Submitted by
- Invitrogen Antibodies (provider)
- Main image
- Experimental details
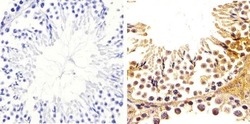
- Immunohistochemistry analysis of Metadherin (Mid) showing staining in the cytoplasm of paraffin-embedded mouse testis tissue (right) compared to a negative control without primary antibody (left). To expose target proteins, antigen retrieval was performed using 10mM sodium citrate (pH 6.0), microwaved for 8-15 min. Following antigen retrieval, tissues were blocked in 3% H2O2-methanol for 15 min at room temperature, washed with ddH2O and PBS, and then probed with a Metadherin (Mid) polyclonal antibody (Product # 40-6500) diluted in 3% BSA-PBS at a dilution of 1:20 overnight at 4ºC in a humidified chamber. Tissues were washed extensively in PBST and detection was performed using an HRP-conjugated secondary antibody followed by colorimetric detection using a DAB kit. Tissues were counterstained with hematoxylin and dehydrated with ethanol and xylene to prep for mounting.

Supportive validation
- Submitted by
- Invitrogen Antibodies (provider)
- Main image
- Experimental details
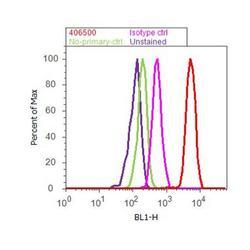
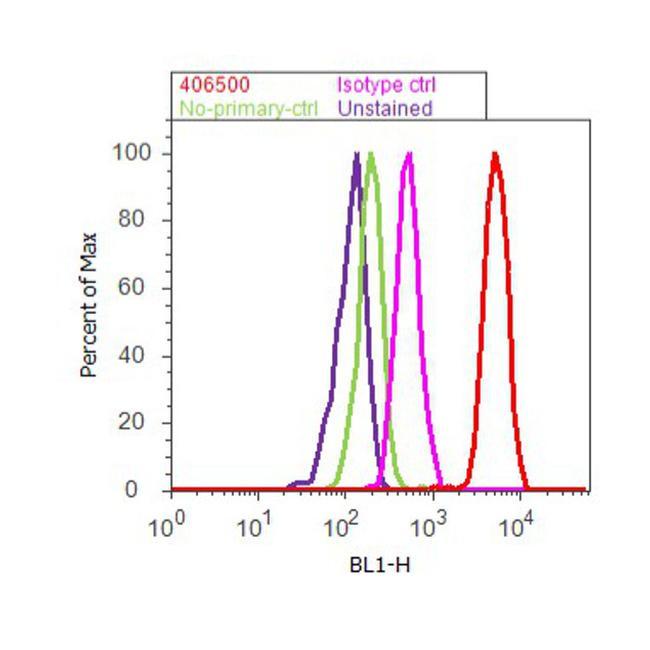
- Flow cytometry analysis of Metadherin was done on HeLa cells. Cells were fixed with 70% ethanol for 10 minutes, permeabilized with 0.25% Triton™ X-100 for 20 minutes, and blocked with 5% BSA for 30 minutes at room temperature. Cells were labeled with Metadherin Rabbit Polyclonal Antibody (406500, red histogram) or with rabbit isotype control (pink histogram) at 3-5 ug/million cells in 2.5% BSA. After incubation at room temperature for 2 hours, the cells were labeled with Alexa Fluor® 488 Goat Anti-Rabbit Secondary Antibody (A11008) at a dilution of 1:400 for 30 minutes at room temperature. The representative 10,000 cells were acquired and analyzed for each sample using an Attune® Acoustic Focusing Cytometer. The purple histogram represents unstained control cells and the green histogram represents no-primary-antibody control.
Supportive validation
- Submitted by
- Invitrogen Antibodies (provider)
- Main image

- Experimental details
- NULL
- Submitted by
- Invitrogen Antibodies (provider)
- Main image
- Experimental details
- NULL
- Submitted by
- Invitrogen Antibodies (provider)
- Main image

- Experimental details
- NULL
- Submitted by
- Invitrogen Antibodies (provider)
- Main image
- Experimental details
- NULL

- Submitted by
- Invitrogen Antibodies (provider)
- Main image
- Experimental details
- NULL
- Submitted by
- Invitrogen Antibodies (provider)
- Main image
- Experimental details
- NULL
- Submitted by
- Invitrogen Antibodies (provider)
- Main image
- Experimental details
- NULL
- Submitted by
- Invitrogen Antibodies (provider)
- Main image
- Experimental details
- NULL
- Submitted by
- Invitrogen Antibodies (provider)
- Main image
- Experimental details
- NULL

- Submitted by
- Invitrogen Antibodies (provider)
- Main image
- Experimental details
- NULL
- Submitted by
- Invitrogen Antibodies (provider)
- Main image
- Experimental details
- NULL
- Submitted by
- Invitrogen Antibodies (provider)
- Main image

- Experimental details
- NULL
- Submitted by
- Invitrogen Antibodies (provider)
- Main image
- Experimental details
- NULL
- Submitted by
- Invitrogen Antibodies (provider)
- Main image
- Experimental details
- NULL

- Submitted by
- Invitrogen Antibodies (provider)
- Main image

- Experimental details
- Figure 1. Levels of miR-506 were inversely associated with AEG-1 protein (64 kDa) expression in osteosarcoma tissues and human osteosarcoma MG63 cell line. (A and B) Western blot analysis revealed that the level of AEG-1 expression was increased in osteosarcoma tissues and cell lines. beta-actin was used as a control. (C) Quantitative polymerase chain reaction was used to investigate mRNA expression of miR-506 in osteosarcoma tissues and MG63 cell line. **P
- Submitted by
- Invitrogen Antibodies (provider)
- Main image
- Experimental details
- Figure 2. Upregulation of miR-506 and downregulation of AEG-1 inhibited the growth of human osteosarcoma MG63 cells. (A) qPCR revealed that the relative level of miR-506 was significantly increased in MG63 cells transfected with miR-506 mimics. **P

- Submitted by
- Invitrogen Antibodies (provider)
- Main image

- Experimental details
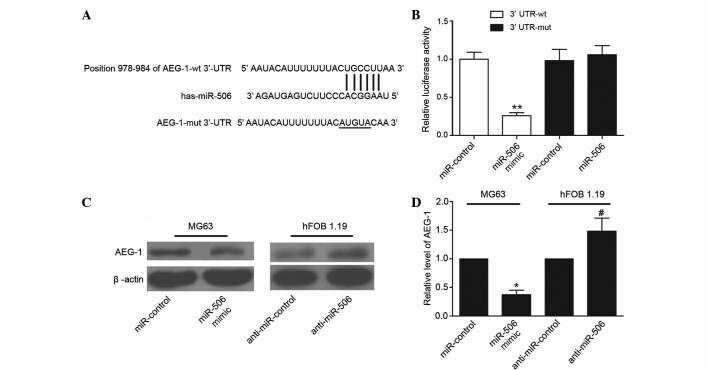
- Figure 4. AEG-1 is a direct target of miR-506 in human osteosarcoma MG63 cells. (A) Specific binding locations of miR-506 and the 3'-UTR of AEG-1. (B) Luciferase reporter assay showed that the relative luciferase activity of AEG-1 3'-UTR was significantly decreased in MG63 cells co-transfected with wt or mut AEG-1 3'-UTR and miR-506 mimics. (C and D) Western blot analysis showed that the relative level of AEG-1 protein (64 kDa) was decreased in MG63 cells following transfection with miR-506 mimics, but was increased in human normal osteoblastic hFOB 1.19 cells following transfection with anti-miR-506 mimics. *P
- Submitted by
- Invitrogen Antibodies (provider)
- Main image
- Experimental details
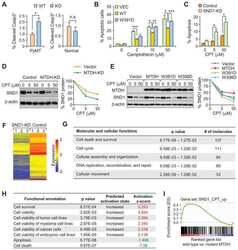
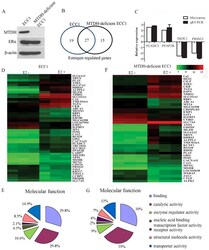
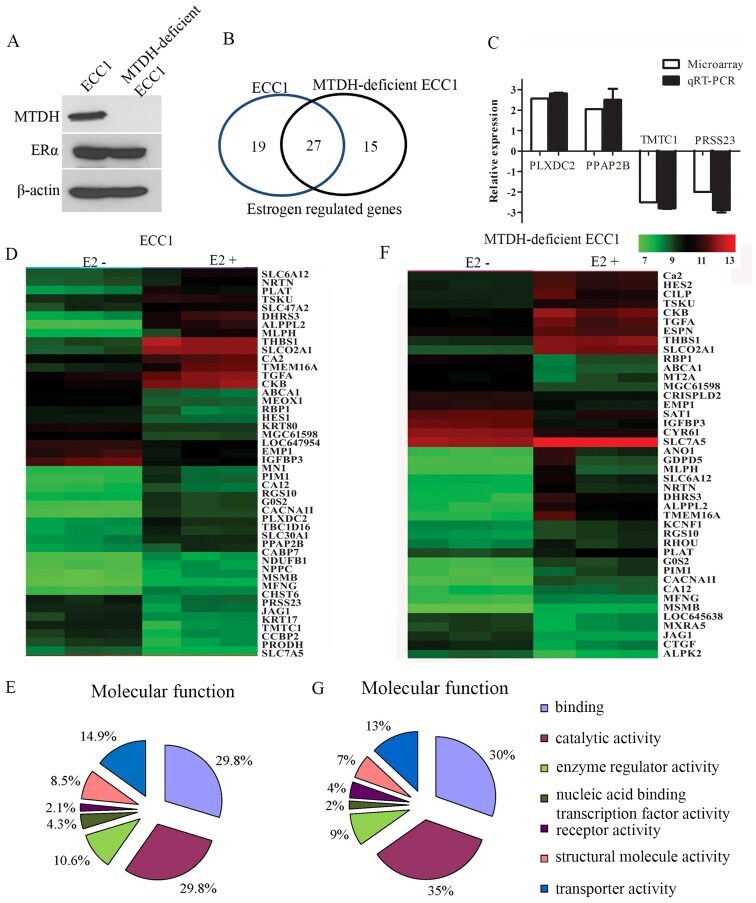
- Figure 1 Microarray data analysis of estrogen-treated control and metadherin (MTDH)-deficient ECC1 cells. (A) The expression of MTDH and estrogen receptor alpha (ERalpha) in ECC1 cells and MTDH-deficient ECC1 cells. (B) Venn diagram of differentially expressed genes induced by estrogen between ECC1 and MTDH-deficient ECC1 cells. (C) Two upregulated genes and two downregulated genes were amplified from estrogen-treated ECC1 cells and control ECC1 cells, and the fold-change compared with microarray data. (D and F) Heatmap of estrogen induced differently expressed genes in ECC1 cells (D) or in MTDH-deficient ECC1 cells (F). (E and G) GO analysis of estrogen-induced differently expressed genes in ECC1 cells (E) or MTDH-deficient ECC1 cells associated with molecular functions (G).
- Submitted by
- Invitrogen Antibodies (provider)
- Main image

- Experimental details
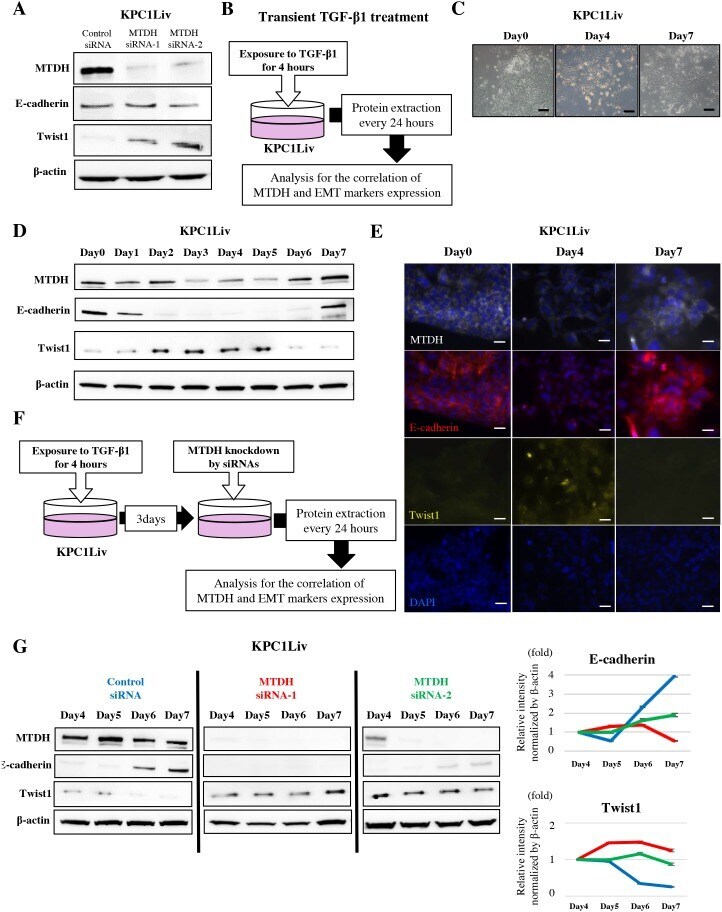
- Figure 3 MTDH expression induces MET by downregulation of Twist1 expression in pancreatic metastatic cancer cells (A) MTDH expression is negatively correlated with Twist1 expression and does not correlate with E-cadherin expression in KPC1Liv cell lines. (B) Transient TGF-beta1 treatment experimental design. ( C ) Morphological change in response to transient TGF-beta1 treatment in KPC1Liv cells. (D ) The expression pattern of E-cadherin, Twist1 and MTDH in response to transient TGF-beta1 treatment in KPC1Liv cells (Western blotting). (E ) Images of immunofluorescence staining for MTDH, E-cadherin, Twist, and DAPI in KPC1Liv cells at day 0, 4 and 7 after transient TGF-beta1 treatment. Twist1 is highly expressed in the nucleus of cells at day 4 after treatment when both MTDH and E-cadherin are relatively suppressed. (F) Experimental set up to evaluate the correlation between MTDH and Twist1 at MET induction in KPC1Liv cells. (G) E-cadherin re-activation and Twist1 de-activation by transient TGF-beta1 is attenuated by MTDH knockdown in KPC1Liv cells. The band intensities of E-cadherin and Twist1 were normalized by beta-actin using densitometry analysis in right panels (Blue line: control siRNA, red line: MTDH siRNA-1 and green line: MTDH siRNA-2). Bar, 50mum.
- Submitted by
- Invitrogen Antibodies (provider)
- Main image
- Experimental details
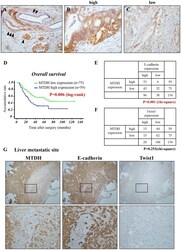
- Figure 4 MTDH is expressed in the membrane of PDAC and high MTDH expression predicts poor prognosis in patients with PDAC after curative resection (A-C) Representative immunohistochemical staining of MTDH in primary PDAC tissues. (A) Islet cells (internal positive control) (^), normal pancreatic duct (^ ^), PDAC (^ ^ ^). (B) High MTDH expression in primary PDAC. (C) Low MTDH expression in primary PDAC. (D) Kaplan-Meier analysis for overall survival of patients with PDAC based on MTDH staining. Patients with high MTDH expression presented a significantly poorer prognosis than patients with low MTDH expression after curative surgery ( P = 0.006: log-rank test). (E, F) The correlations between MTDH expression and E-cadherin expression (E) or Twist1 expression (F) in primary PDAC tissues. (chi-square test). (G) Representative staining for MTDH, E-cadherin and Twist1 in liver metastasis of PDAC tissues (Upper panels: low magnification: x100, Lower panels: high magnification: x200).
- Submitted by
- Invitrogen Antibodies (provider)
- Main image
- Experimental details
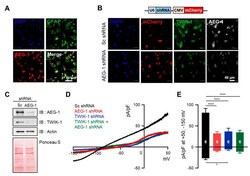
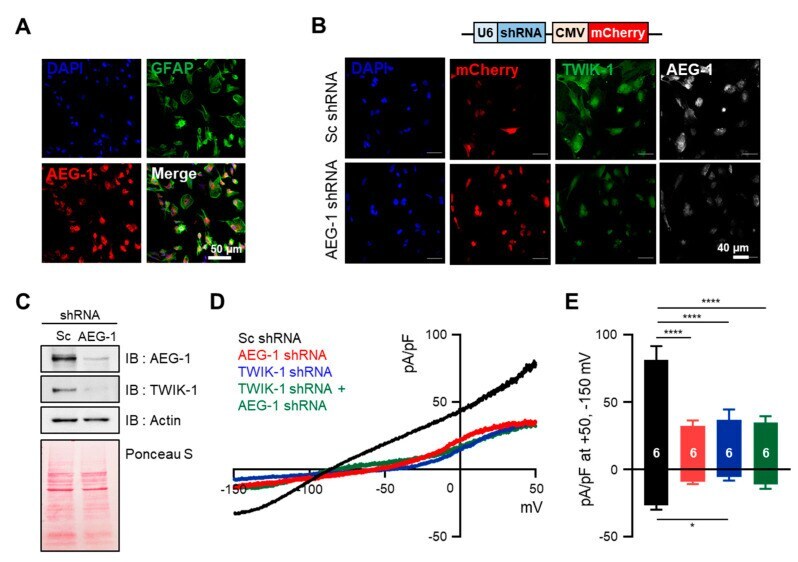
- Figure 2 AEG-1 knockdown reduces TWIK-1 protein levels and TWIK-1-mediated potassium currents in primary cultured astrocytes. ( A ) Immunofluorescence staining of cultured astrocytes using AEG-1 and GFAP, an astrocyte marker. ( B ) Immunofluorescence staining of TWIK-1 and AEG-1 in transfected astrocyte. Knockdown of the AEG-1 inhibits the levels of TWIK-1. Scale bar, 40 mum. The shRNA vector contains a shRNA sequence under the control of U6 promoter, with mCherry co-expression under a CMV promoter. ( C ) Knockdown of the AEG-1 in primary cultured astrocytes. Immunoblot data show the decreased AEG-1 and TWIK-1 expression. ( D ) Representative whole-cell I-V curves of astrocytes overexpressing Sc shRNA (black), AEG-1 shRNA (red), TWIK-1 shRNA (blue), and AEG-1 and TWIK-1 shRNAs (green). ( E ) Pooled data for whole-cell current amplitudes in AEG-1 knockdown, TWIK-1 knockdown, and AEG-1 and TWIK-1 double knockdown astrocytes. All values are presented as mean +- SEM. * p < 0.05, **** p < 0.0001. Two-way ANOVA followed by the Tukey's post hoc.
- Submitted by
- Invitrogen Antibodies (provider)
- Main image

- Experimental details
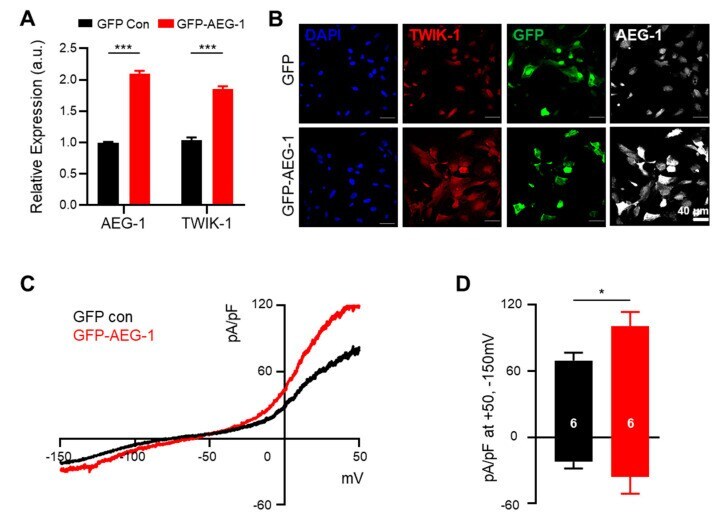
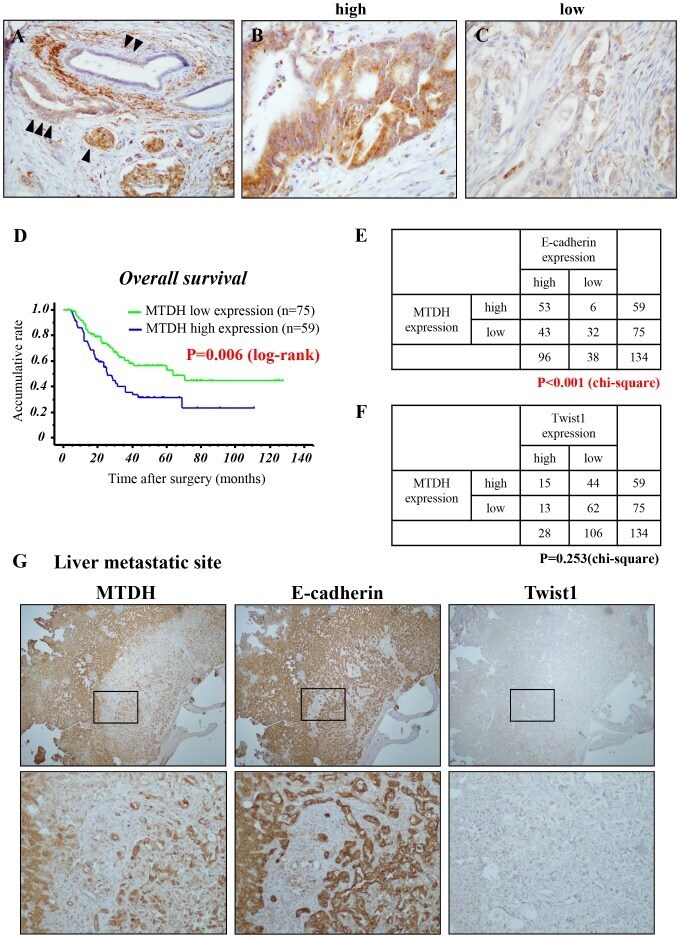
- Figure 3 AEG-1 overexpression enhances TWIK-1 mRNA and protein levels and astrocytic potassium currents in cultured astrocytes. ( A ) Overexpression of AEG-1 increases TWIK-1 mRNAs ( B ) Immunofluorescence staining of TWIK-1 and AEG-1 in transfected astrocytes. AEG-1 overexpression increases expression levels of TWIK-1. Scale bar, 40 mum. ( C ) Representative traces from transfected astrocytes with GFP (control)- and GFP-AEG-1. ( D ) Bar graph showing potassium currents averaged from results in ( C ) at +50 mV and -150 mV. The number on each bar indicates n for each condition. All values are presented as mean +- SEM. * p < 0.05, *** p < 0.001. P-values were obtained from the Student's t-test.