Explore
 Validate
 Learn
Learn Western blot
 Immunohistochemistry
Antibody data
- Antibody Data
- Antigen structure
- References [1]
- Comments [0]
- Validations
- Immunohistochemistry [1]
- Other assay [1]
Submit
Validation data
Reference
Comment
Report error
- Product number
- PA5-77257 - Provider product page

- Provider
- Invitrogen Antibodies
- Product name
- COL5A3 Polyclonal Antibody
- Antibody type
- Polyclonal
- Antigen
- Synthetic peptide
- Description
- The antibody was affinity-purified from rabbit antiserum by affinity-chromatography using epitope-specific immunogen and the purity is > 95% (by SDS-PAGE).
- Reactivity
- Human, Mouse, Rat
- Host
- Rabbit
- Isotype
- IgG
- Vial size
- 100 μL
- Concentration
- 1 mg/mL
- Storage
- Store at 4°C short term. For long term storage, store at -20°C, avoiding freeze/thaw cycles.
Submitted references Global targetome analysis reveals critical role of miR-29a in pancreatic stellate cell mediated regulation of PDAC tumor microenvironment.
Dey S, Liu S, Factora TD, Taleb S, Riverahernandez P, Udari L, Zhong X, Wan J, Kota J
BMC cancer 2020 Jul 13;20(1):651
BMC cancer 2020 Jul 13;20(1):651
No comments: Submit comment
Supportive validation
- Submitted by
- Invitrogen Antibodies (provider)
- Main image
- Experimental details
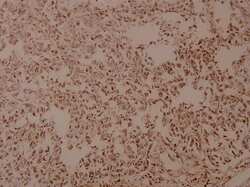
- Immunohistochemistry analysis of COL5A3 in paraffin-embedded human breast carcinoma tissue. Samples were incubated with COL5A3 polyclonal antibody (Product # PA5-77257) at a dilution of 1:100.
Supportive validation
- Submitted by
- Invitrogen Antibodies (provider)
- Main image

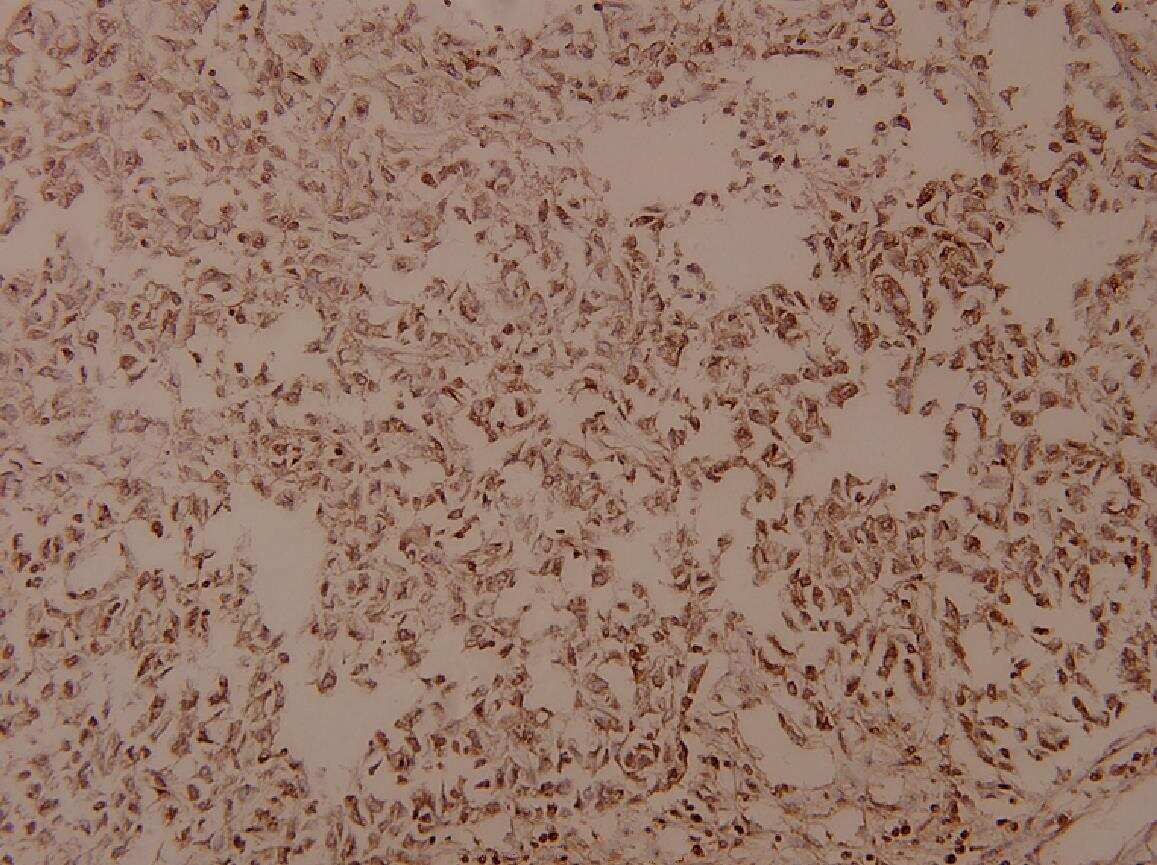
- Experimental details
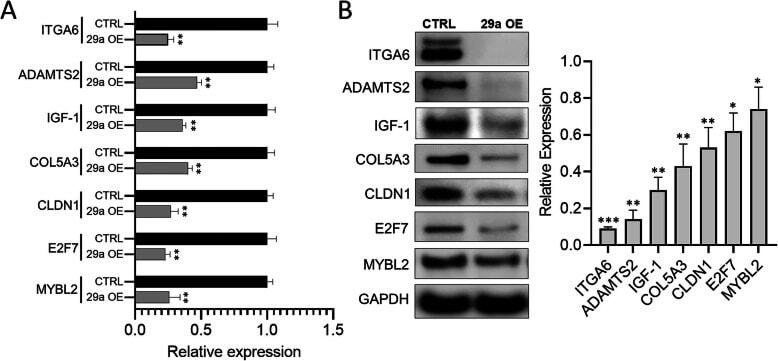
- Fig. 2 Validation of miR-29a direct target. a Relative fold changes estimated by qPCR analysis for the top miR-29a candidate target genes of ITGA6, ADAMTS2, IGF-1, COL5A3, CLDN1, E2F7 and MYBL2 in hPSCs transfected with miR-29a mimics (29a OE) compared with cells transfected with scramble control (CTRL). Numerical data are represented as average fold change (DeltaDeltaCT) +- standard error of the mean (SEM); ** p < 0.01; n = 3. b Total protein harvested from the hPSCs transfected with scramble control (CTRL) or miR-29a mimics (29a OE) 48 h post-transfection were subjected to western blot analysis for miR-29a candidate targets of ITGA6, ADAMTS2, IGF-1, COL5A3, CLDN1, E2F7 and MYBL2. GAPDH was used as the loading control. Quantification of band intensities normalized to GAPDH. Quantification of band intensities normalized to GAPDH and relative to respective controls are represented as +- SEM; n = 3, * p < 0.05, ** p < 0.01, *** p < 0.001 (right). Uncropped blots are shown in Additional file 3 : Fig. S1