Explore
 Validate
 Learn
Learn Western blot
 Other assay
Antibody data
- Antibody Data
- Antigen structure
- References [1]
- Comments [0]
- Validations
- Other assay [1]
Submit
Validation data
Reference
Comment
Report error
- Product number
- PA5-18202 - Provider product page

- Provider
- Invitrogen Antibodies
- Product name
- FANCF Polyclonal Antibody
- Antibody type
- Polyclonal
- Antigen
- Synthetic peptide
- Description
- This antibody is tested in Peptide ELISA: antibody detection limit dilution 32,000.
- Reactivity
- Human
- Host
- Goat
- Isotype
- IgG
- Vial size
- 100 μg
- Concentration
- 0.5 mg/mL
- Storage
- -20°C, Avoid Freeze/Thaw Cycles
Submitted references Delineating the role of FANCA in glucose-stimulated insulin secretion in β cells through its protein interactome.
Lagundžin D, Hu WF, Law HCH, Krieger KL, Qiao F, Clement EJ, Drincic AT, Nedić O, Naldrett MJ, Alvarez S, Woods NT
PloS one 2019;14(8):e0220568
PloS one 2019;14(8):e0220568
No comments: Submit comment
Supportive validation
- Submitted by
- Invitrogen Antibodies (provider)
- Main image
- Experimental details
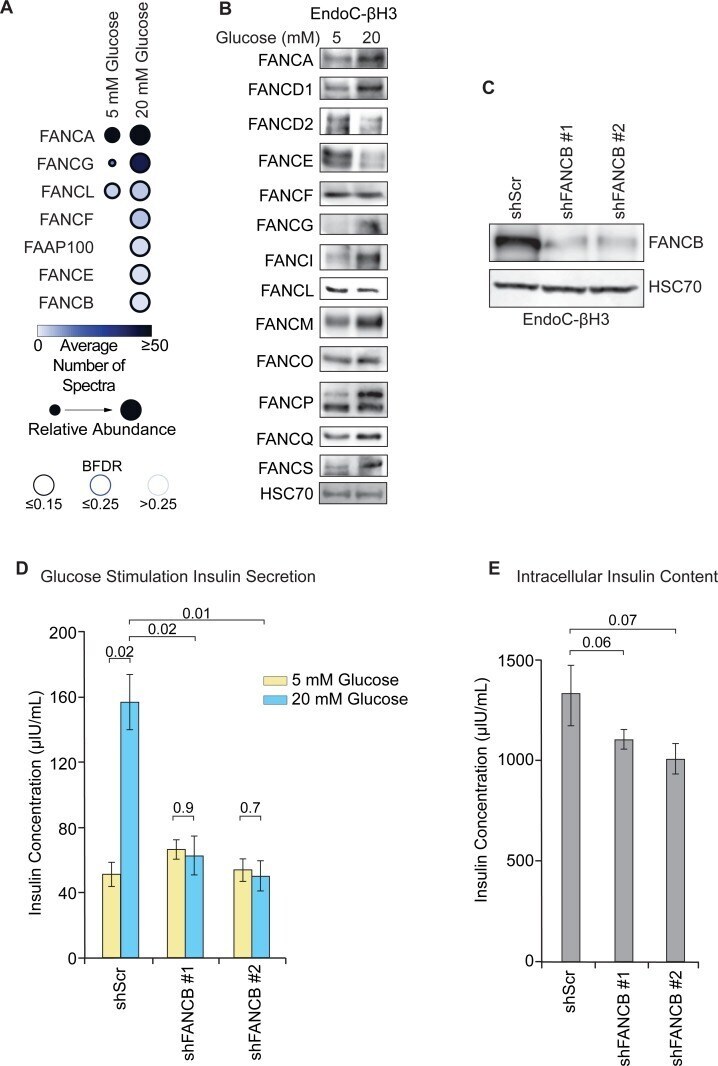
- Fig 5 FA core complex assembly and FA protein expression in EndoC-betaH3 cells in response to glucose stimulation. A. Dot Plot of FA proteins identified in the FANCA co-IP analysis between 5 mM and 20 mM glucose conditions in EndoC-betaH3 cells. Dot size represents relative abundance. Dot color indicates the average number of spectra in each experiment. BFDR is represented by the outline shading. B. Expression of a panel of FA proteins in EndoC-betaH3 cells cultured in either 5 mM or 20 mM glucose for 1 hour determined by western blot. C. Confirmation of FANCB knockdown by shRNA (shFANCB) compared to non-targeting scrambled control shRNA (shScr) in EndoC-betaH3 cells. D. GSIS profiles in EndoC-betaH3 shScr or shFANCB transduced cells. Paired two-tailed Student's t-test p -values are displayed in the indicated comparisons above the graph. n = 3, mean +/- SEM, n.s. = not statistically significant. E. Intracellular insulin content of shScr or shFANCB EndoC-betaH3 cells used in the GSIS assays in panel C. Paired two-tailed Student's t-test p -values are displayed in the indicated comparisons above the graph. n = 3, mean +/- SEM.