Explore
 Validate
 Learn
Learn Western blot
 Immunocytochemistry
 Immunoprecipitation
Antibody data
- Antibody Data
- Antigen structure
- References [3]
- Comments [0]
- Validations
- Immunocytochemistry [2]
- Other assay [4]
Submit
Validation data
Reference
Comment
Report error
- Product number
- PA5-17245 - Provider product page

- Provider
- Invitrogen Antibodies
- Product name
- CDCP1 Polyclonal Antibody
- Antibody type
- Polyclonal
- Antigen
- Synthetic peptide
- Description
- It is not recommended to aliquot this antibody.
- Reactivity
- Human
- Host
- Rabbit
- Isotype
- IgG
- Vial size
- 100 μL
- Concentration
- 32 μg/mL
- Storage
- -20°C
Submitted references The PDGFRβ/ERK1/2 pathway regulates CDCP1 expression in triple-negative breast cancer.
Cub domain-containing protein 1 negatively regulates TGF-β signaling and myofibroblast differentiation.
CDCP1 is a novel marker of the most aggressive human triple-negative breast cancers.
Forte L, Turdo F, Ghirelli C, Aiello P, Casalini P, Iorio MV, D'Ippolito E, Gasparini P, Agresti R, Belmonte B, Sozzi G, Sfondrini L, Tagliabue E, Campiglio M, Bianchi F
BMC cancer 2018 May 23;18(1):586
BMC cancer 2018 May 23;18(1):586
Cub domain-containing protein 1 negatively regulates TGF-β signaling and myofibroblast differentiation.
Noskovičová N, Heinzelmann K, Burgstaller G, Behr J, Eickelberg O
American journal of physiology. Lung cellular and molecular physiology 2018 May 1;314(5):L695-L707
American journal of physiology. Lung cellular and molecular physiology 2018 May 1;314(5):L695-L707
CDCP1 is a novel marker of the most aggressive human triple-negative breast cancers.
Turdo F, Bianchi F, Gasparini P, Sandri M, Sasso M, De Cecco L, Forte L, Casalini P, Aiello P, Sfondrini L, Agresti R, Carcangiu ML, Plantamura I, Sozzi G, Tagliabue E, Campiglio M
Oncotarget 2016 Oct 25;7(43):69649-69665
Oncotarget 2016 Oct 25;7(43):69649-69665
No comments: Submit comment
Supportive validation
- Submitted by
- Invitrogen Antibodies (provider)
- Main image

- Experimental details
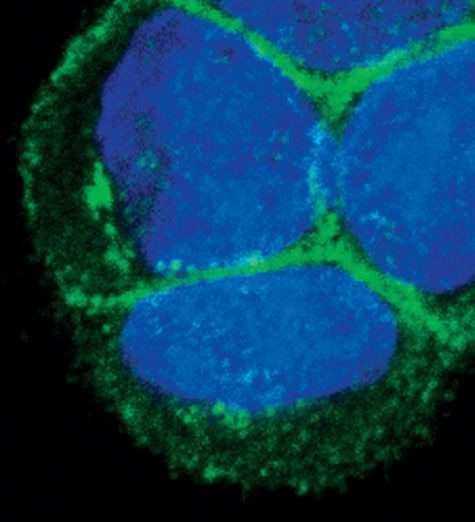
- Immunofluorescent analysis of CDCP1 in HT-29 cells using a CDCP1 polyclonal antibody (Product # PA5-17245) (green). DNA is labeled using a fluorescent blue dye.
- Submitted by
- Invitrogen Antibodies (provider)
- Main image
- Experimental details
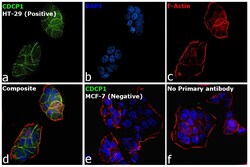
- Immunofluorescence analysis of CDCP1 was performed using 70% confluent log phase HT-29 cells. The cells were fixed with 4% paraformaldehyde for 10 minutes, permeabilized with 0.1% Triton™ X-100 for 15 minutes, and blocked with 2% BSA for 1 hour at room temperature. The cells were labeled with CDCP1 Polyclonal Antibody (Product # PA5-17245) at 1:100 dilution in 0.1% BSA, incubated at 4 degree celsius overnight and then labeled with Donkey anti-Rabbit IgG (H+L) Highly Cross-Adsorbed Secondary Antibody, Alexa Fluor™ Plus 488 (Product # A32790, 1:2000 dilution), for 45 minutes at room temperature (Panel a: Green). Nuclei (Panel b: Blue) were stained with ProLong™ Diamond Antifade Mountant with DAPI (Product # P36962). F-actin (Panel c: Red) was stained withRhodamine Phalloidin (Product # R415, 1:300 dilution). Panel d represents the merged image showing membrane localization. Panel e represents MCF-7 is reported to be low CDCP1 expressing cell line and there was no signal observed in MCF-7 as expected. Panel f represents control cells with no primary antibody to assess background. The images were captured at 60x magnification.

Supportive validation
- Submitted by
- Invitrogen Antibodies (provider)
- Main image

- Experimental details
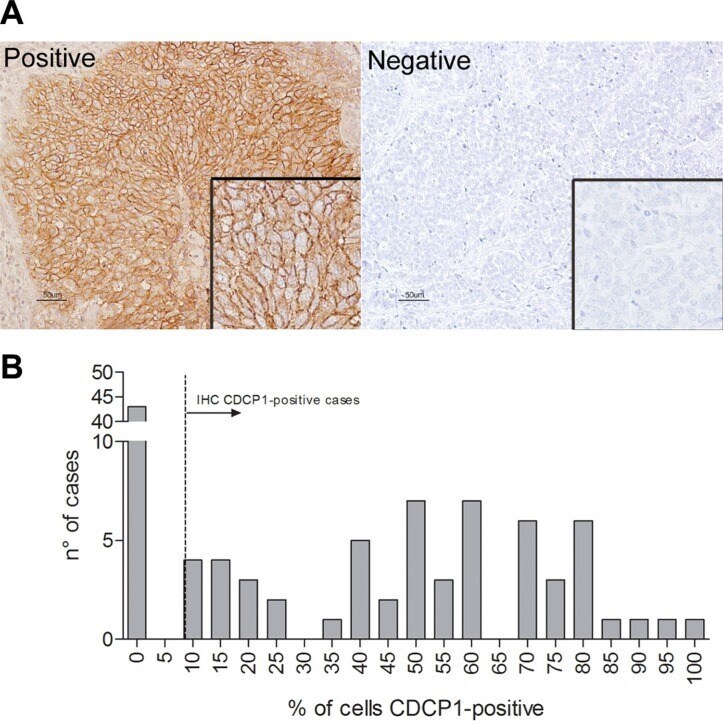
- Figure 6 CDCP1 expression in human primary TNBCs ( A ) FFPE TNBC sections were immunostained with polyclonal anti-CDCP1 (Thermo Fisher Scientific), and membrane staining intensity was scored as positive or negative as described in Materials and Methods. Scale bar: 50 mum (insets 2x). ( B ) Frequency distribution of human specimens by percentage of CDCP1-positive cells.
- Submitted by
- Invitrogen Antibodies (provider)
- Main image

- Experimental details
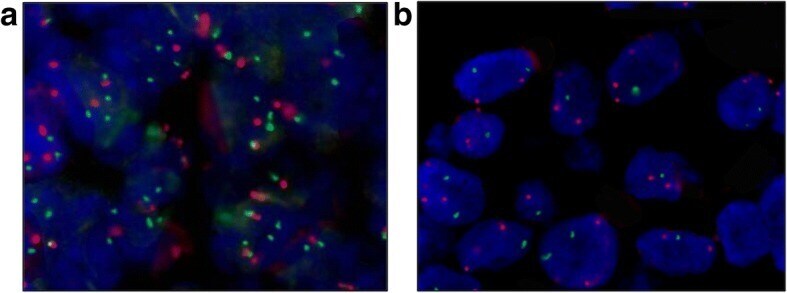
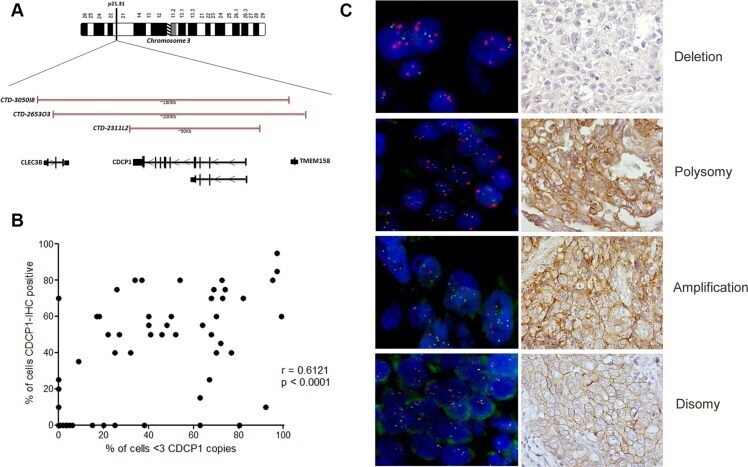
- Figure 7 Genetic alterations in CDCP1 in human primary TNBCs ( A ) Physical map of 3p21.31 region (spanning CDCP1 ), including genomic clones selected for FISH experiments covering the CDCP1 locus, their size in Kb, and the genes that they encompass. Maps are derived from University of California Santa Cruz Genome Browser ( http://genome.ucsc.edu/ ), with adaptations. ( B ) Representative images of dual-color FISH using CDCP1 /CEP3 probes on FFPE human primary TNBC specimens, showing tumor cells with: > 3 red signals for CEP3 and > 3 green signals for the CDCP1 locus (polysomy); < 3 signals for CEP3 and > 3 green signals for CDCP1 (amplification); < 3 signals for CEP3 and < 3 green signals for CDCP1 (disomy); and > 3 signals for CEP3 and < 3 green signals for the CDCP1 locus (deletion). ( C ) Correlation analysis between percentage of FISH-positive cells with percentage of IHC-positive cells ( n = 75; p < 0.0001; Pearson r = 0.6121; 95% confidence interval 0.4472 to 0.7367).
- Submitted by
- Invitrogen Antibodies (provider)
- Main image

- Experimental details
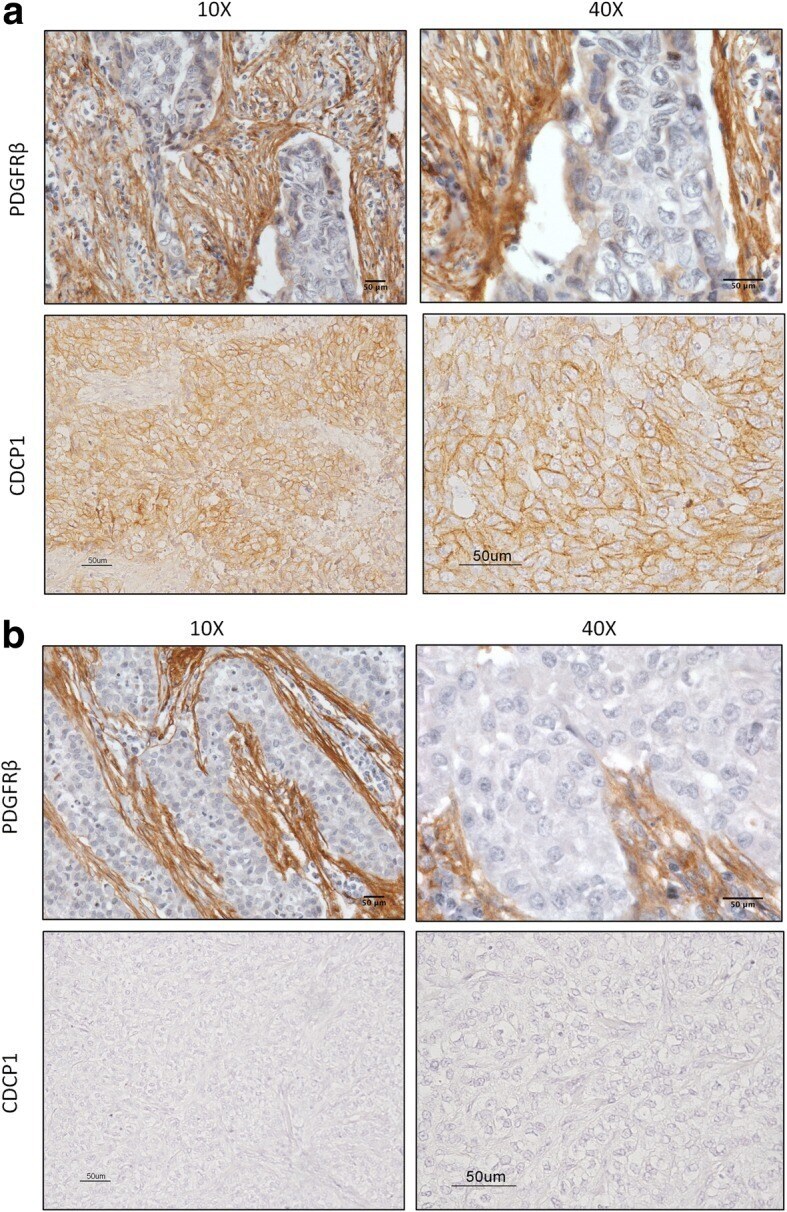
- Fig. 5 IHC staining of PDGFRbeta and CDCP1 in TNBC. FFPE sections of TNBC specimens were analyzed by IHC for PDGFRbeta and CDCP1. a Representative image of a PDGFRbeta- and CDCP1-positive case, with plasma membrane staining, at 10X and 40X magnification; b Representative image of a PDGFRbeta- and CDCP1-negative case, at 10X and 40X magnification
- Submitted by
- Invitrogen Antibodies (provider)
- Main image
- Experimental details
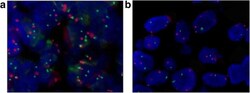
- Fig. 6 Genetic alterations of CDCP1 in TNBC. FFPE sections of TNBC specimens were analyzed by dual-color FISH using for CDCP1 genetic alteration CDCP1/CEP3 probes on a FFPE sections of TNBC specimens FISH. a Representative image of TNBC specimen positive for CDCP1 IHC staining, showing tumor cells with > 3 red signals for CEP3 and > 3 green signals for the CDCP1 locus (polysomy); b Representative image of TNBC specimen negative for CDCP1 IHC staining, showing tumor cells with > 3 signals for CEP3 and < 3 green signals for the CDCP1 locus (deletion)