Explore
 Validate
 Learn
LearnMA1-38000-A647
antibody from Invitrogen Antibodies
Targeting: TUBA1C
bcm948, MGC10851, MGC14580, TUBA6
 Immunocytochemistry
Antibody data
- Antibody Data
- Antigen structure
- References [1]
- Comments [0]
- Validations
- Immunocytochemistry [1]
- Other assay [1]
Submit
Validation data
Reference
Comment
Report error
- Product number
- MA1-38000-A647 - Provider product page

- Provider
- Invitrogen Antibodies
- Product name
- alpha Tubulin Monoclonal Antibody (TU-01), Alexa Fluor™ 647
- Antibody type
- Monoclonal
- Antigen
- Synthetic peptide
- Reactivity
- Human, Mouse
- Host
- Mouse
- Conjugate
- Red dye
- Isotype
- IgG
- Antibody clone number
- TU-01
- Vial size
- 50 µL
- Concentration
- 1 mg/mL
- Storage
- 4° C, store in dark, DO NOT FREEZE!
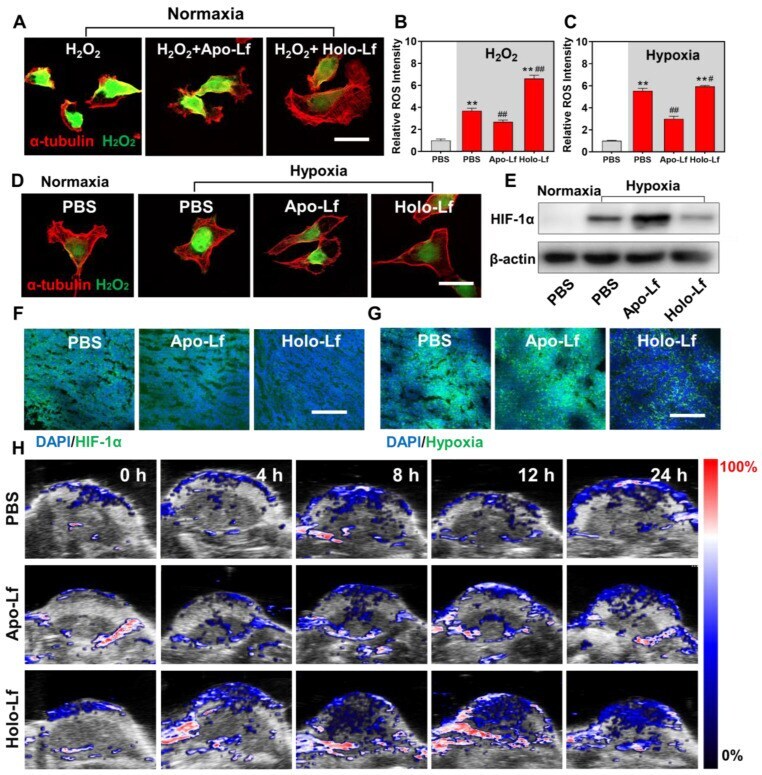
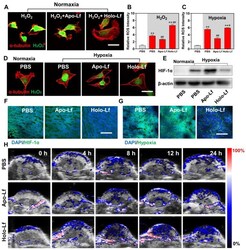
Submitted references Holo-lactoferrin: the link between ferroptosis and radiotherapy in triple-negative breast cancer.
Zhang Z, Lu M, Chen C, Tong X, Li Y, Yang K, Lv H, Xu J, Qin L
Theranostics 2021;11(7):3167-3182
Theranostics 2021;11(7):3167-3182
No comments: Submit comment
Supportive validation
- Submitted by
- Invitrogen Antibodies (provider)
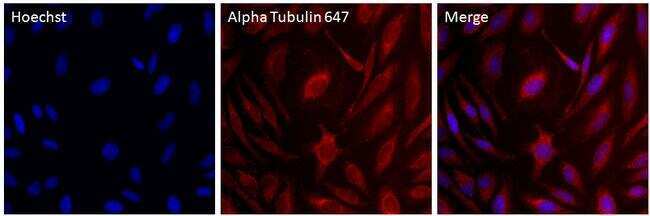
- Main image
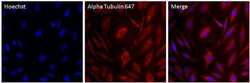
- Experimental details
- Immunofluorescent analysis of Alpha Tubulin (red) in HeLa cells. The cells were fixed with 4% Paraformaldehyde in PBS for 15 minutes at room temperature, and blocked with 3% BSA in PBS (Product # 37525) for 30 minutes at room temperature. Cells were stained with a Alpha Tubulin Monoclonal Antibody, AlexaFluor 647 conjugate (Product # MA1-38000-A647) at a dilution of 2.5 µg/mL in blocking buffer for 1 hour at room temperature protected from light. Nuclei (blue) were stained with Hoechst Dye (Product # 62249) at a dilution of 1:10,000 in blocking buffer. Images were taken on a Thermo Scientific ToxInsight Instrument at 20X magnification.
- Conjugate
- Red dye
Supportive validation
- Submitted by
- Invitrogen Antibodies (provider)
- Main image
- Experimental details
- Figure 7 Influence of Apo-Lf and Holo-Lf on hypoxia: (A) Intracellular H 2 O 2 CLSM images of MDA-MB-231 cells treated with H 2 O 2 , Apo-Lf+H 2 O 2 , and Holo-Lf+H 2 O 2 under normoxia. Scale bar, 30 mum. (B) Relative ROS intensity of MDA-MB-231 cells under normoxia (n = 3). (C) Relative ROS intensity of MDA-MB-231 cells incubated under normoxia and hypoxia (n = 3). (D) Intracellular H 2 O 2 CLSM images of MDA-MB-231 cells incubated with PBS under normoxia, and cells incubated with PBS, Apo-Lf, and Holo-Lf under hypoxia. Scale bar, 30 mum. (E) HIF-1alpha images of MDA-MB-231 cells incubated with PBS under normoxia, and cells incubated with PBS, Apo-Lf, and Holo-Lf under hypoxia. (Cells incubated in hypoxia for 12 h). (F-G) HIF-1alpha and hypoxia images of tumor slices collected from MDA-MB-231 tumor-bearing mice i.v. injected with PBS, Apo-Lf, and Holo-Lf (4 mg for each mouse). Scale bar, 200 mum. (H) In vivo photoacoustic imaging of MDA-MB-231 tumor-bearing mice injected with PBS, Apo-Lf, and Holo-Lf at different time points. Data are shown as mean +- SD. ** Compared with cells cultured under normoxia or PBS group P < 0.01. # Compared with cells cultured under hypoxia or PBS group P < 0.05. ## Compared with cells cultured under hypoxia or PBS group P < 0.01.
- Conjugate
- Red dye