 Explore
 Validate
 Learn
Learn Western blot
Antibody data
- Antibody Data
- Antigen structure
- References [14]
- Comments [0]
- Validations
- Western blot [1]
- Immunocytochemistry [2]
- Other assay [13]
Submit
Validation data
Reference
Comment
Report error
- Product number
- MA1-80189 - Provider product page

- Provider
- Invitrogen Antibodies
- Product name
- alpha Tubulin Monoclonal Antibody (YOL1/34)
- Antibody type
- Monoclonal
- Antigen
- Other
- Description
- Predicted to react with birds, fungi and all mammals based on sequence homology.
- Antibody clone number
- YOL1/34
- Concentration
- 1.0 mg/mL
Submitted references FAM83F regulates canonical Wnt signalling through an interaction with CK1α.
IMiDs induce FAM83F degradation via an interaction with CK1α to attenuate Wnt signalling.
LEA motifs promote desiccation tolerance in vivo.
Inducible Degradation of Target Proteins through a Tractable Affinity-Directed Protein Missile System.
Targeting Endogenous K-RAS for Degradation through the Affinity-Directed Protein Missile System.
Regulation of alternative polyadenylation in the yeast Saccharomyces cerevisiae by histone H3K4 and H3K36 methyltransferases.
A Noncanonical DNA Damage Checkpoint Response in a Major Fungal Pathogen.
Characterisation of the biochemical and cellular roles of native and pathogenic amelogenesis imperfecta mutants of FAM83H.
Dynein-mediated microtubule translocation powering neurite outgrowth in chick and Aplysia neurons requires microtubule assembly.
Amyloid-like Assembly Activates a Phosphatase in the Developing Drosophila Embryo.
Live-cell phenotypic-biomarker microfluidic assay for the risk stratification of cancer patients via machine learning.
PAWS1 controls Wnt signalling through association with casein kinase 1α.
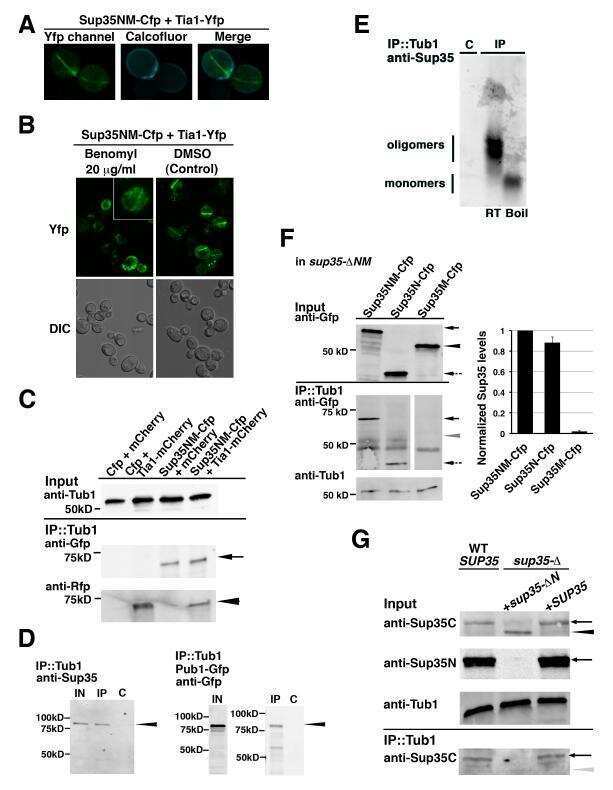
Functional role of Tia1/Pub1 and Sup35 prion domains: directing protein synthesis machinery to the tubulin cytoskeleton.
A coordinated interdependent protein circuitry stabilizes the kinetochore ensemble to protect CENP-A in the human pathogenic yeast Candida albicans.
Dunbar K, Jones RA, Dingwell K, Macartney TJ, Smith JC, Sapkota GP
Life science alliance 2021 Feb;4(2)
Life science alliance 2021 Feb;4(2)
IMiDs induce FAM83F degradation via an interaction with CK1α to attenuate Wnt signalling.
Dunbar K, Macartney TJ, Sapkota GP
Life science alliance 2021 Feb;4(2)
Life science alliance 2021 Feb;4(2)
LEA motifs promote desiccation tolerance in vivo.
Hibshman JD, Goldstein B
BMC biology 2021 Dec 14;19(1):263
BMC biology 2021 Dec 14;19(1):263
Inducible Degradation of Target Proteins through a Tractable Affinity-Directed Protein Missile System.
Simpson LM, Macartney TJ, Nardin A, Fulcher LJ, Röth S, Testa A, Maniaci C, Ciulli A, Ganley IG, Sapkota GP
Cell chemical biology 2020 Sep 17;27(9):1164-1180.e5
Cell chemical biology 2020 Sep 17;27(9):1164-1180.e5
Targeting Endogenous K-RAS for Degradation through the Affinity-Directed Protein Missile System.
Röth S, Macartney TJ, Konopacka A, Chan KH, Zhou H, Queisser MA, Sapkota GP
Cell chemical biology 2020 Sep 17;27(9):1151-1163.e6
Cell chemical biology 2020 Sep 17;27(9):1151-1163.e6
Regulation of alternative polyadenylation in the yeast Saccharomyces cerevisiae by histone H3K4 and H3K36 methyltransferases.
Kaczmarek Michaels K, Mohd Mostafa S, Ruiz Capella J, Moore CL
Nucleic acids research 2020 Jun 4;48(10):5407-5425
Nucleic acids research 2020 Jun 4;48(10):5407-5425
A Noncanonical DNA Damage Checkpoint Response in a Major Fungal Pathogen.
Shor E, Garcia-Rubio R, DeGregorio L, Perlin DS
mBio 2020 Dec 15;11(6)
mBio 2020 Dec 15;11(6)
Characterisation of the biochemical and cellular roles of native and pathogenic amelogenesis imperfecta mutants of FAM83H.
Tachie-Menson T, Gázquez-Gutiérrez A, Fulcher LJ, Macartney TJ, Wood NT, Varghese J, Gourlay R, Soares RF, Sapkota GP
Cellular signalling 2020 Aug;72:109632
Cellular signalling 2020 Aug;72:109632
Dynein-mediated microtubule translocation powering neurite outgrowth in chick and Aplysia neurons requires microtubule assembly.
McElmurry K, Stone JE, Ma D, Lamoureux P, Zhang Y, Steidemann M, Fix L, Huang F, Miller KE, Suter DM
Journal of cell science 2020 Apr 24;133(8)
Journal of cell science 2020 Apr 24;133(8)
Amyloid-like Assembly Activates a Phosphatase in the Developing Drosophila Embryo.
Nil Z, Hervás R, Gerbich T, Leal P, Yu Z, Saraf A, Sardiu M, Lange JJ, Yi K, Unruh J, Slaughter B, Si K
Cell 2019 Sep 5;178(6):1403-1420.e21
Cell 2019 Sep 5;178(6):1403-1420.e21
Live-cell phenotypic-biomarker microfluidic assay for the risk stratification of cancer patients via machine learning.
Manak MS, Varsanik JS, Hogan BJ, Whitfield MJ, Su WR, Joshi N, Steinke N, Min A, Berger D, Saphirstein RJ, Dixit G, Meyyappan T, Chu HM, Knopf KB, Albala DM, Sant GR, Chander AC
Nature biomedical engineering 2018 Oct;2(10):761-772
Nature biomedical engineering 2018 Oct;2(10):761-772
PAWS1 controls Wnt signalling through association with casein kinase 1α.
Bozatzi P, Dingwell KS, Wu KZ, Cooper F, Cummins TD, Hutchinson LD, Vogt J, Wood NT, Macartney TJ, Varghese J, Gourlay R, Campbell DG, Smith JC, Sapkota GP
EMBO reports 2018 Apr;19(4)
EMBO reports 2018 Apr;19(4)
Functional role of Tia1/Pub1 and Sup35 prion domains: directing protein synthesis machinery to the tubulin cytoskeleton.
Li X, Rayman JB, Kandel ER, Derkatch IL
Molecular cell 2014 Jul 17;55(2):305-18
Molecular cell 2014 Jul 17;55(2):305-18
A coordinated interdependent protein circuitry stabilizes the kinetochore ensemble to protect CENP-A in the human pathogenic yeast Candida albicans.
Thakur J, Sanyal K
PLoS genetics 2012;8(4):e1002661
PLoS genetics 2012;8(4):e1002661
No comments: Submit comment
Supportive validation
- Submitted by
- Invitrogen Antibodies (provider)
- Main image
- Experimental details
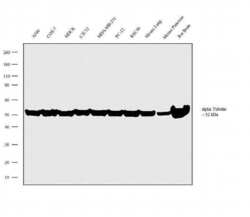
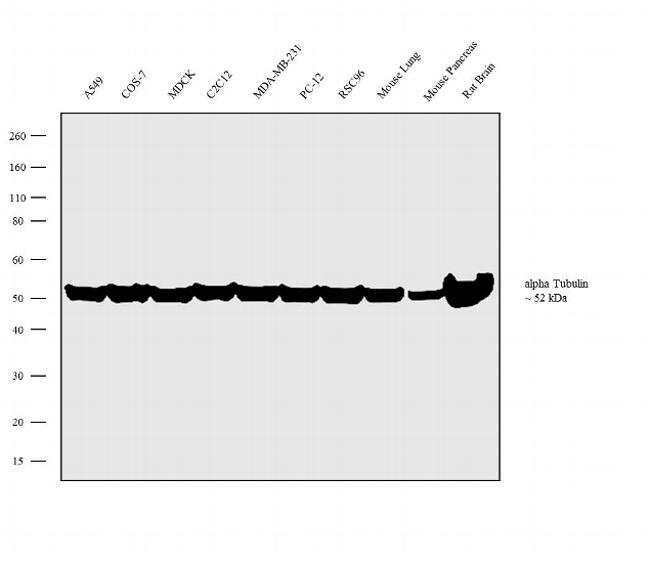
- Western blot analysis was performed on whole cell extracts (30µg lysate) of A549 (Lane 1), COS-7 (Lane 2), MDCK (Lane 3), C2C12 (Lane 4), MDA-MB-231 (Lane 5) PC-12 (Lane 6), RSC96 (Lane 7), tissue extracts of Mouse Lung (Lane 8), Mouse Pancreas (Lane 9) and Rat Brain (Lane 10). The blot was probed with Anti-alpha Tubulin Rat Monoclonal Antibody (Product # MA1-80189, 2µg/mL) and detected by chemiluminescence using Goat anti-Rat IgG2a Secondary Antibody, HRP conjugate (Product # PA1-84709, 0.4µg/mL, 1:2500 dilution). A 52 kDa band corresponding to alpha Tubulin was observed across the cell lines and tissues tested. Known quantity of protein samples were electrophoresed using Novex® NuPAGE® 4-12 % Bis-Tris gel (Product # NP0321BOX), XCell SureLock™ Electrophoresis System (Product # EI0002) and Novex® Sharp Pre-Stained Protein Standard (Product # LC5800). Resolved proteins were then transferred onto a nitrocellulose membrane with iBlot® 2 Dry Blotting System (Product # IB21001). The membrane was probed with the relevant primary and secondary Antibody following blocking with 5 % skimmed milk. Chemiluminescent detection was performed using Pierce™ ECL Western Blotting Substrate (Product # 32106).
Supportive validation
- Submitted by
- Invitrogen Antibodies (provider)
- Main image
- Experimental details
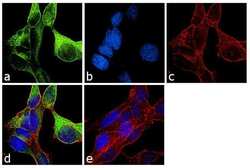
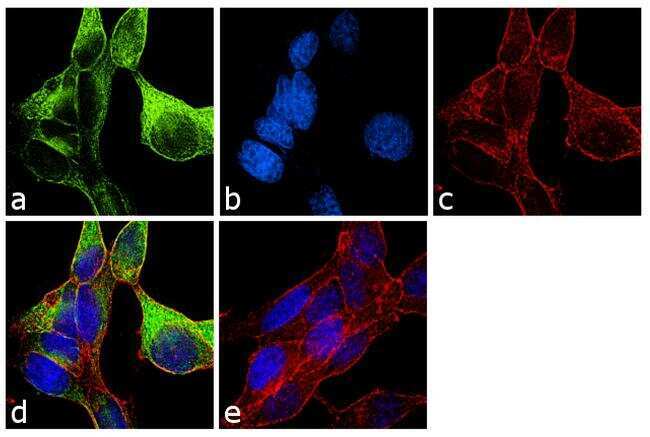
- Immunofluorescence analysis of alpha Tubulin was performed using 70% confluent log phase LNCaP cells. The cells were fixed with 4% paraformaldehyde for 10 minutes, permeabilized with 0.1% Triton™ X-100 for 10 minutes, and blocked with 1% BSA for 1 hour at room temperature. The cells were labeled with alpha Tubulin (YOL1/34) Rat Monoclonal Antibody (Product # MA1-80189) at 2µg/mL in 0.1% BSA and incubated for 3 hours at room temperature and then labeled with Goat anti-Rat IgG (H+L) Cross-Adsorbed Secondary Antibody, Alexa Fluor 488 (Product # A-11006) at a dilution of 1:2000 for 45 minutes at room temperature (Panel a: green). Nuclei (Panel b: blue) were stained with SlowFade® Gold Antifade Mountant with DAPI (Product # S36938). F-actin (Panel c: red) was stained with Rhodamine Phalloidin (Product # R415, 1:300). Panel d represents the merged image showing cytoplasmic localization. Panel e shows the no primary antibody control. The images were captured at 60X magnification.
- Submitted by
- Invitrogen Antibodies (provider)
- Main image
- Experimental details
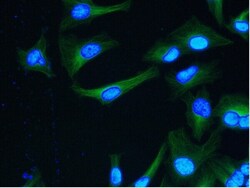
- Immunocytochemistry analysis of alpha Tubulin in HeLa cells. Samples were incubated in alpha Tubulin Monoclonal antibody (Product # MA1-80189). Green, nuclei are counterstained with DAPI.

Supportive validation
- Submitted by
- Invitrogen Antibodies (provider)
- Main image

- Experimental details
- NULL
- Submitted by
- Invitrogen Antibodies (provider)
- Main image
- Experimental details
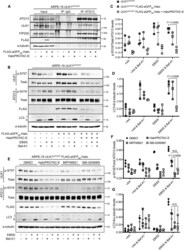
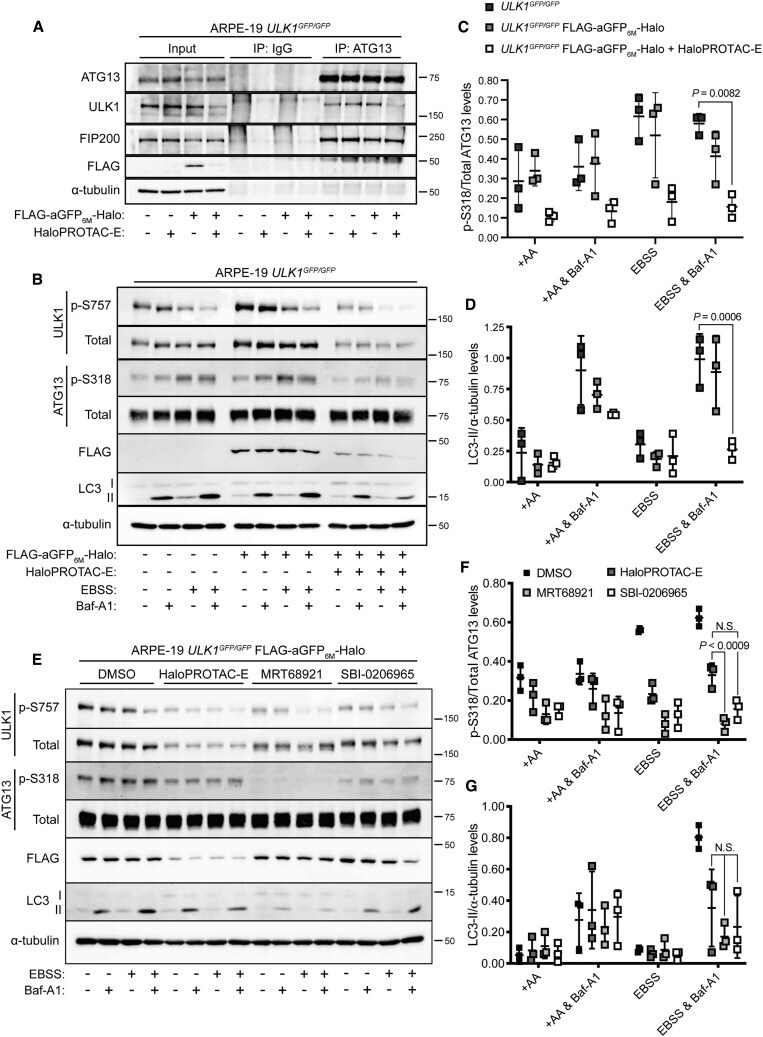
- Figure 5 HaloPROTAC-E L-AdPROM-mediated GFP-ULK1 Degradation Inhibits Starvation-Induced Autophagy (A) ARPE-19 ULK1 GFP/GFP FLAG-empty and FLAG-aGFP 6M -Halo-expressing cells were treated with 250 nM HaloPROTAC-E for 24 h and subjected to ATG13 or IgG IP. (B) ARPE-19 ULK1 GFP/GFP FLAG-empty and FLAG-aGFP 6M -Halo-expressing cells were pre-treated with 250 nM HaloPROTAC-E for 24 h followed by either EBSS or 50 nM Bafilomycin-A1 (Baf-A1) for 2 h. (C and D) Quantification of (C) p-S318 ATG13 normalized to total ATG13 protein levels and (D) LC3-II protein levels normalized to alpha-tubulin from (B) +- SD of n = 3 independent experiments. +AA indicates amino acid-rich conditions. (E) ARPE-19 ULK1 GFP/GFP FLAG-aGFP 6M -Halo-expressing cells were pre-treated with 250 nM HaloPROTAC-E for 24 h or with the ULK1 inhibitors MRT68921 (2 muM) or SBI-0206965 (5 muM) for 2 h followed by either EBSS or 50 nM Baf-A1 for 2 h. (F and G) Quantification of (F) p-S318 ATG13 normalized to total ATG13 protein levels and (G) LC3-II protein levels normalized to alpha-tubulin from (E) +- SD of n = 3 independent experiments. Statistical analyses were carried out by one-way analysis of variance using Tukey's post-test. For (A), (B), and (E), extracts and IPs were resolved by SDS-PAGE and transferred on to PVDF membranes, which were subjected to immunoblotting with indicated antibodies.
- Submitted by
- Invitrogen Antibodies (provider)
- Main image
- Experimental details
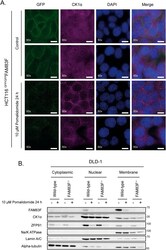
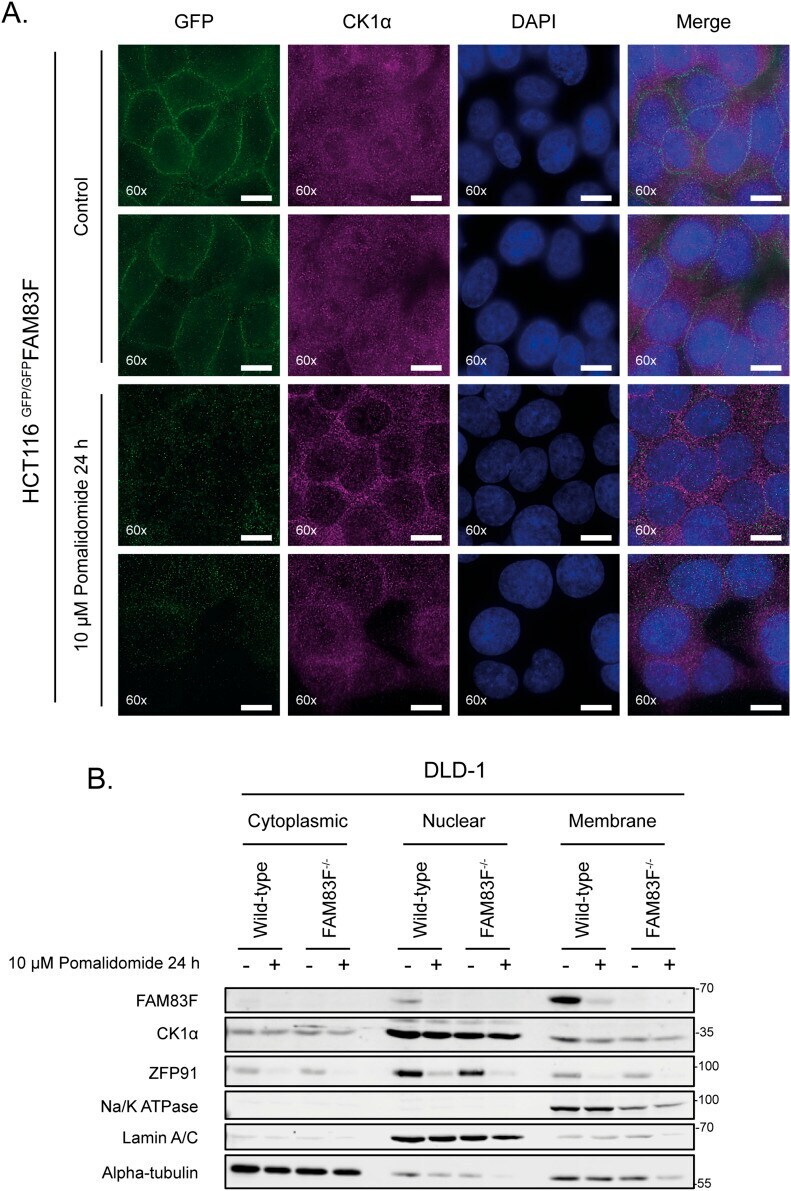
- Figure 2. FAM83F and CK1alpha protein abundance is reduced at the plasma membrane upon IMiD treatment. (A) Wide-field immunofluorescence microscopy of HCT116 GFP/GFP FAM83F knock-in cells, treated with or without 10 muM pomalidomide for 24 h, stained with antibodies recognising GFP (far left panels, green), and CK1alpha (second row of panels from left, magenta) as well as DAPI (third row of panels from left, blue). Overlay of GFP, CK1alpha, and DAPI images as a merged image is shown on the right. Immunofluorescence images were captured with a 60x objective. Scale bar represents 10 mum. Two representative images for each staining are shown. (B) Specific subcellular fractions from cytoplasmic, nuclear, and membrane compartments from DLD-1 wild-type and FAM83F -/- cells treated with or without 10 muM pomalidomide for 24 h, were resolved by SDS-PAGE and subjected to Western blotting with the indicated antibodies. Specificity of cytoplasmic, nuclear and membrane fractions were determined with Western blotting with compartment specific antibodies: alpha-tubulin (cytoplasmic), Lamin A/C (nuclear), and Na/K-ATPase (membrane). Source data are available for this figure. Source Data for Figure 2
- Submitted by
- Invitrogen Antibodies (provider)
- Main image
- Experimental details
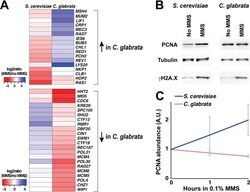
- FIG 6 Expression of PCNA is upregulated by DNA damage in S. cerevisiae but downregulated in C. glabrata . (A) Heatmaps of genes involved in maintenance of genome stability and differentially regulated by DNA damage in S. cerevisiae and C. glabrata . (B) PCNA protein levels increase in response to DNA damage in S. cerevisiae but not in C. glabrata . Cells were treated by 0.1% MMS by 2 h and then harvested for total cell lysates and Western blotting. Tubulin, alpha-tubulin. (C) Quantification of Western blot data from at least three biological replicates (Image J). For every condition, PCNA abundance (in arbitrary units [A.U.]) was normalized to that of alpha-tubulin.

- Submitted by
- Invitrogen Antibodies (provider)
- Main image
- Experimental details
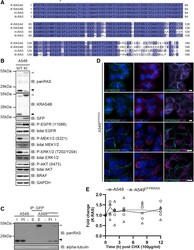
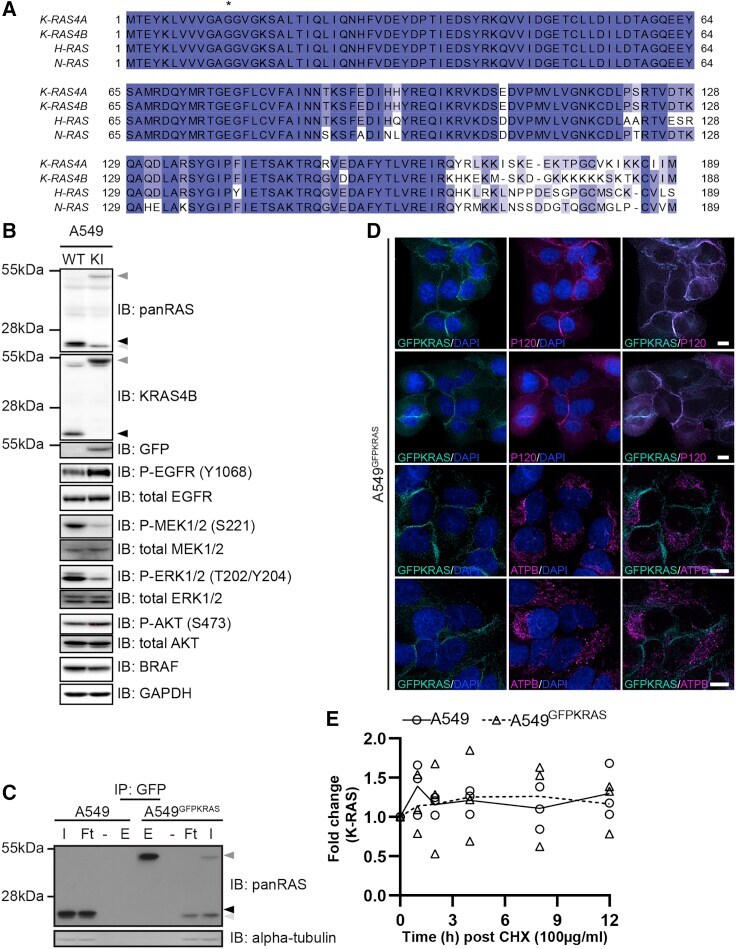
- Figure 1 Generation of GFP-K-RAS Knockin in A549 NSCLC Cells by CRISPR/Cas9 (A) Sequence Alignment of RAS protein isoforms K-RAS4A (UniProt: P01116-1 ), K-RAS4B (Uniprot: P01116-2 ), H-RAS (Uniprot: P01112-1 ), and N-RAS (Uniprot: P01111-1 ). Degrees of shading according to percentage sequence identity between the four proteins. Asterisk denotes frequently mutated G12 position. (B) A549 WT or K-RAS GFP/GFP knockin (KI; hereafter called A549 GFPKRAS ) cell lysates were separated by SDS-PAGE and the indicated antibodies were used for detection by western blotting. Arrows indicate different RAS species (black, unmodified K-RAS; dark gray, GFP-K-RAS; light gray, H-/N-RAS). (C) Lysates were processed as in (B) and subjected to immunoprecipitation with GFP-trap beads. I, input; Ft, flowthrough; E, elution. (D) Wide-field immunofluorescence microscopy of untreated A549 GFPKRAS cells labeled with antibodies specific for GFP (all left panels, cyan) and P120 (top two middle panels, magenta) or ATPB (bottom two middle panels, magenta), and DAPI (all left and middle panels, blue). Overlay of GFP and P120/ATPB is shown on the right. Scale bars, 10 mum. Two representative images for each staining are shown. (E) A549 WT (*) or A549 GFPKRAS (Delta) cells were treated with cycloheximide (100 mug/mL) and harvested at the indicated time points. Cell lysates were further processed as in (B). Intensities of bands corresponding to K-RAS or GFP-K-RAS were quantified and normalized to GAPDH. Individ
- Submitted by
- Invitrogen Antibodies (provider)
- Main image
- Experimental details
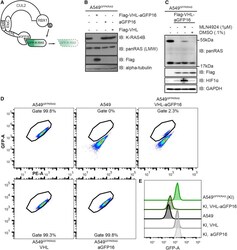
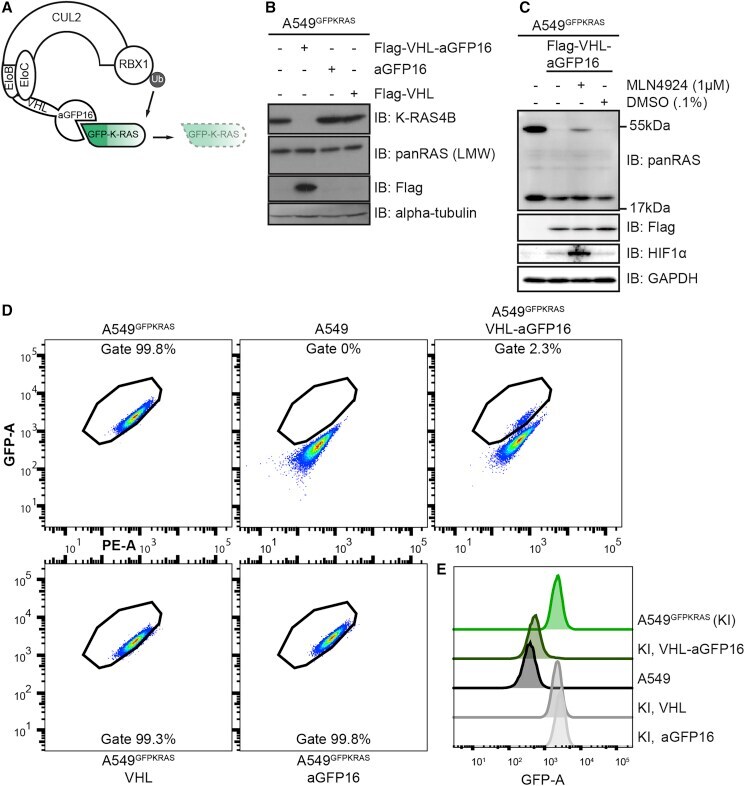
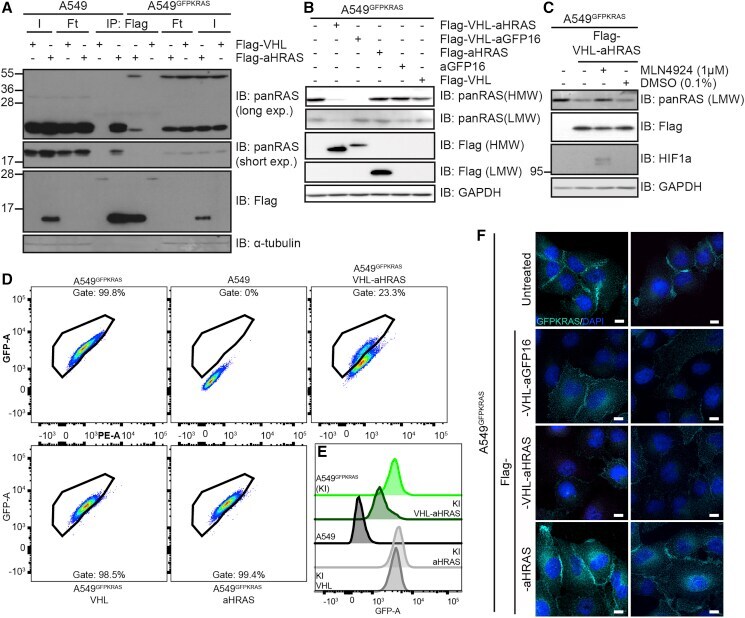
- Figure 2 AdPROM-Mediated Degradation of GFP-K-RAS (A) Schematic representation of the proteolytic AdPROM system. The high-affinity GFP-binder aGFP16 is fused to VHL, which is recruited by EloB and EloC to Cul2. aGFP16 recruits GFP-tagged K-RAS and presents it in close proximity to RBX1 in the assembled Cul2 complex. Ubiquitin (Ub) is transferred onto K-RAS, which is subsequently degraded (dashed lines and faded). (B) After treatment with retroviruses and selection, cell lysates of indicated cell lines were separated on SDS-PAGE and analyzed by western blotting using the indicated antibodies. (C) Indicated cell lines were treated with 1 muM MLN4924 in 0.1% DMSO, or just DMSO at 0.1% for 24 h. Samples were further processed as in (B). (D) Indicated cell lines were analyzed on a Canto flow cytometer. Shown populations were preselected for cells and single cells before defining the gate for GFP-positive cells (shown). GFP-A is plotted against PE-A in all cases. Numbers indicate percentage of cells within the respective gate. (E) Histogram representation of plots in (D). KI = A549 KRAS GFP/GFP cells (referred to as A549 GFPKRAS cells throughout text). Western blots are representative of at least three independent experiments. Flow cytometry data are representative of two independent experiments.
- Submitted by
- Invitrogen Antibodies (provider)
- Main image
- Experimental details
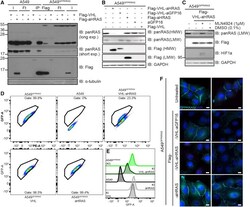
- Figure 3 Degradation of Endogenous RAS Using a RAS-Specific Monobody (A) Cell lysates of indicated cell lines were subjected to immunoprecipitation with anti-Flag beads. Input (I), flowthrough (Ft), and precipitates (IP) were run on SDS-PAGE and subjected to western blotting with the respective antibodies. (B) After retroviral transduction and selection, cell lysates of indicated cell lines were separated on SDS-PAGE and analyzed by western blotting using the indicated antibodies. (C) Indicated cell lines were treated with 1 muM MLN4924 or 0.1% DMSO for 24 h. Cell lysates were separated on SDS-PAGE and analyzed by western blotting using the indicated antibodies. (D) Indicated cell lines were analyzed on a Canto flow cytometer. Shown populations were preselected for cells and single cells before defining the gate for GFP-positive cells (shown). GFP-A is plotted against PE-A in all cases. Numbers indicate percentage of cells within the respective gate. (E) Histogram representation of plots in (D); KI = A549 GFPKRAS cells. (F) Wide-field immunofluorescence microscopy of indicated cell lines treated with anti-GFP antibody and DAPI for staining. Scale bars, 10 mum. Two representative images are shown for each condition. Western blots and immunofluorescence data are representative of at least three independent experiments. Flow cytometry data are representative of two independent experiments.
- Submitted by
- Invitrogen Antibodies (provider)
- Main image

- Experimental details
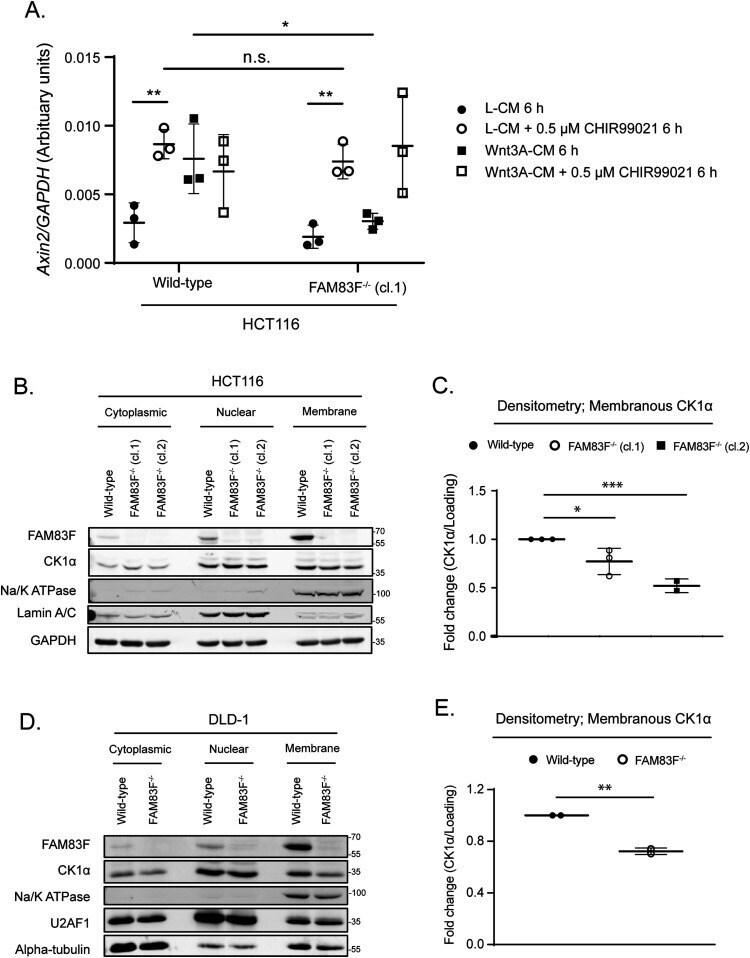
- Figure 5. FAM83F acts upstream of glycogen synthase kinase-3beta and the loss of FAM83F protein reduces casein kinase 1alpha (CK1alpha) protein abundance at the plasma membrane. (A) qRT-PCR was performed using cDNA from HCT116 wild-type and HCT116 FAM83F -/- (cl.1) cell lines following treatment with L-CM or Wnt3A-CM with or without 0.5 muM CHIR99021 for 6 h, and primers for Axin2 and GAPDH genes. Axin2 mRNA expression was normalised to GAPDH mRNA expression and represented as arbitrary units. Data presented as scatter graph illustrating individual data points with an overlay of the mean +- SD. (B) Cytoplasmic, nuclear, and membrane lysates from HCT116 wild-type, HCT116 FAM83F -/- (cl.1), and HCT116 FAM83F -/- (cl.2) cell lines were resolved by SDS-PAGE and subjected to Western blotting with indicated antibodies. (C) Densitometry of CK1alpha protein abundance from (B) membrane lysates normalised to GAPDH protein abundance and represented as fold change compared with HCT116 wild-type cells. Data presented as scatter graph illustrating individual data points with an overlay of the mean +- SD. (D) Cytoplasmic, nuclear, and membrane lysates from DLD-1 wild-type and DLD-1 FAM83F -/- cell lines were resolved by SDS-PAGE and subjected to Western blotting with indicated antibodies. (E) Densitometry of CK1alpha protein abundance from (D) membrane lysates normalised to Na/K ATPase protein abundance and represented as fold change compared with DLD-1 wild-type cells. Data presented as sc
- Submitted by
- Invitrogen Antibodies (provider)
- Main image

- Experimental details
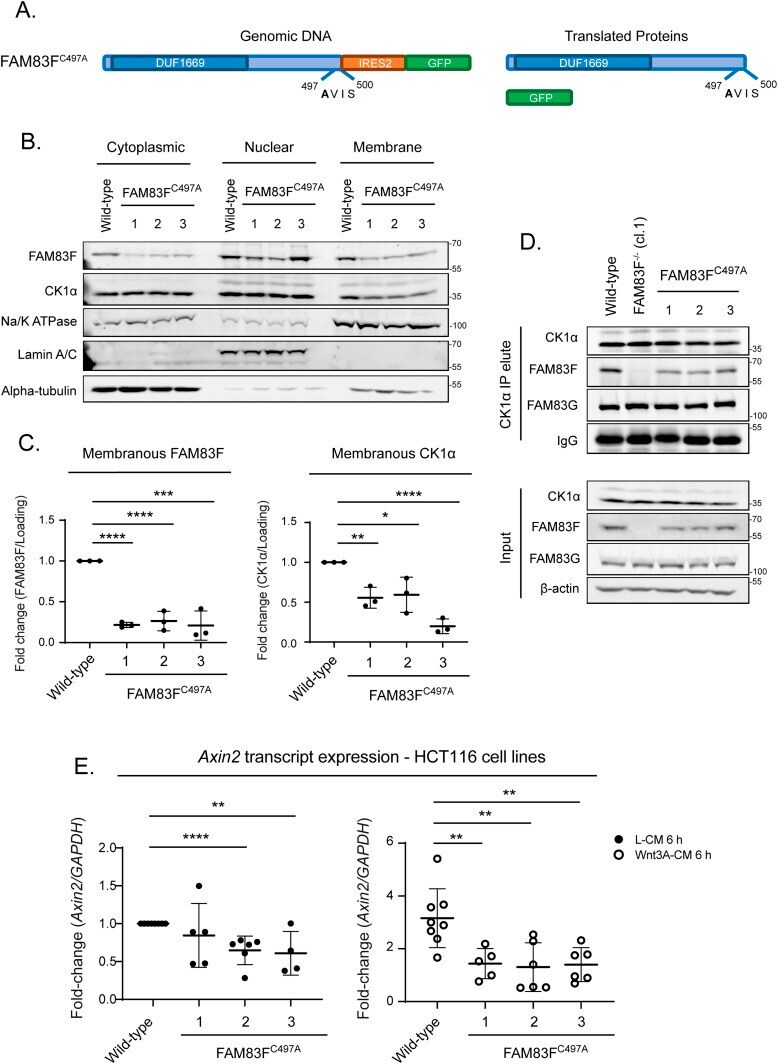
- Figure 6. Membranous localisation of FAM83F is required for FAM83F''s role in canonical Wnt signalling. (A) Cartoon of the FAM83F C497A knock-in strategy illustrating the genomic DNA sequence in which the C497A point mutation is knocked-in to FAM83F along with an IRES2 (Internal ribosome entry sequence) and GFP coding sequence which are inserted after the FAM83F protein coding sequence and the eventual translated proteins. (B) Cytoplasmic, nuclear and membrane lysates from HCT116 wild-type and HCT116 FAM83F C497A (clones 1-3) cell lines were resolved by SDS-PAGE and subjected to Western blotting with indicated antibodies. The specificity of cytoplasmic, nuclear and membrane compartment lysates was determined by Western blotting with the following subcellular compartment-specific antibodies: alpha-tubulin (cytoplasmic), Lamin A/C (nuclear), and Na/K ATPase (membrane). (C) Quantification of FAM83F and casein kinase 1alpha (CK1alpha) protein abundance in membrane enriched fractions from (B). FAM83F and CK1alpha protein abundance is normalised to loading control and presented as fold-change compared with HCT116 wild-type cells. Data presented as scatter graph illustrating individual data points with an overlay of the mean +- SD. (D) Cell lysates from HCT116 wild-type, HCT116 FAM83F -/- (cl.1), and HCT116 FAM83F C497A (clones 1-3) cell lines were subjected to immunoprecipitation with anti-CK1alpha antibody. Input lysates and CK1alpha IP elutes were resolved by SDS-PAGE and subject
- Submitted by
- Invitrogen Antibodies (provider)
- Main image

- Experimental details
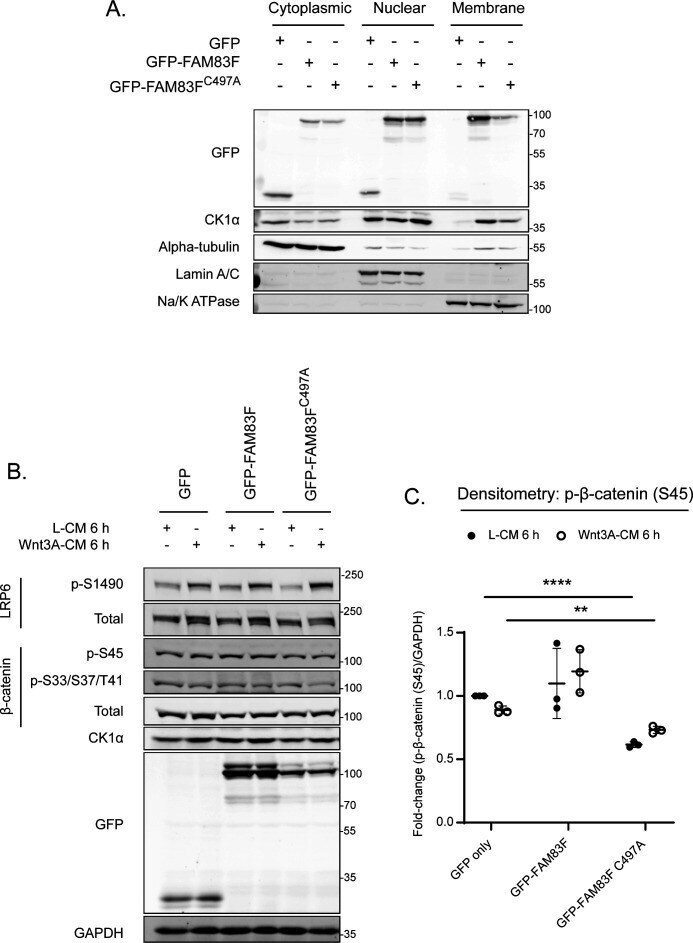
- Figure S11. U2OS Flp/Trx GFP-FAM83F C497A protein expression reduces cytoplasmic casein kinase 1alpha (CK1alpha) and phosphorylated beta-catenin (Serine 45) protein levels. (A) Cytoplasmic, nuclear, and membrane lysates from U2OS Flp/Trx (GFP only, GFP-FAM83F, and GFP-FAM83F C497A ) cells were resolved by SDS-PAGE and subjected to Western blotting with the indicated antibodies. The specificity of cytoplasmic, nuclear and membrane compartment lysates were determined by Western blotting with the following subcellular compartment-specific antibodies: alpha-tubulin (cytoplasmic), Lamin A/C (nuclear), Na/K ATPase (membrane). (B) Lysates from U2OS Flp/Trx (GFP only, GFP-FAM83F and GFP-FAM83F C497A ) cells following treatment with L-CM or Wnt3A-CM for 6 h were resolved by SDS-PAGE and subjected to Western blotting with the indicated antibodies. (C) Densitometry of p-beta-catenin (S45) protein abundance from (B) normalised to GAPDH protein abundance and represented as fold change compared to U2OS Flp/Trx cells expressing GFP only. Data presented as scatter graph illustrating individual data points with an overlay of the mean +- SD. Statistical significance was determined using a Student''s unpaired t test and comparing cell lines as denoted on graphs. Statistically significant P -values are denoted by asterisks (**** < 0.0001, *** < 0.001, ** < 0.01, * < 0.05). Expression of GFP, GFP-FAM83F, and GFP-FAM83F C497A in U2OS Flp/Trx cells was induced by a treatment with 20 ng/ml doxycycli
- Submitted by
- Invitrogen Antibodies (provider)
- Main image
- Experimental details
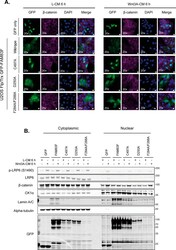
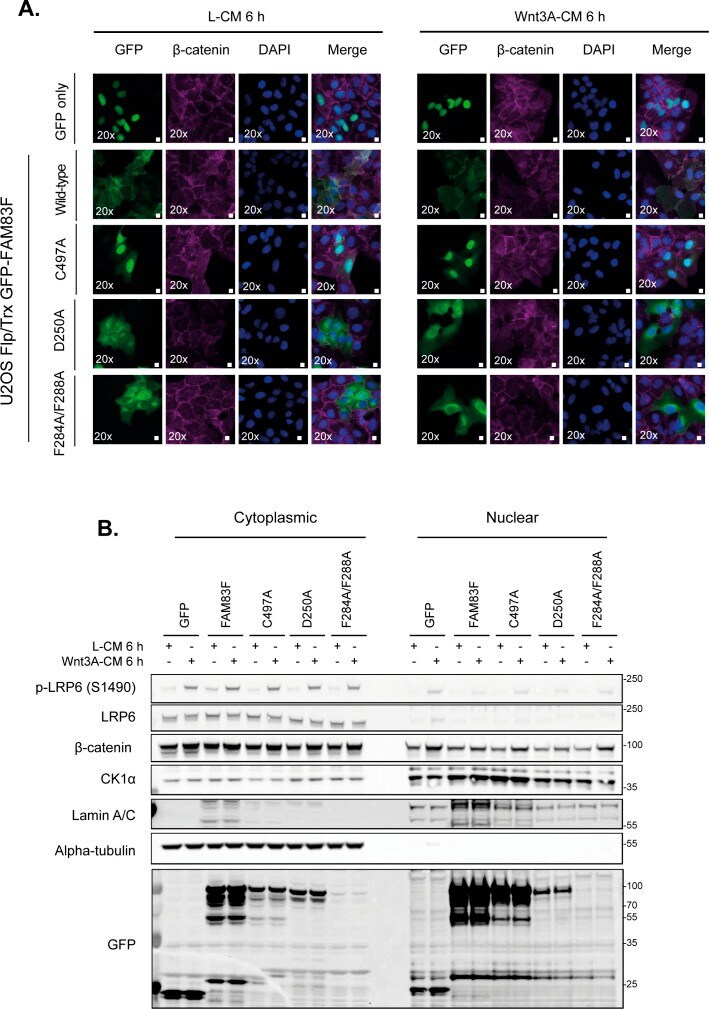
- Figure S4. Effect of overexpression of GFP-FAM83F proteins on nuclear translocation of beta-catenin. (A) Representative widefield immunofluorescence microscopy images of U2OS Flp/Trx cells expressing GFP only, GFP-FAM83F, GFP-FAM83F C497A , GFP-FAM83F D250A , or GFP-FAM83F F284A/F288A , labelled with antibodies recognising GFP (far left panels, green), beta-catenin (second row of panels from left, magenta) and DAPI (third row of panels from left, blue). Overlay of GFP, beta-catenin, and DAPI images as a merge is shown on the right. Cells were treated with either L- or Wnt3A-conditioned media for 6 h. Immunofluorescence images captured with a 20x objective. Scale bar represents 10 mum. (B) Cytoplasmic and nuclear extracts from U2OS Flp/Trx cells expressing GFP only, GFP-FAM83F, GFP-FAM83F C497A , GFP-FAM83F D250A , or GFP-FAM83F F284A/F288A following treatment with either L- or Wnt3A-conditioned media for 6 h, were resolved by SDS-PAGE and subjected to Western blotting with indicated antibodies. The specificity of cytoplasmic and nuclear lysates was determined by Western blotting with the following subcellular compartment-specific antibodies: alpha-tubulin (cytoplasmic) and Lamin A/C (nuclear). Expression of GFP tagged proteins in U2OS Flp/Trx cells was induced by a treatment with 20 ng/ml doxycycline for 24 h. Source data are available for this figure. Source Data for Figure S4
- Submitted by
- Invitrogen Antibodies (provider)
- Main image
- Experimental details
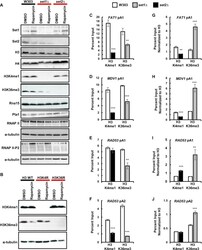
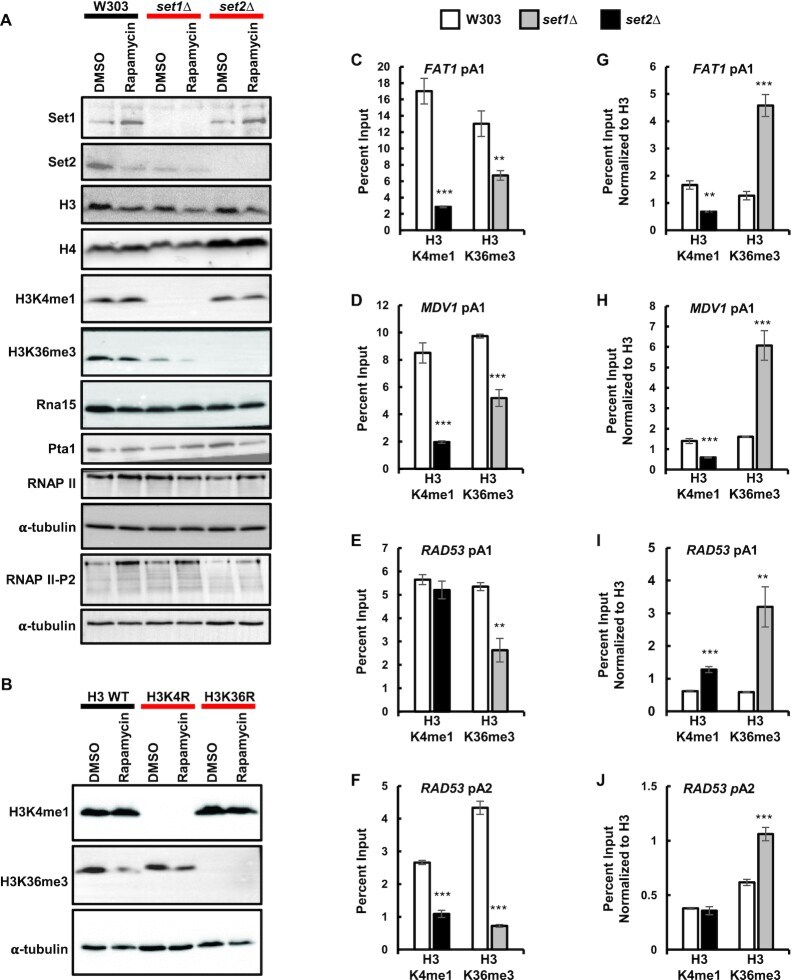
- Figure 4. Set1 and Set2 modulate each other. ( A ) Protein levels of Set1, Set2, histone H3, histone H4, H3K4me1, H3K36me3, RNAP II, RNAP II Ser2-P, Rna15 and Pta1 in wild-type, set1Delta and set2Delta backgrounds. ( B ) Protein levels of histone H3K4me1 and H3K36me3 in wild-type histone H3, histone H3K4R and H3K36R backgrounds. For panel A and B, whole cell extracts from exponentially growing cells in YPD media in the presence of 10 nM rapamycin (for 2 hours) or DMSO were resolved by SDS-PAGE and analyzed by Western blot. alpha-tubulin was used as a protein loading control. ( C-F ) ChIP of histone H3K4me1 and H3K36me3 to FAT1 , MDV1 and RAD53 pA sites in wild-type, set1Delta and set2Delta cells. ( G-J ) Same data as in (C-F) normalized to histone H3 ChIP from Figure 3 . Two biological replicates were performed for each gene. Bars show average values +- SD. ** P < 0.01, *** P < 0.001 (Student's t -test).
- Submitted by
- Invitrogen Antibodies (provider)
- Main image
- Experimental details
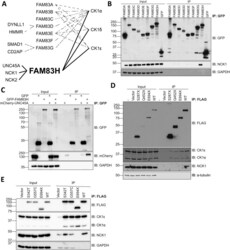
- Fig. 2 FAM83H interacts with NCK adaptor proteins. A Schematic diagram showing FAM83 proteins interact with CK1 isoforms and have unique interactors. B HEK-293 Flp-In T-REx cells that express GFP-FAM83 proteins under a doxycycline inducible promoter were treated with 20 ng/mL doxycycline for 24 h and GFP was pulled down from lysates then cell extracts (input) and pull downs (IP) were analysed by immunoblotting (IB). n = 3. C U2OS FAM83H -/- cells were transiently transfected with vectors encoding GFP, GFP-FAM83H and/or mCherry-UNC45A and lysates subjected to anti-GFP pull downs. Cell extracts (input) and pull downs (IP) were then analysed by Western blotting. n = 2. D Empty FLAG vector (vector), FLAG-FAM83H S287X , FLAG-FAM83H Q452X , FLAG-FAM83H E694X and FLAG-FAM83H WT were transiently transfected into U2OS FAM83H -/- cells. Untransfected U2OS FAM83H -/- cells (-) were used as an additional control. Anti-FLAG immunoprecipitations were performed on lysates and cell extracts (input) and immunoprecipitates (IP) were analysed by Western blotting. n = 3. E FLAG empty vector (vector), FLAG-FAM83H S342T , FLAG-FAM83H G557C , FLAG-FAM83H E694X and FLAG-FAM83H WT were transiently transfected into HEK-293 wild type cells. Anti-FLAG pull downs were performed on lysates then cell extracts (input) and immunoprecipitates (IP) were analysed by Western blotting. n = 1. Fig. 2
