Explore
 Validate
 Learn
Learn Western blot
 Immunocytochemistry
 Immunoprecipitation
Antibody data
- Antibody Data
- Antigen structure
- References [5]
- Comments [0]
- Validations
- Immunocytochemistry [2]
- Other assay [6]
Submit
Validation data
Reference
Comment
Report error
- Product number
- MA1-19451 - Provider product page

- Provider
- Invitrogen Antibodies
- Product name
- STIM1 Monoclonal Antibody (CDN3H4)
- Antibody type
- Monoclonal
- Antigen
- Synthetic peptide
- Description
- This antibody reacts with a cytoplasmic epitope of human and rodent STIM1, a 84 kDa essential and conserved regulator of store-operated Ca2+ channel function. Western Blot: Both reducing and non-reducing conditions; Immunocytochemistry: Methanol-acetone fixation.
- Reactivity
- Human, Mouse, Rat
- Host
- Mouse
- Isotype
- IgG
- Antibody clone number
- CDN3H4
- Vial size
- 100 μg
- Concentration
- 1 mg/mL
- Storage
- 4°C, do not freeze
Submitted references Immune Synapse Residency of Orai1 Alters Ca(2+) Response of T Cells.
Intracellular calcium leak lowers glucose storage in human muscle, promoting hyperglycemia and diabetes.
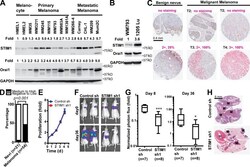
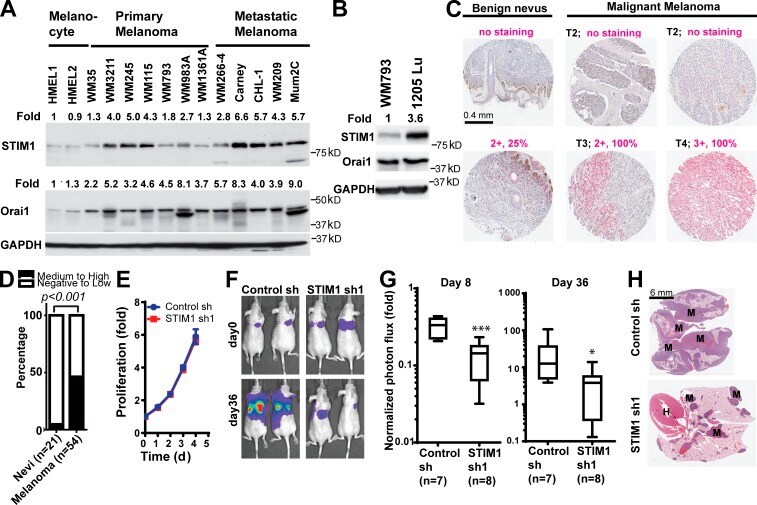
STIM1- and Orai1-mediated Ca(2+) oscillation orchestrates invadopodium formation and melanoma invasion.
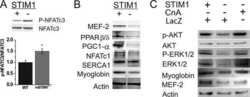
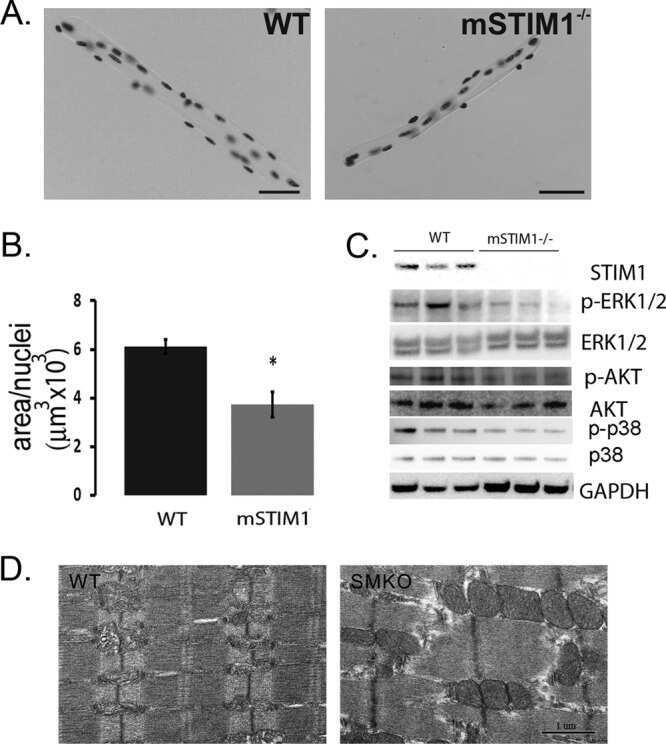
STIM1-Ca(2+) signaling is required for the hypertrophic growth of skeletal muscle in mice.
Impaired Orai1-mediated resting Ca2+ entry reduces the cytosolic [Ca2+] and sarcoplasmic reticulum Ca2+ loading in quiescent junctophilin 1 knock-out myotubes.
Voros O, Panyi G, Hajdu P
International journal of molecular sciences 2021 Oct 26;22(21)
International journal of molecular sciences 2021 Oct 26;22(21)
Intracellular calcium leak lowers glucose storage in human muscle, promoting hyperglycemia and diabetes.
Tammineni ER, Kraeva N, Figueroa L, Manno C, Ibarra CA, Klip A, Riazi S, Rios E
eLife 2020 May 4;9
eLife 2020 May 4;9
STIM1- and Orai1-mediated Ca(2+) oscillation orchestrates invadopodium formation and melanoma invasion.
Sun J, Lu F, He H, Shen J, Messina J, Mathew R, Wang D, Sarnaik AA, Chang WC, Kim M, Cheng H, Yang S
The Journal of cell biology 2014 Nov 24;207(4):535-48
The Journal of cell biology 2014 Nov 24;207(4):535-48
STIM1-Ca(2+) signaling is required for the hypertrophic growth of skeletal muscle in mice.
Li T, Finch EA, Graham V, Zhang ZS, Ding JD, Burch J, Oh-hora M, Rosenberg P
Molecular and cellular biology 2012 Aug;32(15):3009-17
Molecular and cellular biology 2012 Aug;32(15):3009-17
Impaired Orai1-mediated resting Ca2+ entry reduces the cytosolic [Ca2+] and sarcoplasmic reticulum Ca2+ loading in quiescent junctophilin 1 knock-out myotubes.
Li H, Ding X, Lopez JR, Takeshima H, Ma J, Allen PD, Eltit JM
The Journal of biological chemistry 2010 Dec 10;285(50):39171-9
The Journal of biological chemistry 2010 Dec 10;285(50):39171-9
No comments: Submit comment
Supportive validation
- Submitted by
- Invitrogen Antibodies (provider)
- Main image

- Experimental details
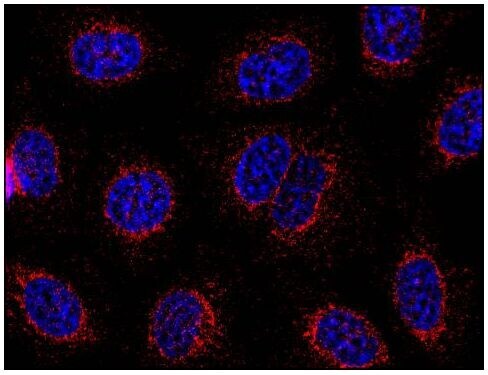
- Immunocytochemistry staining of HeLa human cervix carcinoma cell line using anti-STIM1 (CDN3H4; methanol-aceton fixation; detection by Goat anti-mouse IgG1 Alexa Fluor® 598; red) Monoclonal antibody (Product # MA1-19451). Nuclei were stained with DAPI (blue).
- Submitted by
- Invitrogen Antibodies (provider)
- Main image

- Experimental details
- Immunocytochemistry staining of HeLa human cervix carcinoma cell line using anti-STIM1 (CDN3H4; methanol-aceton fixation; detection by Goat anti-mouse IgG1 Alexa Fluor® 598; red) Monoclonal antibody (Product # MA1-19451). Nuclei were stained with DAPI (blue).

Supportive validation
- Submitted by
- Invitrogen Antibodies (provider)
- Main image
- Experimental details
- NULL
- Submitted by
- Invitrogen Antibodies (provider)
- Main image
- Experimental details
- NULL

- Submitted by
- Invitrogen Antibodies (provider)
- Main image

- Experimental details
- NULL
- Submitted by
- Invitrogen Antibodies (provider)
- Main image
- Experimental details
- Figure 6. SOCE is critical for melanoma metastasis. (A) Expression levels of STIM1 and Orai1 in human melanocytes and melanoma cell lines derived from primary melanoma or distant metastases. The relative levels of STIM1 and Orai1 were determined through densitometry using ImageJ software. (B) STIM1 expression was up-regulated in the highly metastatic 1205Lu subline of WM793 cells. (C) Immunohistochemistry staining showing STIM1 overexpression in malignant melanoma when compared with benign nevus. Staining intensity and percentage of positively stained lesion (in magenta) and melanoma T stages (T1-T4, in black) are indicated. (D) Proportions of benign nevi ( n = 21) and malignant melanoma ( n = 53) with medium to high expression of STIM1; P < 0.001 as determined by two-tailed Fisher's exact test. (E) STIM1 knockdown had no effect on the proliferation of 1205Lu cells in vitro. Data are shown as means +- SD from triplicates. The data shown are from a single experiment out of three repeats. (F-H) Inhibition of 1205Lu cell lung metastasis by STIM1 knockdown. (F) Representative bioluminescence images showing the lung metastasis of 1205Lu cells stably expressing control shRNA or STIM1 shRNA. (G) Quantification of 1205Lu cell lung metastasis using bioluminescence imaging. Normalized photon flux showed the fold increase in bioluminescence signals (on day 8 and day 36, respectively) over day 0. Box and whiskers are 25-75th and 10-90th percentiles, respectively. *, P < 0.05; ***, P
- Submitted by
- Invitrogen Antibodies (provider)
- Main image
- Experimental details
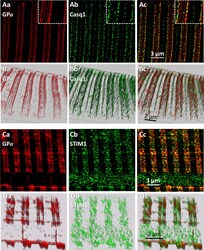
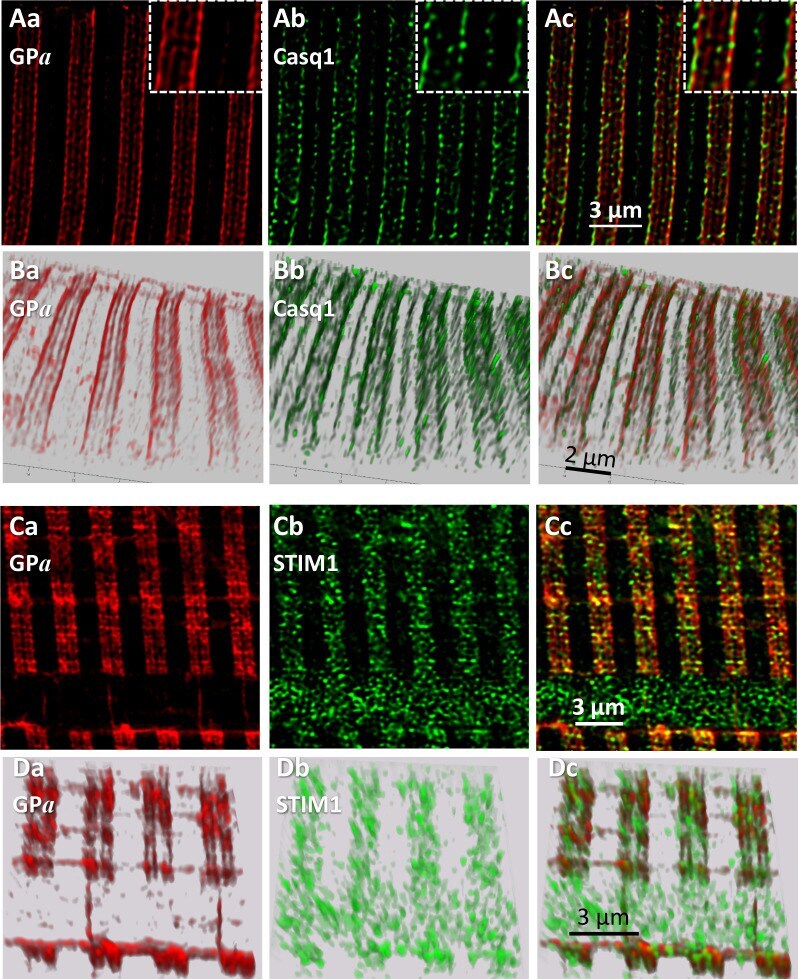
- Figure 5. Phosphorylated glycogen phosphorylase, GP a , localizes at SR. ( A ) Sections of a z -stack (corrected as in Figure 4 ) of human muscle co-stained for GP a and Casq1(I.D. #164, MHN). ( B ) 3-D renderings of the z -stacks that contained the sections in A. Both proteins delineate two terminal cisternae, TC, in every triad. The inset in Ac shows close proximity of the imaged proteins, without actual colocalization (documented with Figure 5--figure supplement 1 ). ( C, D ) Sections and stack from a human myofiber co-stained for GP a and STIM1 (I.D. #164, MHN). GP a delineates two TC in every triad (Ca, Da). STIM1 forms clusters in close proximity to the GP a bands, without actual colocalization. Minor quantities of both proteins are located outside triads. A large quantity of STIM1, unaccompanied by GP a , appears inside a nucleus (cf. (). These images are the first to resolve TC with conventional optics (a resolution of ~100 nm is estimated with Figure 5--figure supplement 2 ). Figure 5--figure supplement 1. Analysis of colocalization of GP a and STIM1. ( A ) Enlarged part of text Figure 5 panel Cc. ( B ) Object-based analysis, by JACoP, of images in panels Ca (GP a ) and Cb (STIM1) of Figure 5 . Centers of signal mass of STIM1 'objects' (i.e. automatically detected connected areas of fluorescence) are marked by a green symbol. Centers of objects in the GP a image are marked in red. Green and red locations are different but close. ( C ) Van Steensel's approach to calcu
- Submitted by
- Invitrogen Antibodies (provider)
- Main image
- Experimental details
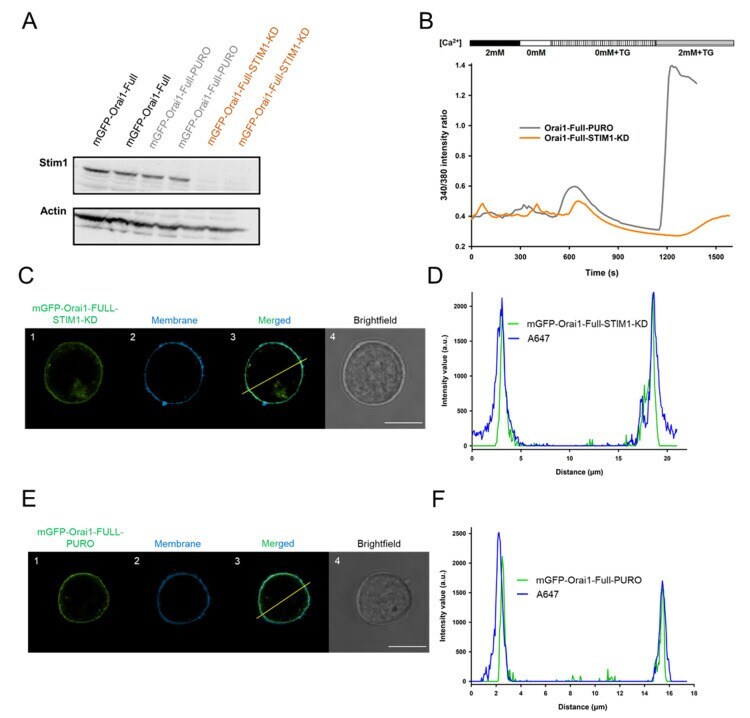
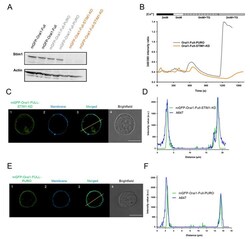
- Figure 2 Knockdown of STIM1 in Jurkat cells expressing mGFP-Orai1-Full resulted in nonfunctional channels. ( A ) Western blot experiments of mGFP-Orai1-Full expressing Jurkat (black), mGFP-Orai1-Full-PURO ( grey ) and mGFP-Orai1-Full-STIM1-KD (orange) cells probed with a specific antibody against STIM1 (the expected size 85-88 kDa, each sample was loaded in duplicates). Actin antibody was used as an expression control with an approximate size of 42 kDa. (Knock-down efficiency was ca. 95%.) ( B ) Cytosolic Ca 2+ measurements using FURA-2 in mGFP-Orai1-Full-PURO cells stably expressing mGFP-Orai1-Full channels (grey) and in Jurkat cells missing the Orai1 activator STIM1 protein (mGFP-Orai1-Full-STIM1-KD) stably expressing mGFP-Orai1-Full channels (orange). Cytosolic Ca 2+ measurement based on the 340 nm/380 nm intensity ratio of FURA-2. The representative traces are the average of 18 cells (mGFP-Orai1-Full-PURO) and 8 cells (mGFP-Orai1-Full-STIM1-KD). ( C ) Typical confocal images of mGFP-Orai1-Full-STIM1-KD cells. ( C1 , E1 ) mGFP signal of Orai1-Full channel in STIM1-KD or PURO cells ( green ), ( C2 , E2 ) The Alexa Fluor(tm) 647 NHS Ester fluorescence of the plasma membrane (blue) in mGFP-Orai1-Full-STIM1-KD and mGFP-Orai1-Full-PURO cells. ( C3 , E3 ) The merge of green and blue channels in mGFP-Orai1-Full-STIM1-KD and mGFP-Orai1-Full-PURO cells, please note the overlapping of them. ( C4 , E4 ) Brightfield image of the mGFP-Orai1-Full channel expressing STIM1-KD or PURO cell