Explore
 Validate
 Learn
Learn Western blot
 Immunohistochemistry
Antibody data
- Antibody Data
- Antigen structure
- References [1]
- Comments [0]
- Validations
- Immunohistochemistry [1]
- Other assay [1]
Submit
Validation data
Reference
Comment
Report error
- Product number
- PA5-104614 - Provider product page

- Provider
- Invitrogen Antibodies
- Product name
- Phospho-C2orf33 (Ser172, Ser146) Polyclonal Antibody
- Antibody type
- Polyclonal
- Antigen
- Synthetic peptide
- Description
- Antibody detects endogenous levels of MFF only when phosphorylated at Ser172/146.
- Reactivity
- Human
- Host
- Rabbit
- Isotype
- IgG
- Vial size
- 100 μL
- Concentration
- 1 mg/mL
- Storage
- -20°C
Submitted references Autophagy-mitophagy induction attenuates cardiovascular inflammation in a murine model of Kawasaki disease vasculitis.
Marek-Iannucci S, Ozdemir AB, Moreira D, Gomez AC, Lane M, Porritt RA, Lee Y, Shimada K, Abe M, Stotland A, Zemmour D, Parker S, Sanchez-Lopez E, Van Eyk J, Gottlieb RA, Fishbein MC, Karin M, Crother TR, Rivas MN, Arditi M
JCI insight 2021 Sep 22;6(18)
JCI insight 2021 Sep 22;6(18)
No comments: Submit comment
Supportive validation
- Submitted by
- Invitrogen Antibodies (provider)
- Main image
- Experimental details
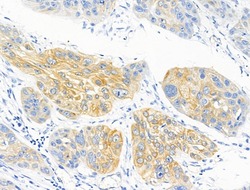
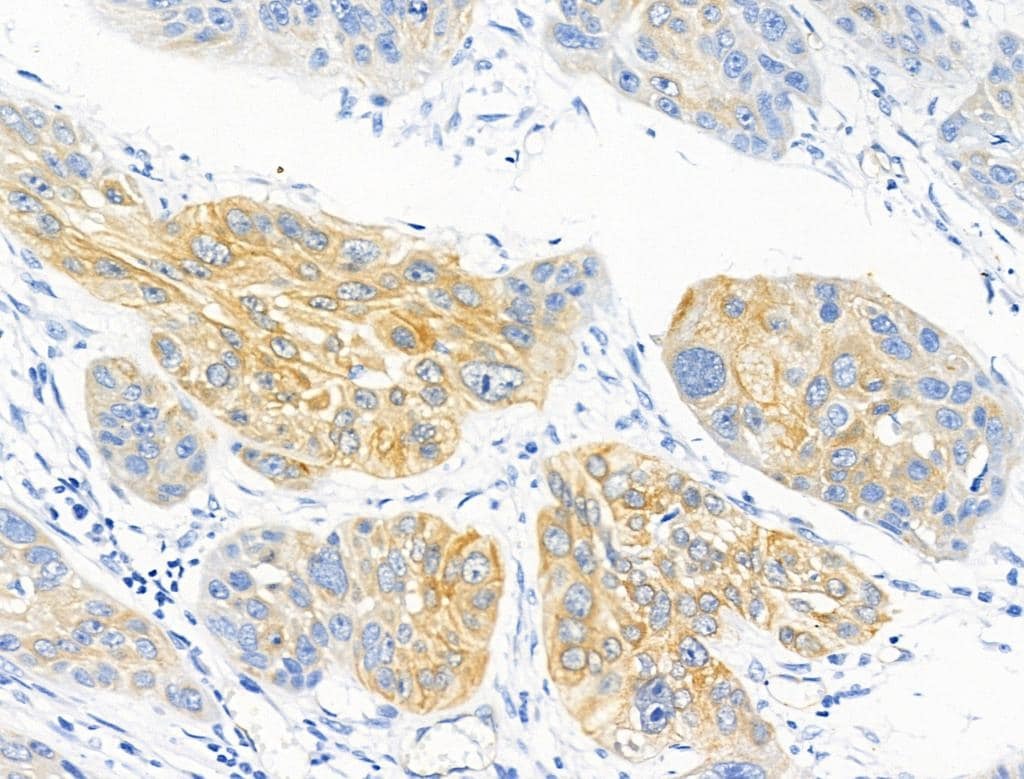
- Immunohistochemistry analysis of Phospho-C2orf33 (Ser172, Ser146) in human esophageal cancer. The sample was formaldehyde fixed and a heat mediated antigen retrieval step in citrate buffer was performed. Samples were incubated with Phospho-C2orf33 (Ser172, Ser146) polyclonal antibody (Product # PA5-104614) using a dilution of 1:100 (4°C overnight) followed by HRP conjugated anti-Rabbit secondary antibody.
Supportive validation
- Submitted by
- Invitrogen Antibodies (provider)
- Main image
- Experimental details
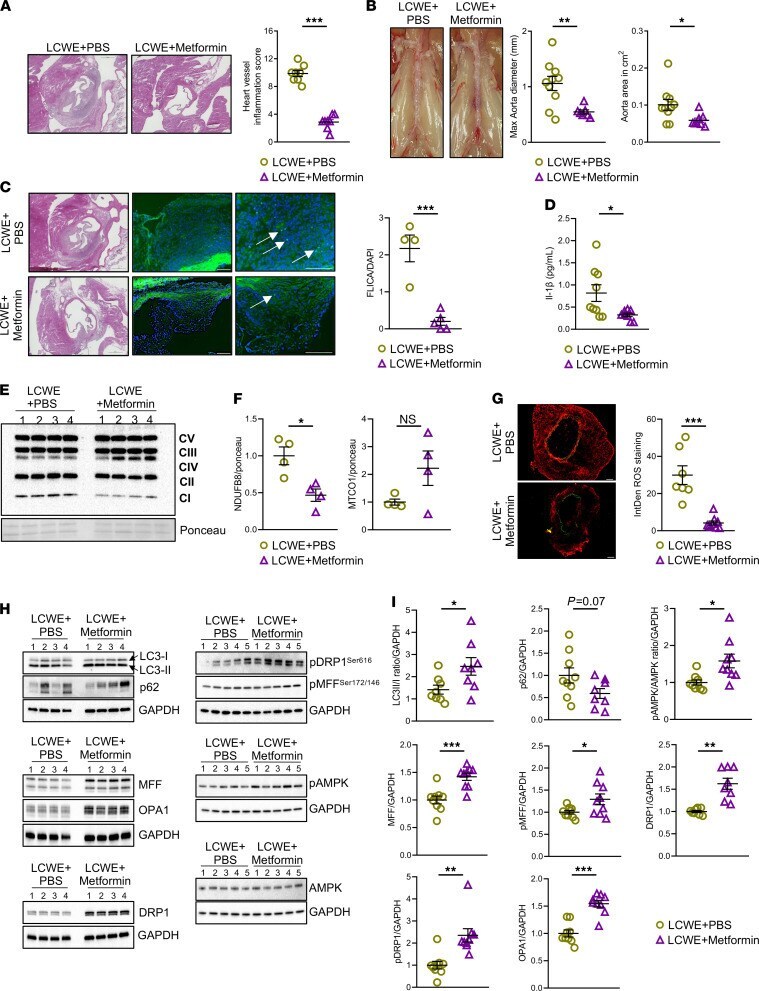
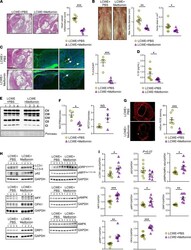
- Figure 7 Metformin reduces cardiovascular lesions in the LCWE-dependent murine model of KD vasculitis. ( A ) Heart sections H&E staining and heart vessel inflammation score of WT mice injected with either LCWE + PBS or LCWE + Metformin (Metformin 300 mg/kg/d i.p. from day -2 to day 7), 2 weeks after LCWE injection ( n = 10/group). Scale bars: 500 uM. ( B ) Representative pictures of the abdominal aorta, maximal aorta diameter, and abdominal aorta area measurements from LCWE + PBS or LCWE + Metformin treated mice ( n = 10/group), 2 weeks after LCWE injection. ( C ) Representative pictures of FLICA staining and quantification in heart tissue sections of LCWE + PBS- or LCWE + Metformin-treated WT mice, 1 week after LCWE injection ( n = 5/group). White arrows indicate FLICA + cells. Scale bars: 100 um. ( D ) IL-1beta levels in the serum of WT mice injected with either LCWE + PBS or LCWE + Metformin, at 1 week after LCWE injection ( n = 8-9/group). ( E and F ) Western blot analysis ( E ) and quantification ( F ) of complex I (CI), CII, CIII, CIV, and CV reflecting mitochondrial content, in whole lysates of heart tissues collected from LCWE + PBS and LCWE + Metformin, 1 week after LCWE injection ( n = 4/group). ( G ) Representative DHE staining and ROS quantification in abdominal aorta tissue cross-sections collected from LCWE + PBS- or LCWE + Metformin-treated mice, 1-week after injection ( n = 7-9/group). Scale bar: 100 um. ( H and I ) Representative Western blot analysis images