Explore
 Validate
 Learn
Learn Immunohistochemistry
Antibody data
- Antibody Data
- Antigen structure
- References [2]
- Comments [0]
- Validations
- Immunohistochemistry [4]
- Other assay [2]
Submit
Validation data
Reference
Comment
Report error
- Product number
- MA1-41108 - Provider product page

- Provider
- Invitrogen Antibodies
- Product name
- Bi-1 Monoclonal Antibody (20F430)
- Antibody type
- Monoclonal
- Antigen
- Synthetic peptide
- Description
- Epitope mapping indicates that the antibody recognizes an epitope in the N-terminal region of Bi-1.
- Reactivity
- Human, Mouse, Rat
- Host
- Mouse
- Isotype
- IgG
- Antibody clone number
- 20F430
- Vial size
- 100 μg
- Concentration
- 1.0 mg/mL
- Storage
- Store at 4°C short term. For long term storage, store at -20°C, avoiding freeze/thaw cycles.
Submitted references TMBIM6 regulates redox-associated posttranslational modifications of IRE1α and ER stress response failure in aging mice and humans.
Selective A3 adenosine receptor agonist protects against doxorubicin-induced cardiotoxicity.
Bhattarai KR, Kim HK, Chaudhary M, Ur Rashid MM, Kim J, Kim HR, Chae HJ
Redox biology 2021 Nov;47:102128
Redox biology 2021 Nov;47:102128
Selective A3 adenosine receptor agonist protects against doxorubicin-induced cardiotoxicity.
Galal A, El-Bakly WM, Al Haleem EN, El-Demerdash E
Cancer chemotherapy and pharmacology 2016 Feb;77(2):309-22
Cancer chemotherapy and pharmacology 2016 Feb;77(2):309-22
No comments: Submit comment
Supportive validation
- Submitted by
- Invitrogen Antibodies (provider)
- Main image
- Experimental details
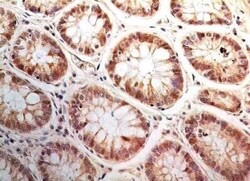
- Immunohistochemical analysis of Bi-1 in formalin-fixed, paraffin-embedded human adenocarcinoma of the rectum. Samples were incubated in Bi-1 monoclonal antibody (Product # MA1-41108) using a dilution of 5 µg/mL followed by peroxidase-conjugate and DAB chromogen. Staining of formalin-fixed tissues is enhanced by boiling tissue sections in 10 mM sodium citrate buffer, pH 6.0 for 10-20 min followed by cooling at RT for 20 min.

- Submitted by
- Invitrogen Antibodies (provider)
- Main image
- Experimental details
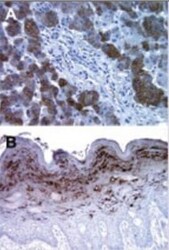
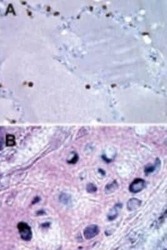
- Immunohistochemical analysis of Bi-1 in formalin-fixed, paraffin-embedded normal human tissue sections. Samples were incubated in Bi-1 monoclonal antibody (Product # MA1-41108) using a dilution of 5 µg/mL. A: liver. B: skin. Hematoxylin-eosin counterstain.

- Submitted by
- Invitrogen Antibodies (provider)
- Main image
- Experimental details
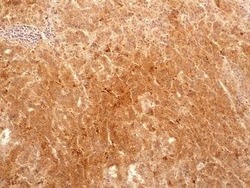
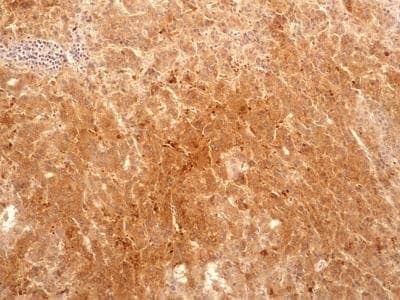
- Immunohistochemical analysis of Bi-1 in formalin-fixed paraffin-embedded tissue section of human liver cancer. Samples were incubated in Bi-1 monoclonal antibody (Product # MA1-41108) using a dilution of 5 µg/mL. Intense cytoplasmic immune-positivity of Bax inhibitor 1 (TMBIM6) was observed in the hepatis cancer cells [10X Magnification].
- Submitted by
- Invitrogen Antibodies (provider)
- Main image
- Experimental details
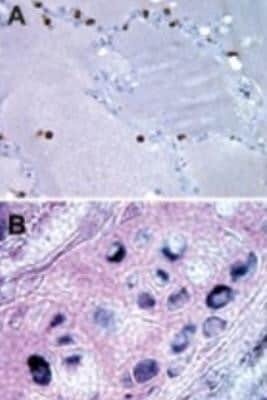
- Immunohistochemical analysis of Bi-1 in formalin-fixed, paraffin-embedded tissue sections. Samples were incubated in Bi-1 monoclonal antibody (Product # MA1-41108) using a dilution of 5 µg/mL. A: normal human lung alveoli with positive lung macrophages. B: normal mouse cartilage with positive chondrocytes. Hematoxylin-eosin counterstain.
Supportive validation
- Submitted by
- Invitrogen Antibodies (provider)
- Main image
- Experimental details
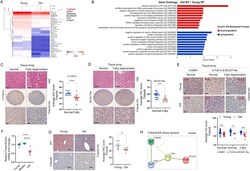
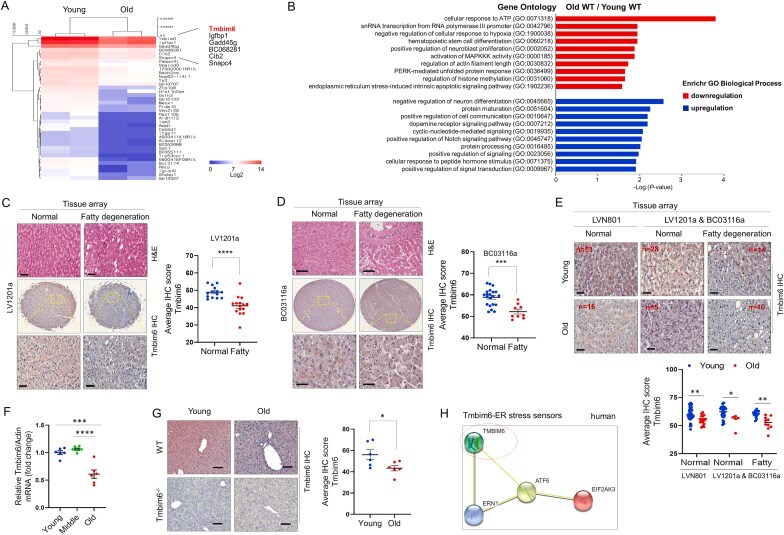
- Fig. 1 TMBIM6 is downregulated in fatty degenerated and in aged human and mice livers. The liver was isolated from young and old WT mice and subjected to RNA-sequencing. (A) Hierarchical clustering of genes expressed in young and old WT mice. (B) Enrichment analysis results of up/down-regulated differentially expressed genes (DEGs) in old-aged mice compared to young mice. (C-D) Human normal and fat-degenerated liver sections were selected from tissue microarray (LV1201a and BC03116a) and analyzed for H&E and immunohistochemistry using TMBIM6 antibody. H&E images were adopted from Biomax. The bar graph (right) shows the average TMBIM6 expression score (LV1201a: normal = 14, fatty = 15; BC03116a: normal = 21, fatty = 9). Scale bar: 50 mum. (E) Normal tissues and fat-degenerated tissues were selected from young (50 years) (selected as explained in the method section), and TMBIM6 expression was analyzed by immunohistochemistry using a specific antibody. Bar graph (below) shows the average TMBIM6 expression (total young normal = 81, total old normal = 21, young fatty = 14, and old fatty = 10). Scale bar: 50 mum. (F) TMBIM6 mRNA expression was analyzed by real-time PCR in different age groups of wild-type mice. (G) Immunohistochemistry of the expression of TMBIM6 in liver sections of young and old WT and TMBIM6 -/- mice. The graph (right) shows the average TMBIM6 expression score (n = 6 per group). Note: TMBIM6 -/- mice liver sections were used to vali
- Submitted by
- Invitrogen Antibodies (provider)
- Main image
- Experimental details
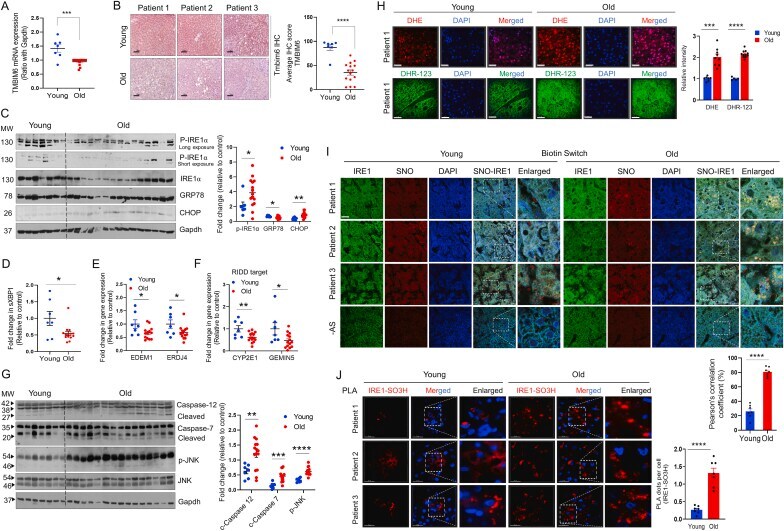
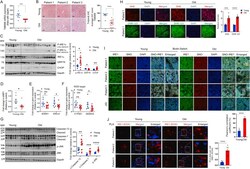
- Fig. 6 Aging decreases TMBIM6 expression, induces aberrant UPR expression, S-nitrosylation, and sulfonation of IRE1alpha in human liver. (A) TMBIM6 mRNA expression and (B) protein expression were analyzed by real-time PCR and immunohistochemistry respectively in young (n = 7) and old human liver tissues (n = 15). (C) Western blotting was performed to check the expression of ER stress response elements p-IRE1, IRE1, GRP78, and CHOP. GAPDH was used as a loading control. Densitometry analysis is shown in the graph (right). (D) The mRNA expression of sXBP1 was analyzed by real-time PCR. (E) The mRNA expression of XBP1 target genes such as EDEM1 and ERDJ4 were measured by real-time PCR. (F) The mRNA expression of the IRE1alpha-dependent decay (RIDD) target genes such as CYP2E1 and GEMIN5 were examined in the human patient liver samples and analyzed by real-time PCR. (G) Western blotting was performed to check the expression of ER stress-apoptosis-related proteins such as caspase 12, caspase 7, p-JNK, and JNK. GAPDH was used as a loading control. (H) Dihydroethidium (DHE) and Dihydrorhodamine-123 (DHR-123) fluorescence staining were performed in liver sections of young and old patients using confocal microscopy. Red fluorescence indicates DHE positive cells, green fluorescence indicates DHR-123 positive cells, and blue fluorescence indicates DAPI for nuclear staining. The bar graph (right) shows the intensity (n = 7-9 for DHE, n = 5-11 for DHR-123). Magnification: 40x, Scale bar: 2