Explore
 Validate
 Learn
Learn Western blot
 ELISA
ELISAAntibody data
- Antibody Data
- Antigen structure
- References [1]
- Comments [0]
- Validations
- Western blot [1]
- Immunocytochemistry [5]
- Other assay [2]
Submit
Validation data
Reference
Comment
Report error
- Product number
- PA5-97290 - Provider product page

- Provider
- Invitrogen Antibodies
- Product name
- Aquaporin 5 Polyclonal Antibody
- Antibody type
- Polyclonal
- Antigen
- Synthetic peptide
- Description
- Positive Samples: Mouse liver; Cellular Location: Apical cell membrane, Multi-pass membrane protein Immunogen sequence: RSFGPAVVMN RFSPAH
- Reactivity
- Human, Mouse, Rat
- Host
- Rabbit
- Isotype
- IgG
- Vial size
- 100 μL
- Concentration
- 1.04 mg/mL
- Storage
- -20°C, Avoid Freeze/Thaw Cycles
Submitted references Helicobacter pylori infection activates Wnt/β-catenin pathway to promote the occurrence of gastritis by upregulating ASCL1 and AQP5.
Zuo W, Yang H, Li N, Ouyang Y, Xu X, Hong J
Cell death discovery 2022 May 10;8(1):257
Cell death discovery 2022 May 10;8(1):257
No comments: Submit comment
Supportive validation
- Submitted by
- Invitrogen Antibodies (provider)
- Main image

- Experimental details
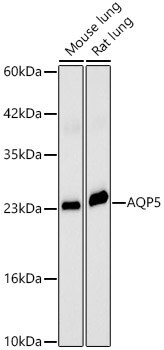
- Western blot analysis of Aquaporin 5 in various lysates. Samples were incubated with Aquaporin 5 Polyclonal antibody (Product # PA5-97290) using a dilution of 1:2,000, followed by HRP Goat Anti-Rabbit IgG (H+L) at a dilution of 1:10,000. Lysates/proteins: 25 µg per lane. Blocking buffer: 3% nonfat dry milk in TBST. Detection: ECL Basic Kit. Exposure time: 60s.
Supportive validation
- Submitted by
- Invitrogen Antibodies (provider)
- Main image
- Experimental details
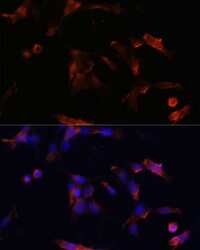
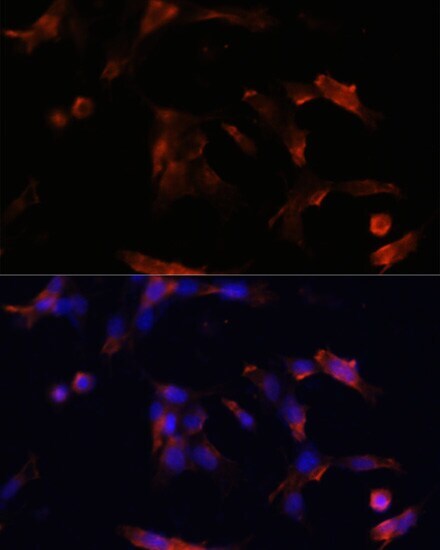
- Immunocytochemistry-Immunofluorescence analysis of Aquaporin 5 was performed in NIH/3T3 cells using Aquaporin 5 Polyclonal Antibody (Product # PA5-97290) at a dilution of 1:100. Blue: DAPI for nuclear staining.
- Submitted by
- Invitrogen Antibodies (provider)
- Main image

- Experimental details
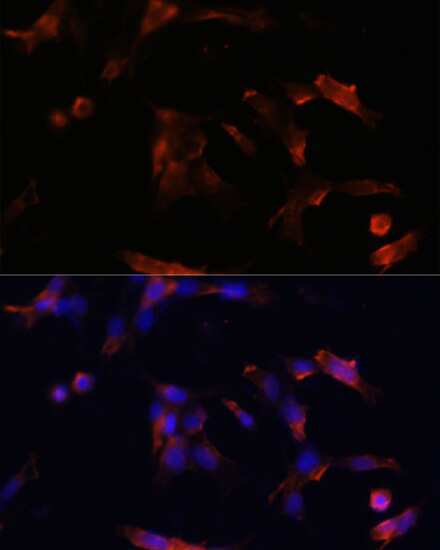
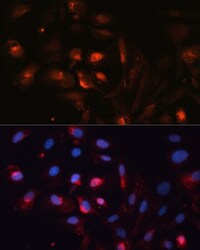
- Immunocytochemistry-Immunofluorescence analysis of Aquaporin 5 was performed in NIH/3T3 cells using Aquaporin 5 Polyclonal Antibody (Product # PA5-97290) at a dilution of 1:100. Blue: DAPI for nuclear staining.
- Submitted by
- Invitrogen Antibodies (provider)
- Main image
- Experimental details
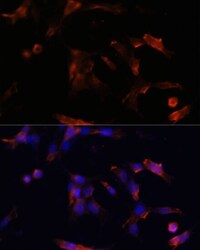
- Immunocytochemistry-Immunofluorescence analysis of Aquaporin 5 was performed in U2OS cells using Aquaporin 5 Polyclonal Antibody (Product # PA5-97290).

- Submitted by
- Invitrogen Antibodies (provider)
- Main image
- Experimental details
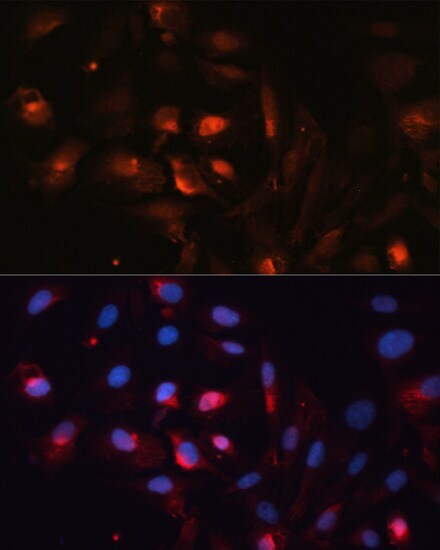
- Immunofluorescence analysis of Aquaporin 5 in NIH/3T3 cells. Samples were incubated with Aquaporin 5 Polyclonal antibody (Product # PA5-97290) using a dilution of 1:100. Blue: DAPI for nuclear staining.

- Submitted by
- Invitrogen Antibodies (provider)
- Main image

- Experimental details
- Immunofluorescence analysis of Aquaporin 5 in U2OS cells. Samples were incubated with Aquaporin 5 Polyclonal antibody (Product # PA5-97290) using a dilution of 1:100. Blue: DAPI for nuclear staining.
Supportive validation
- Submitted by
- Invitrogen Antibodies (provider)
- Main image
- Experimental details
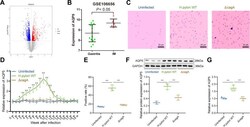
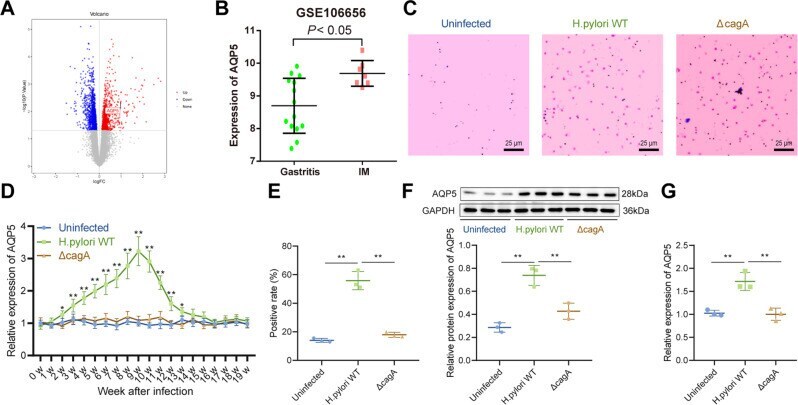
- Fig. 1 H. pylori infection elevates AQP5 expression in gastric mucosa. A Volcano map of differentially expressed genes in microarray data GSE106656. Red represents upregulated genes and green represents downregulated genes with |log 2 FC | >= 1 and p < 0.05. B , AQP5 expression in 14 gastritis patients and 7 IM patients in microarray data GSE106656. C , H. pylori infection in mice detected by Giemsa staining. D , AQP5 mRNA level in mouse gastric mucosa determined by RT-qPCR ( n = 6). E , AQP5 protein level in mouse gastric mucosa determined by immunohistochemistry ( n = 3). F , AQP5 protein level in mouse isolated gastric mucosa determined by Western blot analysis ( n = 3). G , AQP5 mRNA level in mouse isolated gastric mucosa determined by RT-qPCR ( n = 3). * p < 0.05, ** p < 0.01. Data were shown as the mean +- standard deviation. Comparisons of data between two groups were analyzed by independent sample t- test. One-way ANOVA was applied for the comparison of data among multiple groups. The data between groups at different time points were compared by repeated measures ANOVA.
- Submitted by
- Invitrogen Antibodies (provider)
- Main image
- Experimental details
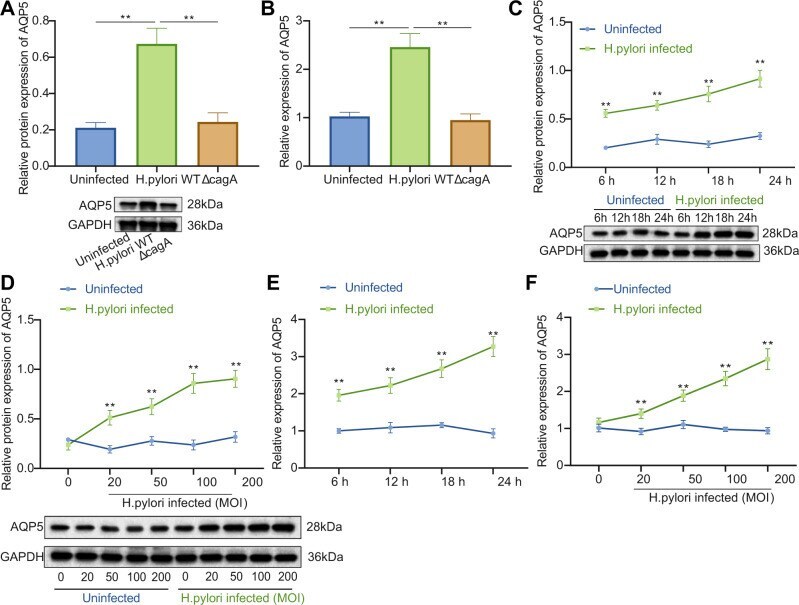
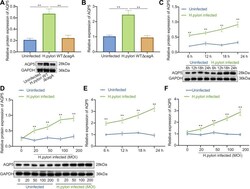
- Fig. 2 H. pylori infection enhances AQP5 expression in mouse GECs. A AQP5 protein level in mouse primary GECs measured by Western blot analysis. B , AQP5 mRNA level in mouse primary GECs measured by RT-qPCR. C , D , AQP5 protein level in mouse primary GECs at different time points ( C ) and doses ( D ) measured by Western blot analysis. E , F , AQP5 mRNA level in mouse primary GECs at different time points ( E ) and doses ( F ) measured by RT-qPCR. * p < 0.05, ** p < 0.01. Data were shown as the mean +- standard deviation. Cell experiments were repeated three times independently. Comparisons of data between two groups were analyzed by independent sample t- test. One-way ANOVA with Dunnett's post hoc test was applied for the comparison of data among multiple groups. The data between groups at different time points were compared by repeated measures ANOVA.