Explore
 Validate
 Learn
Learn Western blot
 Immunocytochemistry
Antibody data
- Antibody Data
- Antigen structure
- References [1]
- Comments [0]
- Validations
- Immunocytochemistry [1]
- Immunohistochemistry [1]
- Flow cytometry [2]
- Other assay [3]
Submit
Validation data
Reference
Comment
Report error
- Product number
- PA5-47083 - Provider product page

- Provider
- Invitrogen Antibodies
- Product name
- CD166 Polyclonal Antibody
- Antibody type
- Polyclonal
- Antigen
- Recombinant full-length protein
- Description
- In direct ELISAs, approximately 40% cross-reactivity with recombinant human (rh) ALCAM is observed, and less than 10% cross-reactivity with rhBCAM, recombinant mouse (rm) OCAM, and rmMAdCAM-1 is observed. Reconstitute at 0.2 mg/mL in sterile PBS.
- Reactivity
- Human, Mouse, Rat, Canine
- Host
- Goat
- Isotype
- IgG
- Vial size
- 100 μg
- Concentration
- 0.2 mg/mL
- Storage
- -20°C, Avoid Freeze/Thaw Cycles
Submitted references Radiation-Stimulated Translocation of CD166 and CRYAB to the Endothelial Surface Provides Potential Vascular Targets on Irradiated Brain Arteriovenous Malformations.
McRobb LS, McKay MJ, Gauden AJ, Lee VS, Subramanian S, Thomas SG, Wiedmann MK, Moutrie V, Grace M, Zhao Z, Molloy MP, Stoodley MA
International journal of molecular sciences 2019 Nov 20;20(23)
International journal of molecular sciences 2019 Nov 20;20(23)
No comments: Submit comment
Supportive validation
- Submitted by
- Invitrogen Antibodies (provider)
- Main image
- Experimental details
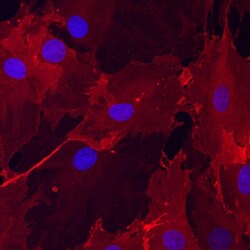
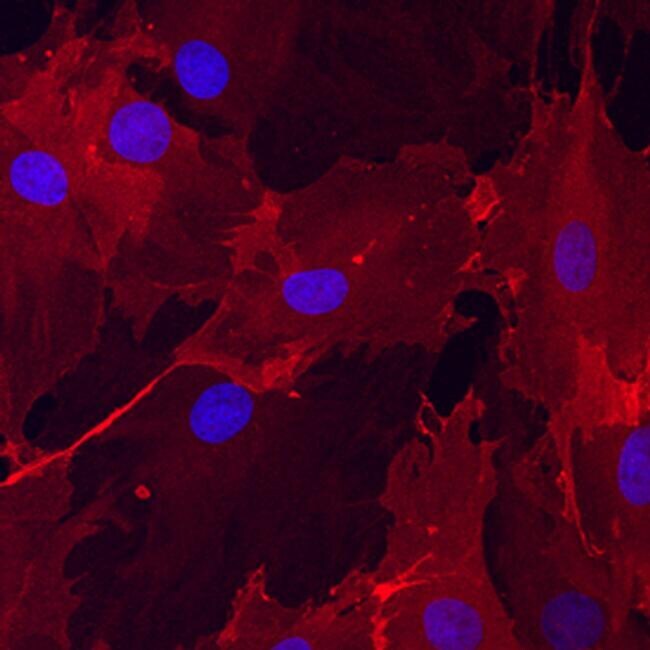
- Immunocytochemical analysis of ALCAM/CD166 was detected in immersion fixed undifferentiated rat mesenchymal stem cells using Goat Anti-mouse/Rat/Canine ALCAM/CD166 Antigen Affinity-purified Polyclonal Antibody (Product # PA5-47083) at 10 µg/mL for 3 hours at room temperature. Cells were stained using the 557-conjugated Anti-Goat IgG Secondary Antibody (re and counterstained with DAPI (blue). Specific staining was localized to cytoplasm.
Supportive validation
- Submitted by
- Invitrogen Antibodies (provider)
- Main image
- Experimental details
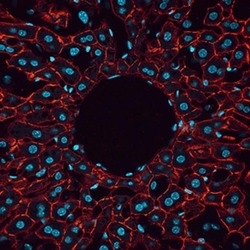
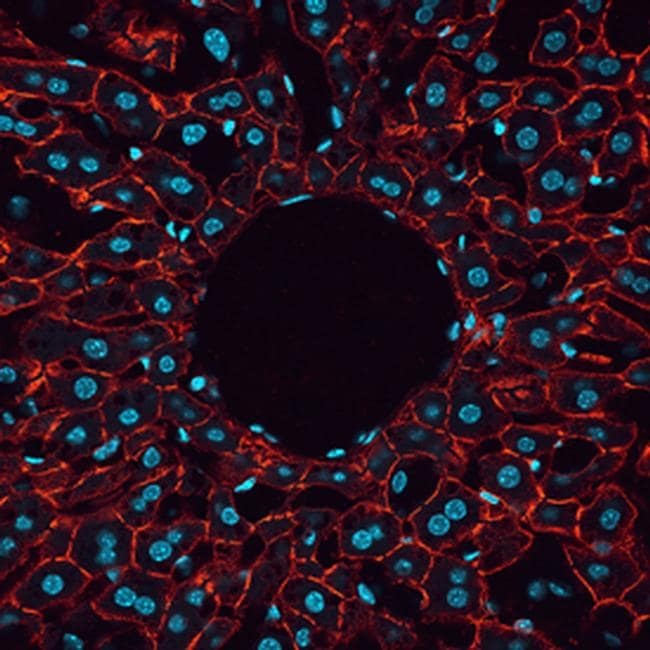
- Immunohistochemical analysis of ALCAM/CD166 was detected in perfusion fixed frozen sections of mouse liver using Goat Anti-mouse/Rat/Canine ALCAM/CD166 Antigen Affinity-purified Polyclonal Antibody (Product # PA5-47083) at 1.7 µg/mL overnight at 4 °C. Tissue was stained using the 557-conjugated Anti-Goat IgG Secondary Antibody (re and counterstained with DAPI (blue).
Supportive validation
- Submitted by
- Invitrogen Antibodies (provider)
- Main image

- Experimental details
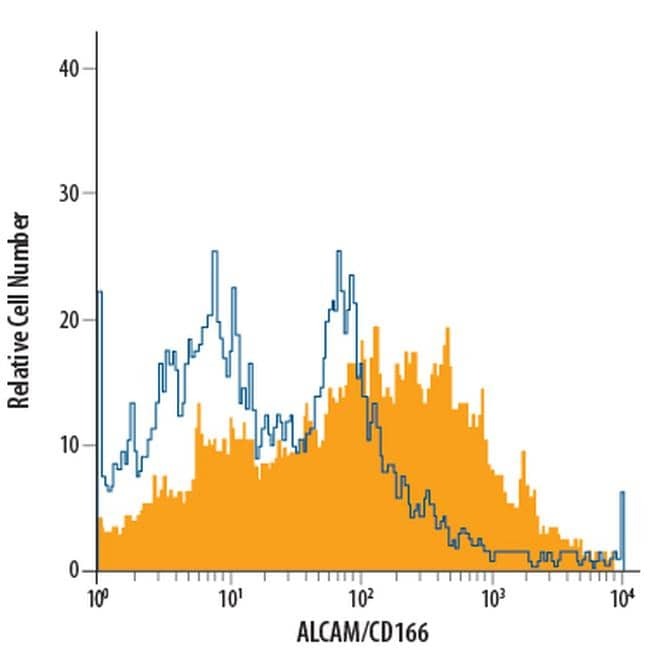
- Flow cytometric analysis of canine peripheral blood mononuclear cells (PBMCs) treated with PMA and Calcium Ionomycin for 24 hours were stained with Goat Anti-Mouse/Rat/Canine ALCAM/CD166 Antigen Affinity-purified Polyclonal Antibody (Product # PA5-47083, filled histogram) or isotype control antibody (open histogram), followed by Phycoerythrin-conjugated Anti-Goat IgG Secondary Antibody.

- Submitted by
- Invitrogen Antibodies (provider)
- Main image

- Experimental details
- Flow cytometric analysis of canine peripheral blood mononuclear cells (PBMCs) treated with PMA and Calcium Ionomycin for 24 hours were stained with Goat Anti-Mouse/Rat/Canine ALCAM/CD166 Antigen Affinity-purified Polyclonal Antibody (Product # PA5-47083, filled histogram) or isotype control antibody (open histogram), followed by Phycoerythrin-conjugated Anti-Goat IgG Secondary Antibody.
Supportive validation
- Submitted by
- Invitrogen Antibodies (provider)
- Main image
- Experimental details
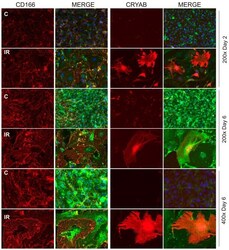
- Figure 2 Immunofluorescent localization of target proteins in brain microvascular endothelial cells. Microvascular bEnd.3 cells were exposed to ionizing radiation (20 Gy) or sham treatment in 8-well chamber slides and immunostaining performed after 2 or 6 days on fixed (2% PFA, 5 min) but non-permeabilized cells. Representative immunofluorescent images of bEnd.3 cells probed with anti-CD166 or anti-CRYAB antibodies. Irradiated cells were typically senescent, showing a considerably enlarged, hypertrophic cell type with multi-lobed or fragmented nuclei. Target protein (AF647, red); wheat germ agglutinin surface marker (AF488, green); nuclei were stained with DAPI (blue). Original magnification, 200x or 400x, as indicted.

- Submitted by
- Invitrogen Antibodies (provider)
- Main image
- Experimental details
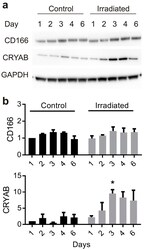
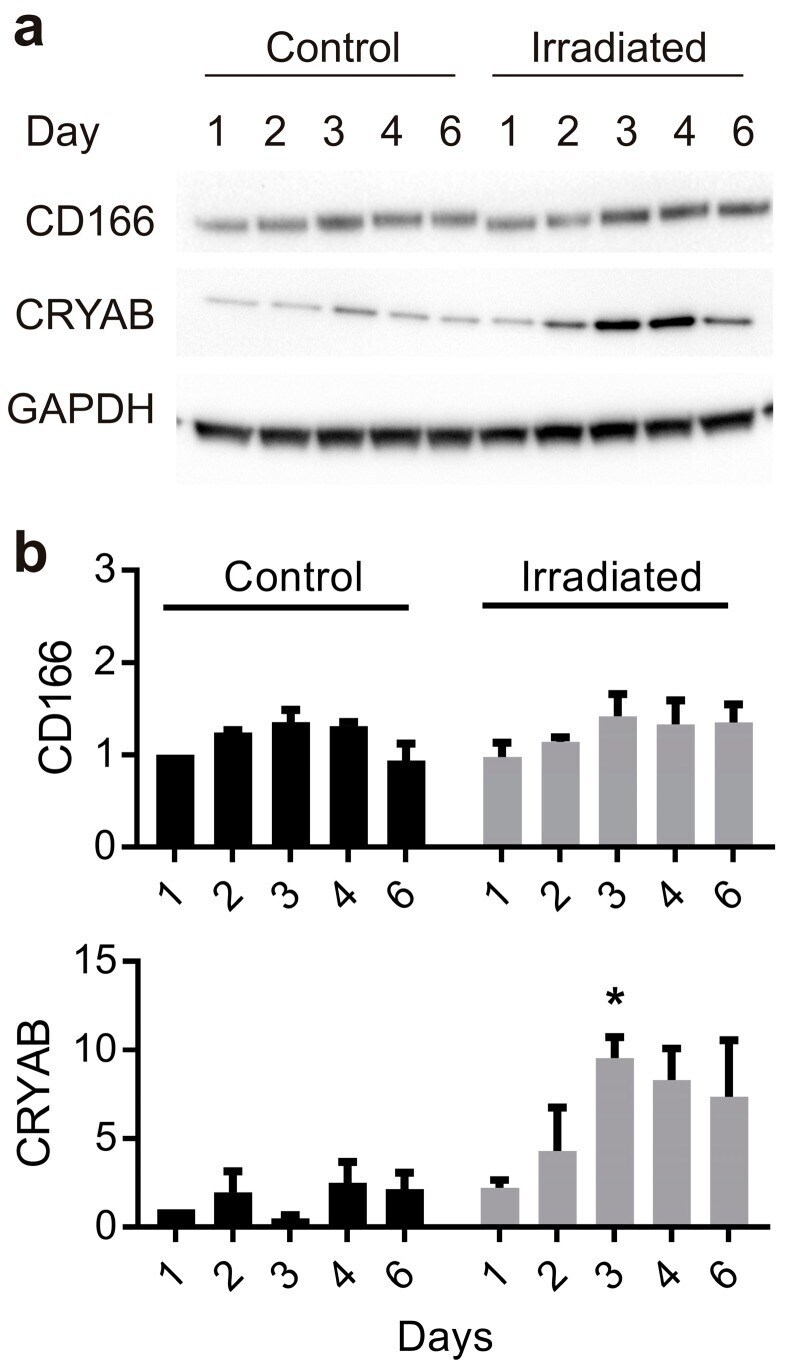
- Figure 3 Time course of radiation-stimulated target protein expression in vitro. Representative Western immunoblots probed for CD166 and CRYAB expression in whole cell lysates (15 ug) extracted 1-6 days after sham or radiation treatment (20 Gy) of bEnd.3 cells by linear accelerator ( a ). Western blot images were quantitated using Image J and intensity, compared to respective day 1, non-irradiated controls for each blot. GAPDH was used to ensure equal loading ( b ). Data represent mean +- SEM of three independent experiments. Two-way ANOVA with Sidak's multiple comparison test, * p < 0.05.
- Submitted by
- Invitrogen Antibodies (provider)
- Main image
- Experimental details
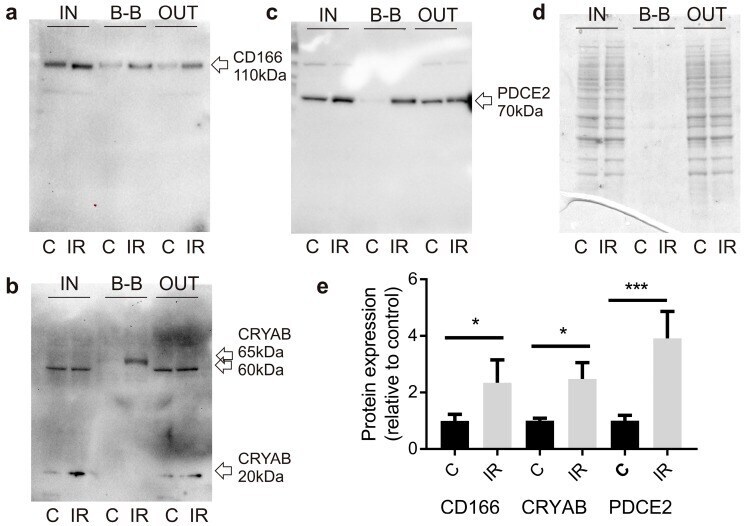
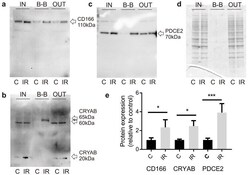
- Figure 4 Radiation alters target expression in biotin-bound protein fractions. Representative Western immunoblot images of fractionated extracts from biotin-labeled bEnd.3 cells before and after streptavidin enrichment. Membranes were probed for CD166 ( a ), CRYAB ( b ), or PDCE2 ( c ). Representative coomassie-stained SDS-PAGE gel showing protein loadings ( d ). IN, total cell extract prior to streptavidin enrichment, 15 µg loaded; B-B, biotin-bound fraction, 30 µg loaded; OUT, non-biotinylated fraction eluted after streptavidin binding, 15 µg loaded; C, control; IR irradiated. Images are representative of 3-5 independent experiments. ( e ) Proteins in biotin-bound extracts were quantitated using Image J. Band intensities in irradiated samples were compared to band intensities in non-irradiated control samples for each blot. Paired Student's t-test, * p < 0.05, *** p < 0.001.