Explore
 Validate
 Learn
Learn Western blot
 ELISA
ELISAAntibody data
- Antibody Data
- Antigen structure
- References [2]
- Comments [0]
- Validations
- Western blot [2]
- Flow cytometry [3]
- Other assay [1]
Submit
Validation data
Reference
Comment
Report error
- Product number
- PA5-79193 - Provider product page

- Provider
- Invitrogen Antibodies
- Product name
- PERK Polyclonal Antibody
- Antibody type
- Polyclonal
- Antigen
- Recombinant full-length protein
- Description
- Reconstitute with 0.2 mL of distilled water to yield a concentration of 500 µg/mL. Positive Control - WB: human Hela whole cell, human COLO-320 whole cell, human A549 whole cell, human SK-OV-3 whole cell, Human A431 whole cell, rat brain tissue, mouse brain tissue. Flow: HepG2 cell.
- Reactivity
- Human, Mouse, Rat
- Host
- Rabbit
- Isotype
- IgG
- Vial size
- 100 μg
- Concentration
- 500 μg/mL
- Storage
- -20°C
Submitted references Effect of Propionic Acid on Diabetes-Induced Impairment of Unfolded Protein Response Signaling and Astrocyte/Microglia Crosstalk in Rat Ventromedial Nucleus of the Hypothalamus.
Dexmedetomidine Preconditioning Reduces Myocardial Ischemia-Reperfusion Injury in Rats by Inhibiting the PERK Pathway.
Natrus LV, Osadchuk YS, Lisakovska OO, Labudzinskyi DO, Klys YG, Chaikovsky YB
Neural plasticity 2022;2022:6404964
Neural plasticity 2022;2022:6404964
Dexmedetomidine Preconditioning Reduces Myocardial Ischemia-Reperfusion Injury in Rats by Inhibiting the PERK Pathway.
Chen Y, Cao S, Chen H, Yin C, Xu X, Yang Z
Arquivos brasileiros de cardiologia 2021 Dec;117(6):1134-1144
Arquivos brasileiros de cardiologia 2021 Dec;117(6):1134-1144
No comments: Submit comment
Supportive validation
- Submitted by
- Invitrogen Antibodies (provider)
- Main image
- Experimental details
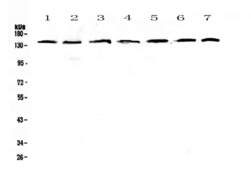
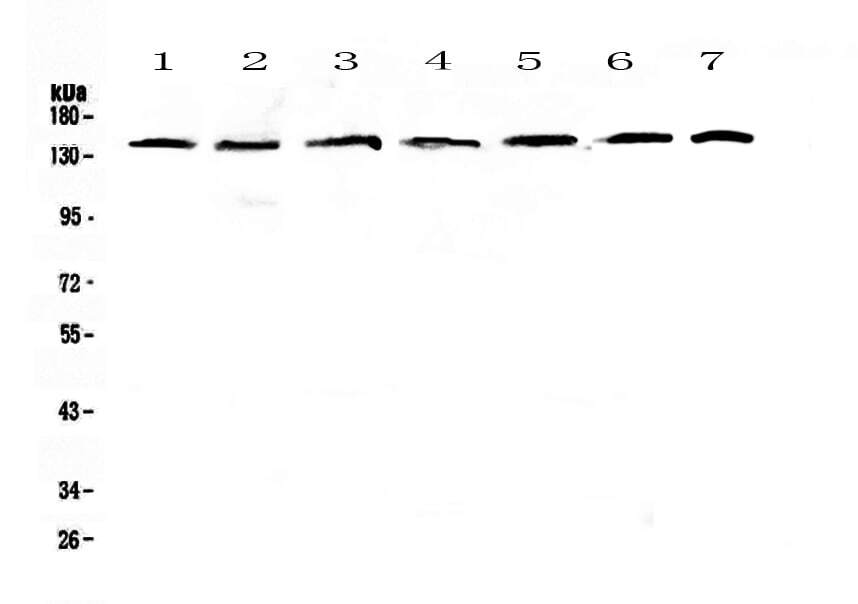
- Western blot analysis of PERK in Lane 1: human HeLa whole cell lysate, Lane 2: human COLO-320 whole cell lysate, Lane 3: human A549 whole cell lysate, Lane 4: human SK-OV-3 whole cell lysate, Lane 5: human A431 whole cell lysate, Lane 6: rat brain tissue lysate, Lane 7: mouse brain tissue lysate using 50 µg (reducing conditions) per well. Electrophoresis was performed on 5-20% SDS-PAGE gel at 70V (Stacking gel) / 90V (Resolving gel) for 2-3 hours and protein was transferred to a nitrocellulose membrane at 150mA for 50-90 minutes. Sample was blocked with 5% Non-fat Milk/TBS for 1.5 hours at room temperature, incubated with PERK polyclonal antibody (Product # PA5-79193) at a dilution of 0.5 µg/mL (overnight at 4°C), followed by goat anti-rabbit IgG-HRP secondary antibody at a dilution of 1:10,000. Signal development was performed using a chemiluminescence (ECL) kit.
- Submitted by
- Invitrogen Antibodies (provider)
- Main image
- Experimental details
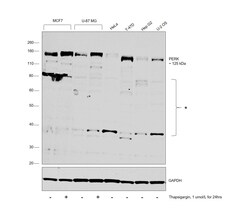
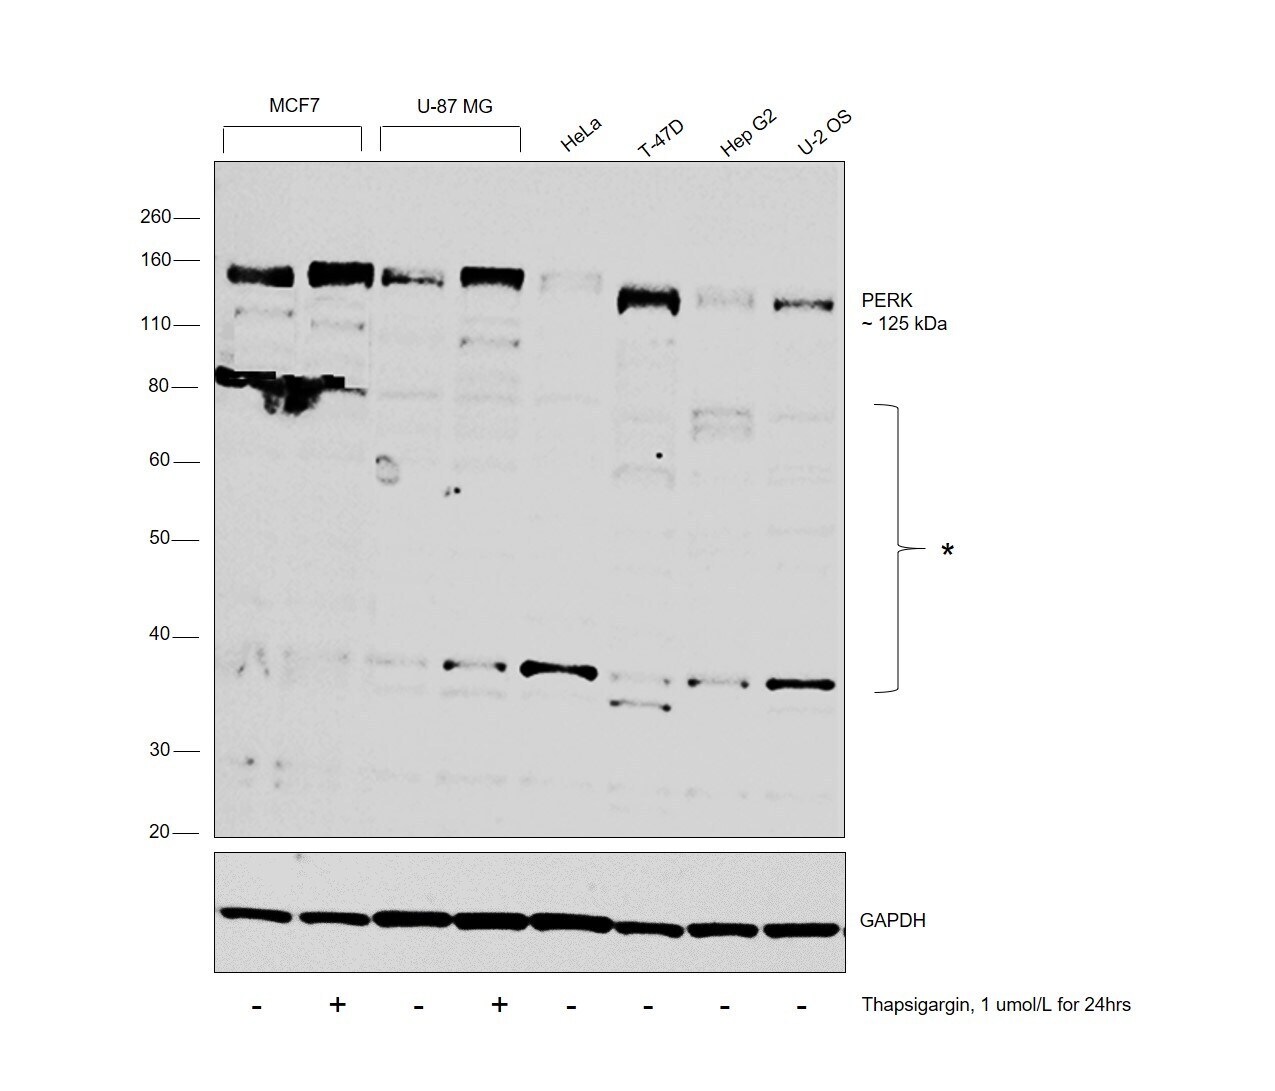
- Western blot was performed using anti-PERK Polyclonal Antibody (Product # PA5-79193) and 125 kDa band corresponding to PERK was observed across the cell lines tested, also, the protein expression was increased upon Thapsigargin treatment in MCF7 and U-87 MG along with uncharacterized bands (*). Whole cell extracts (30 µg lysate) of MCF7 (Lane 1), MCF7 treated with Thapsigargin (1 µMol/L for 24 hrs) (Lane 2), U-87 MG (Lane 3), U-87 MG treated with Thapsigargin (1 µMol/L for 24 hrs) (Lane 4), HeLa (Lane 5), T-47D (Lane 6), Hep G2 (Lane 7) and U-2 OS (Lane 8) were electrophoresed using Novex® NuPAGE™ 4-12% Bis-Tris Protein Gel (Product # NP0321BOX). Resolved proteins were then transferred onto a nitrocellulose membrane (Product # IB23001) by iBlot® 2 Dry Blotting System (Product # IB21001). The blot was probed with the primary antibody (0.5 µg/mL) and detected by chemiluminescence with Goat anti-Rabbit IgG (Heavy Chain), Superclonal™ Recombinant Secondary Antibody, HRP (Product # A27036, 1:4,000 dilution) using the iBright FL 1000 (Product # A32752). Chemiluminescent detection was performed using Novex® ECL Chemiluminescent Substrate Reagent Kit (Product # WP20005).
Supportive validation
- Submitted by
- Invitrogen Antibodies (provider)
- Main image

- Experimental details
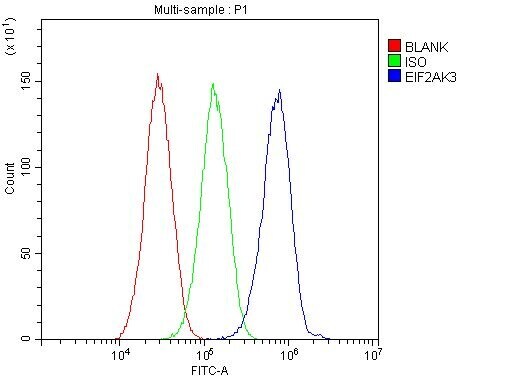
- Flow Cytometry of PERK in HepG2 cells (blue line), isotype control rabbit IgG (green line) and unlabeled (red line). Samples were blocked with 10% goat serum, incubated with PERK Polyclonal Antibody (Product # PA5-79193) at a dilution of 1 μg (per 1x10^6 cells), followed by DyLight®488 conjugated goat anti-rabbit IgG (for 30 minutes at 20°C) using 5-10 μg (per 1x10^6 cells) dilution.
- Submitted by
- Invitrogen Antibodies (provider)
- Main image
- Experimental details
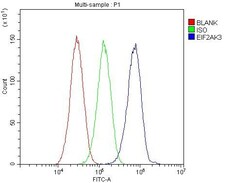
- Flow Cytometry of PERK in HepG2 cells (blue line), isotype control rabbit IgG (green line) and unlabeled (red line). Samples were blocked with 10% goat serum, incubated with PERK Polyclonal Antibody (Product # PA5-79193) at a dilution of 1 μg (per 1x10^6 cells), followed by DyLight®488 conjugated goat anti-rabbit IgG (for 30 minutes at 20°C) using 5-10 μg (per 1x10^6 cells) dilution.

- Submitted by
- Invitrogen Antibodies (provider)
- Main image

- Experimental details
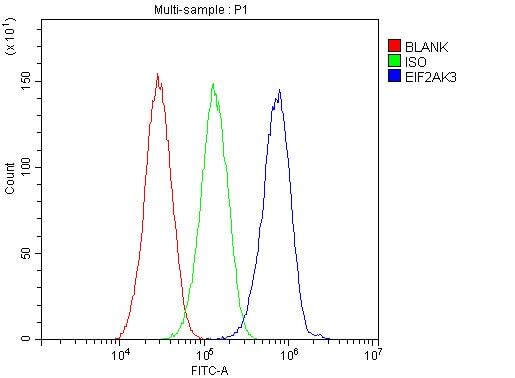
- Flow cytometry analysis of PERK in HepG2 cells using PERK Polyclonal Antibody (Product # PA5-79193), shown in overlay histogram (blue line). To facilitate intracellular staining, cells were fixed with 4% paraformaldehyde and permeabilized with permeabilization buffer. The cells were blocked with 10% normal goat serum, and incubated with the primary antibody (1 μg/1x10^6 cells) for 30 min at 20°C. DyLight 488 conjugated goat anti-rabbit IgG (5-10 µg/1x10^6 cells) was used as secondary antibody for 30 minutes at 20°C. Isotype control antibody (Green line) was rabbit IgG (1 µg/1x10^6) used under the same conditions. Unlabelled sample without incubation with primary antibody and secondary antibody (Red line) was used as a blank control.
Supportive validation
- Submitted by
- Invitrogen Antibodies (provider)
- Main image
- Experimental details
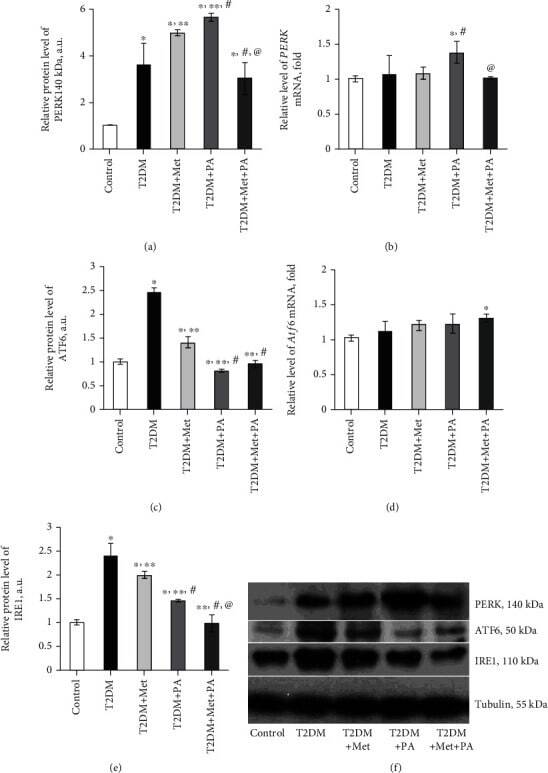
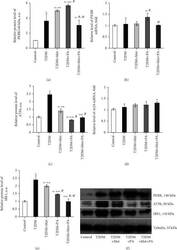
- Figure 7 Effects of administration of metformin and PA on the major components of unfolded protein response system--PERK, ATF6, and IRE1. Immunoblotting analysis of PERK, ATF6, and IRE1 in rat VMH: the bar graphs of (a) PERK, (c) ATF6, and (e) IRE1 protein content are presented; (f) representative immunoblots are shown, and data are quantified using tubulin as a loading control for hypothalamus lysates. Quantitative RT-PCR of (b) Perk and (d) Atf6 in rat VMH: data were normalized to beta -actin and pooled from three independent experiments ( n = 6 rats/group). All data are shown as means +- SEM; * p < 0.05 vs. control, ** p < 0.05 vs. T2DM, # p < 0.05 vs. metformin administration, and @ p < 0.05 vs. PA administration.