Explore
 Validate
 Learn
Learn Western blot
Antibody data
- Antibody Data
- Antigen structure
- References [1]
- Comments [0]
- Validations
- Western blot [5]
- Immunocytochemistry [1]
- Immunohistochemistry [1]
- Other assay [1]
Submit
Validation data
Reference
Comment
Report error
- Product number
- PA5-28645 - Provider product page

- Provider
- Invitrogen Antibodies
- Product name
- Anillin Polyclonal Antibody
- Antibody type
- Polyclonal
- Antigen
- Synthetic peptide
- Description
- Recommended positive controls: 293T, A431, HeLa, HepG2, C8D30. Store product as a concentrated solution. Centrifuge briefly prior to opening the vial.
- Reactivity
- Human, Mouse
- Host
- Rabbit
- Isotype
- IgG
- Vial size
- 100 µL
- Concentration
- 1 mg/mL
- Storage
- Store at 4°C short term. For long term storage, store at -20°C, avoiding freeze/thaw cycles.
Submitted references Oncogenic BRAF induces whole-genome doubling through suppression of cytokinesis.
Darp R, Vittoria MA, Ganem NJ, Ceol CJ
Nature communications 2022 Jul 15;13(1):4109
Nature communications 2022 Jul 15;13(1):4109
No comments: Submit comment
Supportive validation
- Submitted by
- Invitrogen Antibodies (provider)
- Main image
- Experimental details
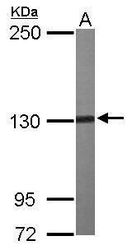
- Western blot analysis of Anillin using 30 µg of NIH-3T3 lysate. Samples were loaded onto a 5% SDS-PAGE gel and probed with an Anillin polyclonal antibody (Product # PA5-28645) at a dilution of 1:500.

- Submitted by
- Invitrogen Antibodies (provider)
- Main image
- Experimental details
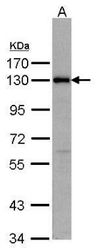
- Western blot analysis of Anillin using 30µg of 293T lysate. Samples were loaded onto a 7.5% SDS-PAGE gel and probed with an Anillin polyclonal antibody (Product # PA5-28645) at a dilution of 1:500.
- Submitted by
- Invitrogen Antibodies (provider)
- Main image
- Experimental details
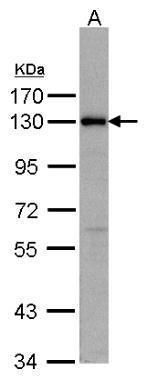
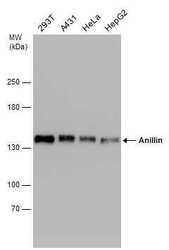
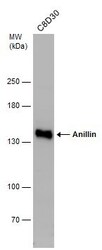
- Western Blot analysis of Anillin was performed by separating 30 µg of various whole cell extracts by 5% SDS-PAGE. Proteins were transferred to a membrane and probed with a Anillin Polyclonal Antibody (Product # PA5-28645) at a dilution of 1:500.
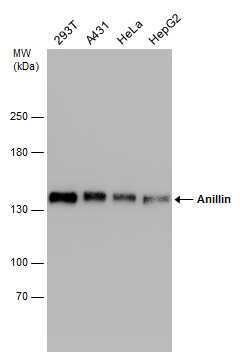
- Submitted by
- Invitrogen Antibodies (provider)
- Main image
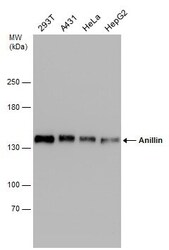
- Experimental details
- Western Blot analysis of Anillin was performed by separating 30 µg of various whole cell extracts by 5% SDS-PAGE. Proteins were transferred to a membrane and probed with a Anillin Polyclonal Antibody (Product # PA5-28645) at a dilution of 1:500.
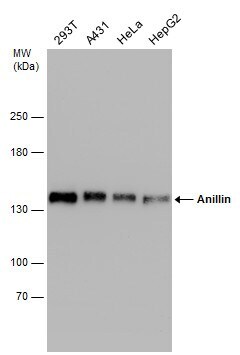
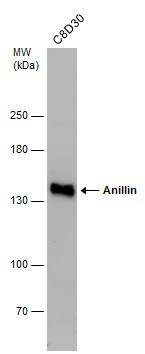
- Submitted by
- Invitrogen Antibodies (provider)
- Main image
- Experimental details
- Western Blot analysis of Anillin was performed by separating 30 µg of whole cell extract by 5% SDS-PAGE. Proteins were transferred to a membrane and probed with a Anillin Polyclonal Antibody (Product # PA5-28645) at a dilution of 1:500.
Supportive validation
- Submitted by
- Invitrogen Antibodies (provider)
- Main image

- Experimental details
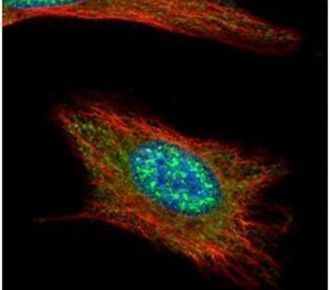
- Immunofluorescent analysis of Anillin in methanol-fixed HeLa cells using an Anillin polyclonal antibody (Product # PA5-28645) (Green) at a 1:500 dilution. Alpha-tubulin filaments were labeled with Product # PA5-29281 (Red) at a 1:2000.
Supportive validation
- Submitted by
- Invitrogen Antibodies (provider)
- Main image
- Experimental details
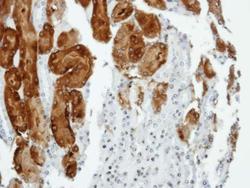
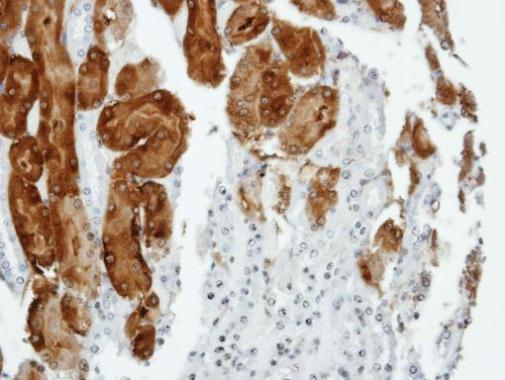
- Immunohistochemical analysis of paraffin-embedded human Kidney, using Anillin (Product # PA5-28645) antibody at 1:100 dilution. Antigen Retrieval: EDTA based buffer, pH 8.0, 15 min.
Supportive validation
- Submitted by
- Invitrogen Antibodies (provider)
- Main image
- Experimental details
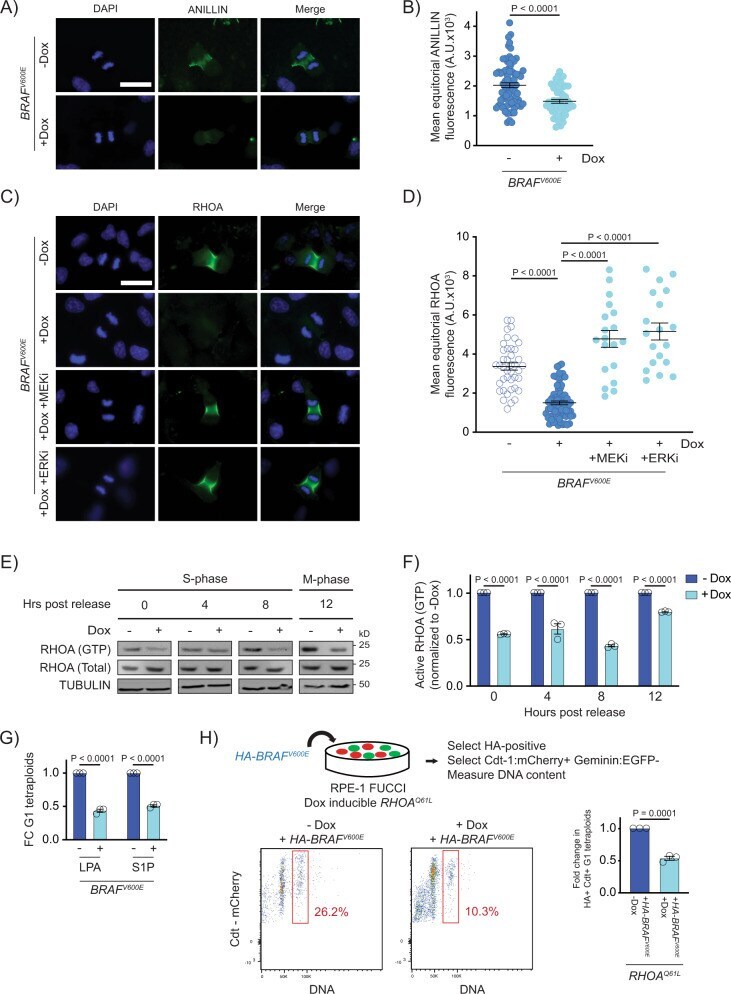
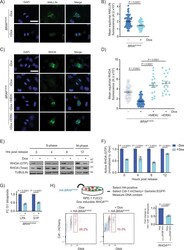
- Fig. 3 BRAF V600E causes cytokinesis failure by reducing the localization and function of RhoA. A DAPI and anti-ANILLIN staining in control (-Dox) and BRAF V600E -expressing (+Dox) anaphase RPE-1 cells. Images are maximum intensity projections of z-stacks. Scale bar = 7.5 uM. B Mean ANILLIN fluorescence intensity at the equator of control and BRAF V600E -expressing anaphase RPE-1 cells. N = 79 cells for -Dox and N = 53 for +Dox. Unpaired Student's t test. Error bars represent mean +- SEM. C DAPI and anti-RHOA staining in - BRAF V600E (-Dox) cells, BRAF V600E -expressing (+Dox) cells, and BRAF V600E -expressing (+Dox) RPE-1 cells treated with MEKi or ERKi. Drugs were added coincident with Dox administration. Images are maximum intensity projections of z-stacks (0.20 uM). Scale bar = 7.5 uM. D Mean RHOA fluorescence intensity at the equator of control RPE-1 cells, BRAF V600E -expressing RPE-1 cells, and BRAF V600E -expressing RPE-1 cells treated with MEKi or ERKi. N = 41 cells for -Dox, N = 68 for +Dox, N = 19 for +Dox +MEKi, and N = 19 for +Dox +ERKi. Brown-Forsythe and Welch one-way ANOVA with Dunnett's multiple comparisons test. Error bars represent mean +- SEM. E Western blot analysis of immunoprecipitated RHOA-GTP from control (-Dox) and BRAF V600E -expressing (+Dox) RPE-1 cell lysates at different time points post thymidine release. Total RHOA protein and alpha tubulin were used as a controls. A representative of three independent biological replicates is shown. F Western