Explore
 Validate
 Learn
Learn Western blot
Antibody data
- Antibody Data
- Antigen structure
- References [18]
- Comments [0]
- Validations
- Western blot [2]
- Immunocytochemistry [2]
- Immunohistochemistry [3]
- Flow cytometry [6]
- Other assay [15]
Submit
Validation data
Reference
Comment
Report error
- Product number
- MA1-112 - Provider product page

- Provider
- Invitrogen Antibodies
- Product name
- HMOX1 Monoclonal Antibody (HO-1-1)
- Antibody type
- Monoclonal
- Antigen
- Synthetic peptide
- Description
- This antibody detects an ~32 kDa protein corresponding to the apparent molecular mass of HO-1 on SDS-PAGE immunoblots, in samples from human, mouse, rat, bovine and dog origins. This antibody does not cross-react with HO-2. This antibody was originally validated as part of a Thermo Scientific Cellomics High Content Screening Kit. The antibody sold separately may have slightly different performance and may need to be further optimized for the best results.
- Reactivity
- Human, Mouse, Rat, Bovine, Canine
- Host
- Mouse
- Isotype
- IgG
- Antibody clone number
- HO-1-1
- Vial size
- 200 μg
- Concentration
- 1 mg/mL
- Storage
- -20°C, Avoid Freeze/Thaw Cycles
Submitted references Novel Secreted Peptides From Rhizopus arrhizus var. delemar With Immunomodulatory Effects That Enhance Fungal Pathogenesis.
Human iPSC-derived renal organoids engineered to report oxidative stress can predict drug-induced toxicity.
Glial Nrf2 signaling mediates the neuroprotection exerted by Gastrodia elata Blume in Lrrk2-G2019S Parkinson's disease.
Esomeprazole attenuates inflammatory and fibrotic response in lung cells through the MAPK/Nrf2/HO1 pathway.
Heme Oxygenase-1 Contributes to Both the Engulfment and the Anti-Inflammatory Program of Macrophages during Efferocytosis.
Analysis of immune-related key genes in Alzheimer's disease.
NRF2 and PPAR-γ Pathways in Oligodendrocyte Progenitors: Focus on ROS Protection, Mitochondrial Biogenesis and Promotion of Cell Differentiation.
High-throughput small molecule screening reveals Nrf2-dependent and -independent pathways of cellular stress resistance.
HO-1 overexpression alleviates senescence by inducing autophagy via the mitochondrial route in human nucleus pulposus cells.
Discovery of Mitochondrial Transcription Inhibitors Active in Pancreatic Cancer Cells.
Biochemical study on the protective effect of curcumin on acetaminophen and gamma-irradiation induced hepatic toxicity in rats.
BACH1 Stabilization by Antioxidants Stimulates Lung Cancer Metastasis.
The immunophenotype of decidual macrophages in acute atherosis.
Real-time in vivo imaging reveals localised Nrf2 stress responses associated with direct and metabolism-dependent drug toxicity.
Role of OSGIN1 in mediating smoking-induced autophagy in the human airway epithelium.
Activation of PPARγ by baicalin attenuates pulmonary hypertension in an infant rat model by suppressing HMGB1/RAGE signaling.
Anti-fatigue effect of Myelophil in a chronic forced exercise mouse model.
The traditional drug Gongjin-Dan ameliorates chronic fatigue in a forced-stress mouse exercise model.
Soliman SSM, El-Labbad EM, Abu-Qiyas A, Fayed B, Hamoda AM, Al-Rawi AM, Dakalbab S, El-Shorbagi AA, Hamad M, Ibrahim AS, Mohammad MG
Frontiers in microbiology 2022;13:863133
Frontiers in microbiology 2022;13:863133
Human iPSC-derived renal organoids engineered to report oxidative stress can predict drug-induced toxicity.
Lawrence ML, Elhendawi M, Morlock M, Liu W, Liu S, Palakkan A, Seidl LF, Hohenstein P, Sjögren AK, Davies JA
iScience 2022 Mar 18;25(3):103884
iScience 2022 Mar 18;25(3):103884
Glial Nrf2 signaling mediates the neuroprotection exerted by Gastrodia elata Blume in Lrrk2-G2019S Parkinson's disease.
Lin YE, Lin CH, Ho EP, Ke YC, Petridi S, Elliott CJ, Sheen LY, Chien CT
eLife 2021 Nov 15;10
eLife 2021 Nov 15;10
Esomeprazole attenuates inflammatory and fibrotic response in lung cells through the MAPK/Nrf2/HO1 pathway.
Ebrahimpour A, Wang M, Li L, Jegga AG, Bonnen MD, Eissa NT, Raghu G, Jyothula S, Kheradmand F, Hanania NA, Rosas IO, Ghebre YT
Journal of inflammation (London, England) 2021 May 19;18(1):17
Journal of inflammation (London, England) 2021 May 19;18(1):17
Heme Oxygenase-1 Contributes to Both the Engulfment and the Anti-Inflammatory Program of Macrophages during Efferocytosis.
Fige É, Szendrei J, Sós L, Kraszewska I, Potor L, Balla J, Szondy Z
Cells 2021 Mar 15;10(3)
Cells 2021 Mar 15;10(3)
Analysis of immune-related key genes in Alzheimer's disease.
Wu Y, Liang S, Zhu H, Zhu Y
Bioengineered 2021 Dec;12(2):9610-9624
Bioengineered 2021 Dec;12(2):9610-9624
NRF2 and PPAR-γ Pathways in Oligodendrocyte Progenitors: Focus on ROS Protection, Mitochondrial Biogenesis and Promotion of Cell Differentiation.
De Nuccio C, Bernardo A, Troiano C, Brignone MS, Falchi M, Greco A, Rosini M, Basagni F, Lanni C, Serafini MM, Minghetti L, Visentin S
International journal of molecular sciences 2020 Sep 29;21(19)
International journal of molecular sciences 2020 Sep 29;21(19)
High-throughput small molecule screening reveals Nrf2-dependent and -independent pathways of cellular stress resistance.
Lombard DB, Kohler WJ, Guo AH, Gendron C, Han M, Ding W, Lyu Y, Ching TT, Wang FY, Chakraborty TS, Nikolovska-Coleska Z, Duan Y, Girke T, Hsu AL, Pletcher SD, Miller RA
Science advances 2020 Oct;6(40)
Science advances 2020 Oct;6(40)
HO-1 overexpression alleviates senescence by inducing autophagy via the mitochondrial route in human nucleus pulposus cells.
Yi W, Lan H, Wen Y, Wang Y, He D, Bai Z, Zhang Y, Jiang W, Liu B, Shen J, Hu Z
Journal of cellular physiology 2020 Nov;235(11):8402-8415
Journal of cellular physiology 2020 Nov;235(11):8402-8415
Discovery of Mitochondrial Transcription Inhibitors Active in Pancreatic Cancer Cells.
Chen W, Hu S, Mao S, Xu Y, Guo H, Li H, Paulsen MT, Chen X, Ljungman M, Neamati N
ChemMedChem 2020 Nov 4;15(21):2029-2039
ChemMedChem 2020 Nov 4;15(21):2029-2039
Biochemical study on the protective effect of curcumin on acetaminophen and gamma-irradiation induced hepatic toxicity in rats.
Eassawy MMT, Salem AA, Ismail AFM
Environmental toxicology 2020 Dec 17;
Environmental toxicology 2020 Dec 17;
BACH1 Stabilization by Antioxidants Stimulates Lung Cancer Metastasis.
Wiel C, Le Gal K, Ibrahim MX, Jahangir CA, Kashif M, Yao H, Ziegler DV, Xu X, Ghosh T, Mondal T, Kanduri C, Lindahl P, Sayin VI, Bergo MO
Cell 2019 Jul 11;178(2):330-345.e22
Cell 2019 Jul 11;178(2):330-345.e22
The immunophenotype of decidual macrophages in acute atherosis.
Gill N, Leng Y, Romero R, Xu Y, Panaitescu B, Miller D, Arif A, Mumuni S, Qureshi F, Hsu CD, Hassan SS, Staff AC, Gomez-Lopez N
American journal of reproductive immunology (New York, N.Y. : 1989) 2019 Apr;81(4):e13098
American journal of reproductive immunology (New York, N.Y. : 1989) 2019 Apr;81(4):e13098
Real-time in vivo imaging reveals localised Nrf2 stress responses associated with direct and metabolism-dependent drug toxicity.
Forootan SS, Mutter FE, Kipar A, Iwawaki T, Francis B, Goldring CE, Park BK, Copple IM
Scientific reports 2017 Nov 22;7(1):16084
Scientific reports 2017 Nov 22;7(1):16084
Role of OSGIN1 in mediating smoking-induced autophagy in the human airway epithelium.
Wang G, Zhou H, Strulovici-Barel Y, Al-Hijji M, Ou X, Salit J, Walters MS, Staudt MR, Kaner RJ, Crystal RG
Autophagy 2017 Jul 3;13(7):1205-1220
Autophagy 2017 Jul 3;13(7):1205-1220
Activation of PPARγ by baicalin attenuates pulmonary hypertension in an infant rat model by suppressing HMGB1/RAGE signaling.
Chen Z, Wang Q
FEBS open bio 2017 Apr;7(4):477-484
FEBS open bio 2017 Apr;7(4):477-484
Anti-fatigue effect of Myelophil in a chronic forced exercise mouse model.
Lee JS, Kim HG, Han JM, Kim YA, Son CG
European journal of pharmacology 2015 Oct 5;764:100-108
European journal of pharmacology 2015 Oct 5;764:100-108
The traditional drug Gongjin-Dan ameliorates chronic fatigue in a forced-stress mouse exercise model.
Hong SS, Lee JY, Lee JS, Lee HW, Kim HG, Lee SK, Park BK, Son CG
Journal of ethnopharmacology 2015 Jun 20;168:268-78
Journal of ethnopharmacology 2015 Jun 20;168:268-78
No comments: Submit comment
Supportive validation
- Submitted by
- Invitrogen Antibodies (provider)
- Main image
- Experimental details
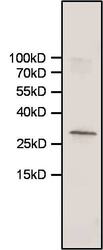
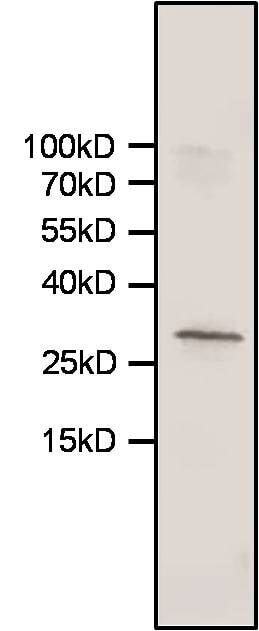
- Western blot analysis of Heme-Oxygenase-1 was performed by loading 30 µg of whole cell lysates from T-REx-293 cells (Product # R710-07) per well onto an SDS-PAGE gel. Proteins were transferred to a nitrocellulose membrane and blocked for 1 hour at room temperature. The membrane was probed with a Heme-Oxygenase-1 monoclonal antibody (Product # MA1-112) at a dilution of 1:1000 for 1 hour at room temperature, washed in TBST, and probed with a near IR-dye-conjugated goat anti-mouse IgG secondary antibody at a dilution of 1:15,000 for 40 minutes at room temperature. Detection was performed using a near-IR imaging system. Data courtesy of the Innovators Program.
- Submitted by
- Invitrogen Antibodies (provider)
- Main image
- Experimental details
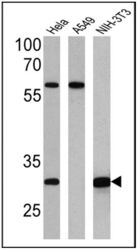
- Western blot analysis of Heme-Oxygenase-1 was performed by loading 25 µg of Hela (lane 1), A549 (lane 2) and NIH-3T3 (lane 3) cell lysates onto an SDS polyacrylamide gel. Proteins were transferred to a PVDF membrane and blocked at 4ºC overnight. The membrane was probed with a Heme-Oxygenase-1 monoclonal antibody (Product # MA1-112) at a dilution of 1:100 (Hela) and 1:500 (A549 and NIH-3T3) overnight at 4°C, washed in TBST, and probed with an HRP-conjugated secondary antibody for 1 hr at room temperature in the dark. Chemiluminescent detection was performed using Pierce ECL Plus Western Blotting Substrate (Product # 32132). Results show a band at ~32 kDa.

Supportive validation
- Submitted by
- Invitrogen Antibodies (provider)
- Main image

- Experimental details
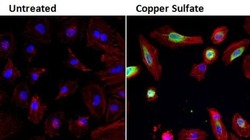
- Immunofluorescent analysis of Heme Oxygenase-1 (HO-1, green) in HeLa cells either left untreated (left panel) or treated with 0.5mM copper sulfate (right panel) for 24 hours. Formalin fixed cells were permeabilized with 0.1% Triton X-100 in TBS for 10 minutes at room temperature and blocked with 1% Blocker BSA (Product # 37525) for 15 minutes at room temperature. Cells were probed with an HO-1 monoclonal antibody (Product # MA1-112) at a dilution of 1:100 for at least 1 hour at room temperature, washed with PBS, and incubated with DyLight 488 goat anti-mouse IgG secondary antibody (Product # 35502) at a dilution of 1:400 for 30 minutes at room temperature. F-Actin (red) was stained with DyLight 554 Phalloidin (Product # 21834) and nuclei (blue) were stained with Hoechst 33342 dye (Product # 62249). Images were taken on a Thermo Scientific ArrayScan or ToxInsight Instrument at 20X magnification.

- Submitted by
- Invitrogen Antibodies (provider)
- Main image
- Experimental details
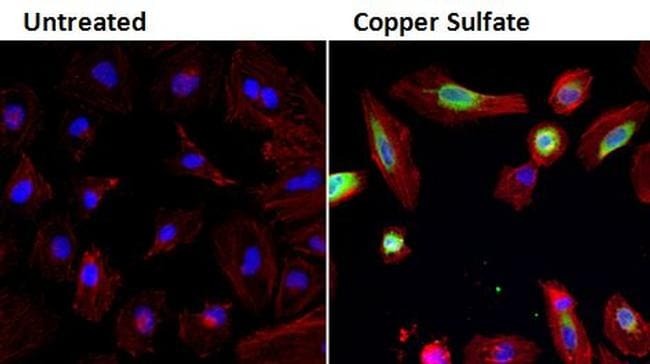
- Immunofluorescent analysis of Heme Oxygenase-1 (HO-1, green) in HeLa cells either left untreated (left panel) or treated with 0.5mM copper sulfate (right panel) for 24 hours. Formalin fixed cells were permeabilized with 0.1% Triton X-100 in TBS for 10 minutes at room temperature and blocked with 1% Blocker BSA (Product # 37525) for 15 minutes at room temperature. Cells were probed with an HO-1 monoclonal antibody (Product # MA1-112) at a dilution of 1:100 for at least 1 hour at room temperature, washed with PBS, and incubated with DyLight 488 goat anti-mouse IgG secondary antibody (Product # 35502) at a dilution of 1:400 for 30 minutes at room temperature. F-Actin (red) was stained with DyLight 554 Phalloidin (Product # 21834) and nuclei (blue) were stained with Hoechst 33342 dye (Product # 62249). Images were taken on a Thermo Scientific ArrayScan or ToxInsight Instrument at 20X magnification.
Supportive validation
- Submitted by
- Invitrogen Antibodies (provider)
- Main image
- Experimental details
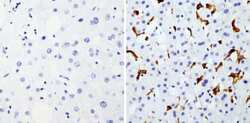
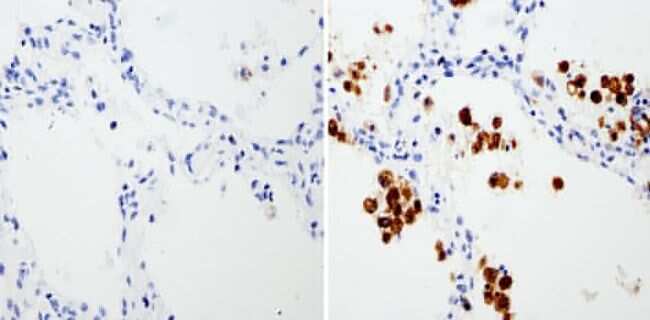
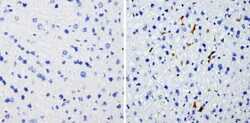
- Immunohistochemistry analysis of Heme-Oxygenase-1 showing staining in the microsomes of paraffin-embedded human liver tissue (right) compared with a negative control without primary antibody (left). To expose target proteins, antigen retrieval was performed using 10mM sodium citrate (pH 6.0), microwaved for 8-15 min. Following antigen retrieval, tissues were blocked in 3% H2O2-methanol for 15 min at room temperature, washed with ddH2O and PBS, and then probed with a Heme-Oxygenase-1 monoclonal antibody (Product # MA1-112) diluted in 3% BSA-PBS at a dilution of 1:200 overnight at 4°C in a humidified chamber. Tissues were washed extensively in PBST and detection was performed using an HRP-conjugated secondary antibody followed by colorimetric detection using a DAB kit. Tissues were counterstained with hematoxylin and dehydrated with ethanol and xylene to prep for mounting.
- Submitted by
- Invitrogen Antibodies (provider)
- Main image

- Experimental details
- Immunohistochemistry analysis of Heme-Oxygenase-1 showing staining in the microsomes of paraffin-embedded human lung tissue (right) compared with a negative control without primary antibody (left). To expose target proteins, antigen retrieval was performed using 10mM sodium citrate (pH 6.0), microwaved for 8-15 min. Following antigen retrieval, tissues were blocked in 3% H2O2-methanol for 15 min at room temperature, washed with ddH2O and PBS, and then probed with a Heme-Oxygenase-1 monoclonal antibody (Product # MA1-112) diluted in 3% BSA-PBS at a dilution of 1:500 overnight at 4°C in a humidified chamber. Tissues were washed extensively in PBST and detection was performed using an HRP-conjugated secondary antibody followed by colorimetric detection using a DAB kit. Tissues were counterstained with hematoxylin and dehydrated with ethanol and xylene to prep for mounting.
- Submitted by
- Invitrogen Antibodies (provider)
- Main image
- Experimental details
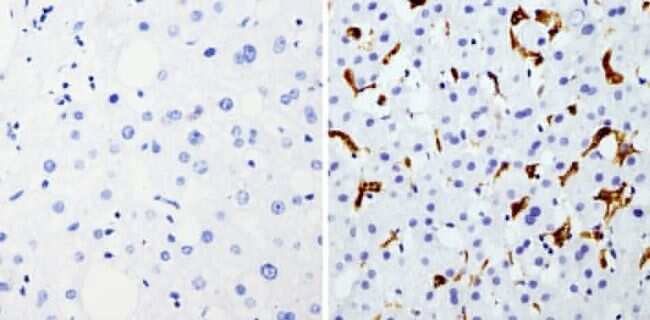
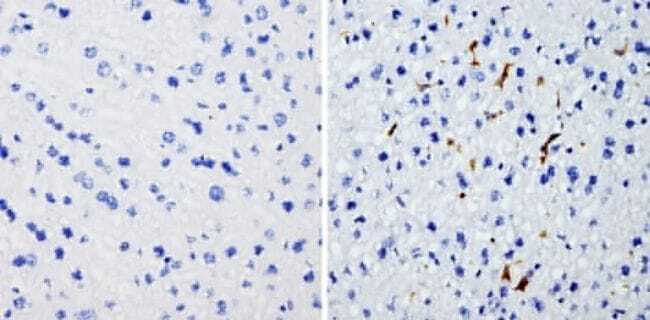
- Immunohistochemistry analysis of Heme-Oxygenase-1 showing staining in the microsomes of paraffin-embedded mouse liver tissue (right) compared with a negative control without primary antibody (left). To expose target proteins, antigen retrieval was performed using 10mM sodium citrate (pH 6.0), microwaved for 8-15 min. Following antigen retrieval, tissues were blocked in 3% H2O2-methanol for 15 min at room temperature, washed with ddH2O and PBS, and then probed with a Heme-Oxygenase-1 monoclonal antibody (Product # MA1-112) diluted in 3% BSA-PBS at a dilution of 1:200 overnight at 4°C in a humidified chamber. Tissues were washed extensively in PBST and detection was performed using an HRP-conjugated secondary antibody followed by colorimetric detection using a DAB kit. Tissues were counterstained with hematoxylin and dehydrated with ethanol and xylene to prep for mounting.
Supportive validation
- Submitted by
- Invitrogen Antibodies (provider)
- Main image
- Experimental details
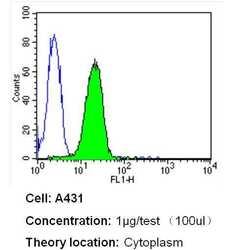
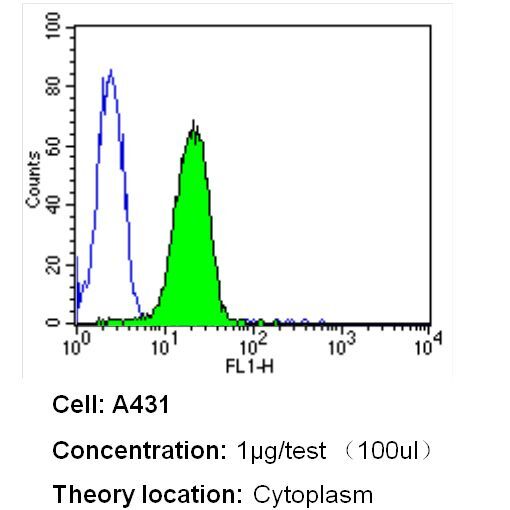
- Flow cytometry analysis of Heme-Oxygenase-1 in A431 cells (green) compared to an isotype control (blue). Cells were harvested, adjusted to a concentration of 1-5x10^6 cells/mL, fixed with 2% paraformaldehyde and washed with PBS. Cells were blocked with a 2% solution of BSA-PBS for 30 min at room temperature and incubated with a Heme-Oxygenase-1 monoclonal antibody (Product # MA1-112) at a dilution of 1 µg/test for 40 min at room temperature. Cells were then incubated for 40 min at room temperature in the dark using a Dylight 488-conjugated secondary antibody and re-suspended in PBS for FACS analysis.

- Submitted by
- Invitrogen Antibodies (provider)
- Main image
- Experimental details
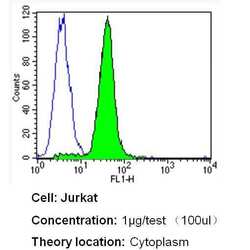
- Flow cytometry analysis of Heme-Oxygenase-1 in Jurkat cells (green) compared to an isotype control (blue). Cells were harvested, adjusted to a concentration of 1-5x10^6 cells/mL, fixed with 2% paraformaldehyde and washed with PBS. Cells were blocked with a 2% solution of BSA-PBS for 30 min at room temperature and incubated with a Heme-Oxygenase-1 monoclonal antibody (Product # MA1-112) at a dilution of 1 µg/test for 40 min at room temperature. Cells were then incubated for 40 min at room temperature in the dark using a Dylight 488-conjugated secondary antibody and re-suspended in PBS for FACS analysis.
- Submitted by
- Invitrogen Antibodies (provider)
- Main image
- Experimental details
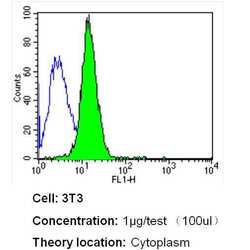
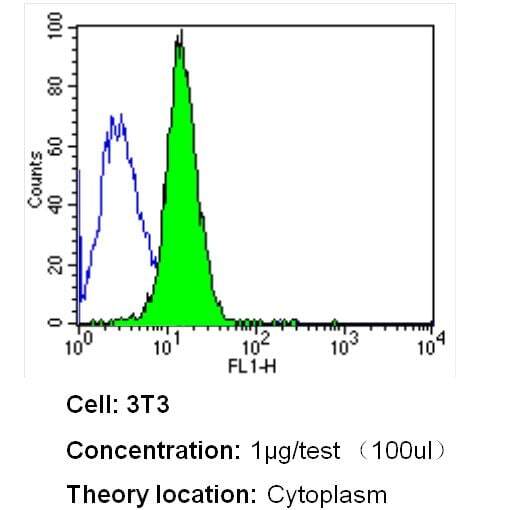
- Flow cytometry analysis of Heme-Oxygenase-1 in NIH-3T3 cells (green) compared to an isotype control (blue). Cells were harvested, adjusted to a concentration of 1-5x10^6 cells/mL, fixed with 2% paraformaldehyde and washed with PBS. Cells were blocked with a 2% solution of BSA-PBS for 30 min at room temperature and incubated with a Heme-Oxygenase-1 monoclonal antibody (Product # MA1-112) at a dilution of 1 µg/test for 40 min at room temperature. Cells were then incubated for 40 min at room temperature in the dark using a Dylight 488-conjugated secondary antibody and re-suspended in PBS for FACS analysis.

- Submitted by
- Invitrogen Antibodies (provider)
- Main image

- Experimental details
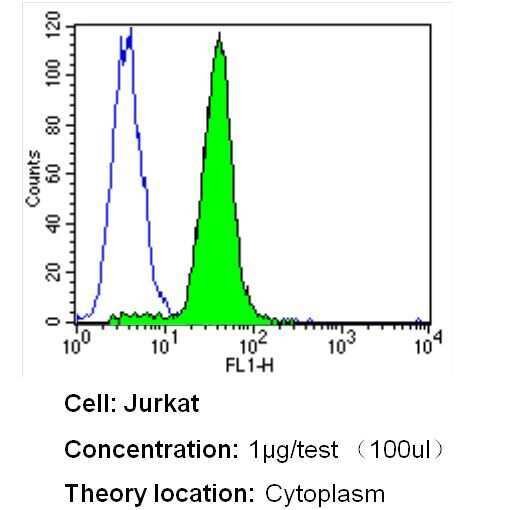
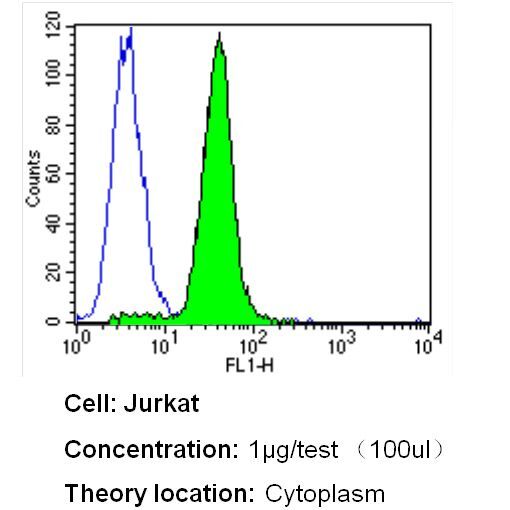
- Flow cytometry analysis of Heme-Oxygenase-1 in Jurkat cells (green) compared to an isotype control (blue). Cells were harvested, adjusted to a concentration of 1-5x10^6 cells/mL, fixed with 2% paraformaldehyde and washed with PBS. Cells were blocked with a 2% solution of BSA-PBS for 30 min at room temperature and incubated with a Heme-Oxygenase-1 monoclonal antibody (Product # MA1-112) at a dilution of 1 µg/test for 40 min at room temperature. Cells were then incubated for 40 min at room temperature in the dark using a Dylight 488-conjugated secondary antibody and re-suspended in PBS for FACS analysis.
- Submitted by
- Invitrogen Antibodies (provider)
- Main image

- Experimental details
- Flow cytometry analysis of Heme-Oxygenase-1 in NIH-3T3 cells (green) compared to an isotype control (blue). Cells were harvested, adjusted to a concentration of 1-5x10^6 cells/mL, fixed with 2% paraformaldehyde and washed with PBS. Cells were blocked with a 2% solution of BSA-PBS for 30 min at room temperature and incubated with a Heme-Oxygenase-1 monoclonal antibody (Product # MA1-112) at a dilution of 1 µg/test for 40 min at room temperature. Cells were then incubated for 40 min at room temperature in the dark using a Dylight 488-conjugated secondary antibody and re-suspended in PBS for FACS analysis.
- Submitted by
- Invitrogen Antibodies (provider)
- Main image

- Experimental details
- Flow cytometry analysis of Heme-Oxygenase-1 in A431 cells (green) compared to an isotype control (blue). Cells were harvested, adjusted to a concentration of 1-5x10^6 cells/mL, fixed with 2% paraformaldehyde and washed with PBS. Cells were blocked with a 2% solution of BSA-PBS for 30 min at room temperature and incubated with a Heme-Oxygenase-1 monoclonal antibody (Product # MA1-112) at a dilution of 1 µg/test for 40 min at room temperature. Cells were then incubated for 40 min at room temperature in the dark using a Dylight 488-conjugated secondary antibody and re-suspended in PBS for FACS analysis.
Supportive validation
- Submitted by
- Invitrogen Antibodies (provider)
- Main image
- Experimental details
- NULL

- Submitted by
- Invitrogen Antibodies (provider)
- Main image
- Experimental details
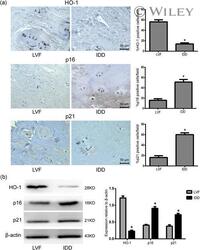
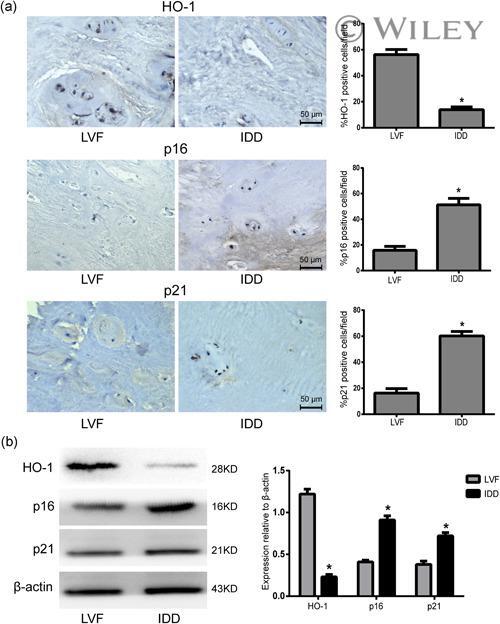
- 1 Figure HO-1 expression is associated with cell senescence in NP tissues. (a) Immunohistochemistry results of HO-1, p16, and p21 in NP tissues from LVF and IDD patients, n = 5. Scale bar = 50 muM. (b) Western blot analysis for the protein level of HO-1, p16, and p21, n = 5. All data were obtained from three independent experiments and shown as the mean +- SD . HO-1, heme oxygenase-1; IDD, intervertebral disc degeneration; LVF, lumbar vertebral fractures; NP, nucleus pulposus. * p < .05 compared with the LVF group
- Submitted by
- Invitrogen Antibodies (provider)
- Main image
- Experimental details
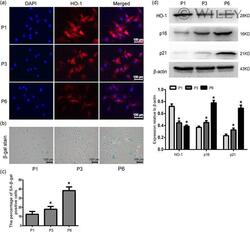
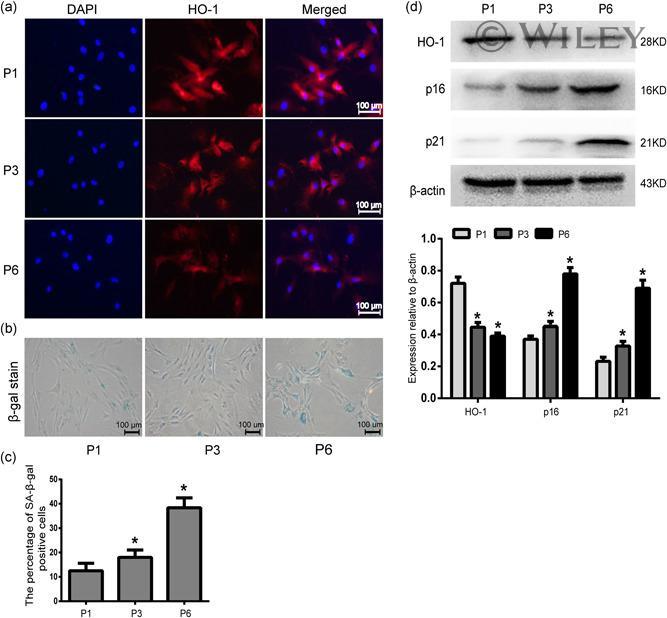
- 2 Figure HO-1 expression decreases in senescent NP cells. (a) Immunofluorescence of HO-1 in senescent NP cells, n = 6. Scale bar = 100 muM. (b) SA-beta-gal staining assay in senescent NP cells, n = 6. Scale bar = 100 muM (c) The quantitative evaluation result of SA-beta-gal-positive cells was analyzed by histogram, n = 6. (d) Western blots and quantification data of HO-1, p16 and p21 protein in senescent NP cells, n = 6. All data were obtained from three independent experiments and shown as the mean +- SD . DAPI, 4',6-diamidino-2-phenylindole; HO-1, heme oxygenase-1; NP, nucleus pulposus. * p < .05 compared with the P1 group
- Submitted by
- Invitrogen Antibodies (provider)
- Main image
- Experimental details
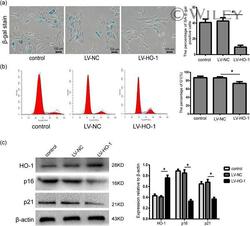
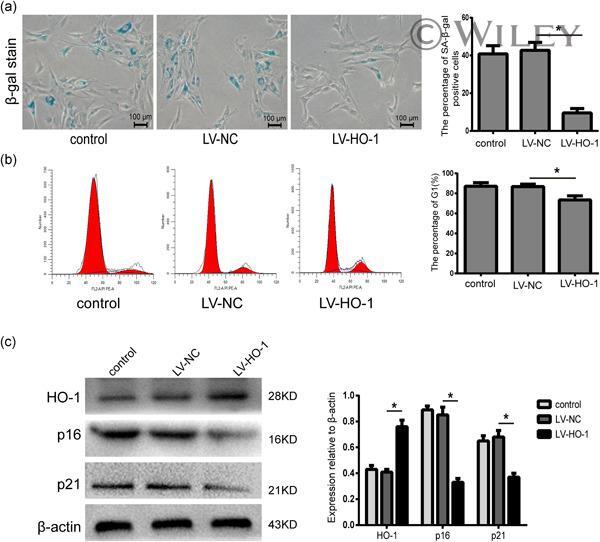
- 3 Figure HO-1 overexpression attenuated the replicative senescence of human NP cells. NP cells were passaged to the 6th generation for further detection. (a) SA-beta-gal staining assay was performed in each group with different treatments, n = 6. Scale bar = 100 muM. (b) NP cell cycle assay was measured by flow cytometry, n = 6. (c) Western blots and quantification data of HO-1, p16, and p21 protein in NP cells of each group, n = 6. All data were obtained from three independent experiments and shown as the mean +- SD . HO-1, heme oxygenase-1; NP, nucleus pulposus. * p < .05
- Submitted by
- Invitrogen Antibodies (provider)
- Main image

- Experimental details
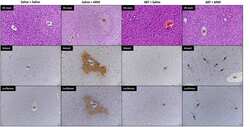
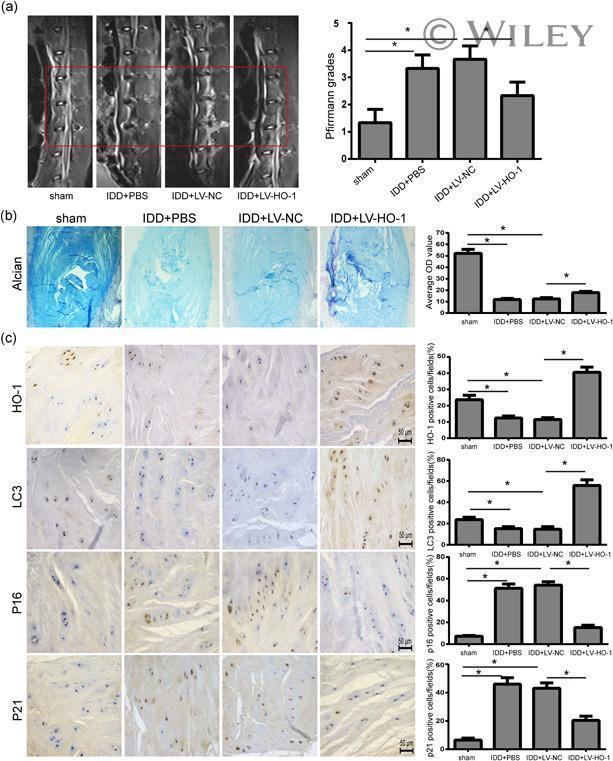
- 8 Figure HO-1 overexpression ameliorates IDD in rabbit puncture model in vivo. (a) MRI scans and relative Pfirrmann grade scores of a rabbit for punctured discs, n = 6. (b) Alcian blue staining for proteoglycan deposition in rabbit intervertebral disc tissues of each group (magnification x 40), n = 6. (c) Immunohistochemical staining for HO-1, LC3, p16, and p21 expressions in rabbit intervertebral disc tissues of each group, n = 6. Scale bar = 100 muM. All data were obtained from three independent experiments and shown as the mean +- SD , * p < .05. HO-1, heme oxygenase-1; IDD, intervertebral disc degeneration; LC3, light chain 3; MRI, magnetic resonance imaging; PBS, phosphate-buffered saline
- Submitted by
- Invitrogen Antibodies (provider)
- Main image

- Experimental details
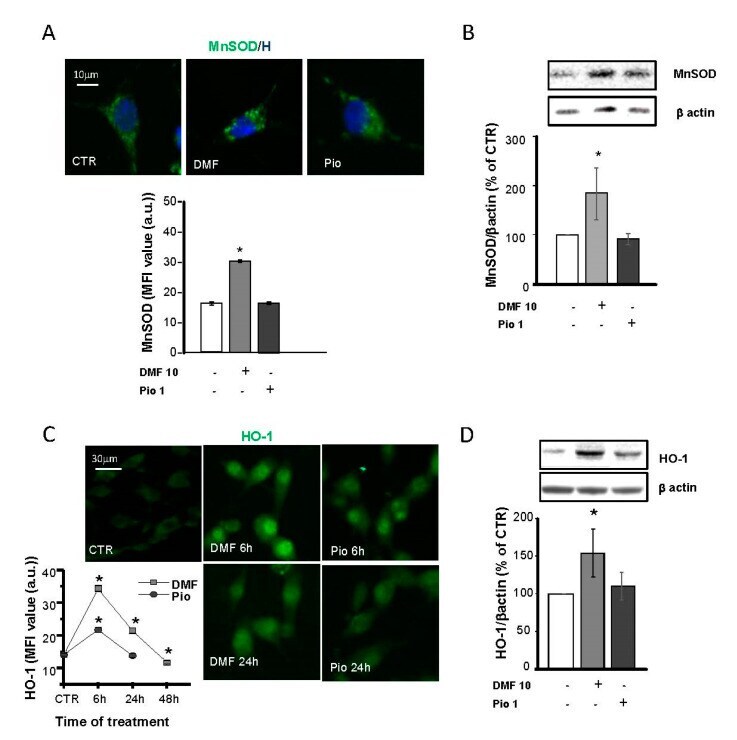
- Figure 4 DMF and pio differently regulate the antioxidant enzymes heme oxygenase 1 (HO-1) and MnSOD. OP cultures treated for 24 h (unless indicated) with 10-uM DMF or 1-uM pio were immunostained for MnSOD ( A ). The micrographs show MnSOD (green) and Hoechst 33258 (blue, H). The bar graph shows MFI analysis of the CTR and treated cells ( n = 250-300 cells; * p < 0.05 vs. CTR). WB analysis of MnSOD expression is shown ( B) . Representative bands of MnSOD and beta-actin are shown above. Mean and individual data points from the densitometric analysis are shown in the graph below ( n = 3; * p < 0.05 vs. CTR). OP cultures were treated with 10-uM DMF or 1-uM pio and then processed for IF experiments for HO-1 ( C ). The micrographs show HO-1 (green). The bar graph shows MFI ( n = 250-300 cells; * p < 0.05 vs. CTR). WB analysis of HO-1 expression is shown ( D ). Representative bands of beta-actin and HO-1 are shown above. Mean and individual data points from the densitometric analysis are shown in the graph below ( n = 3; * p < 0.05 vs. CTR).
- Submitted by
- Invitrogen Antibodies (provider)
- Main image
- Experimental details
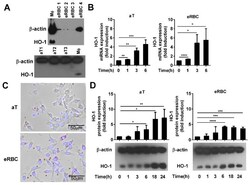
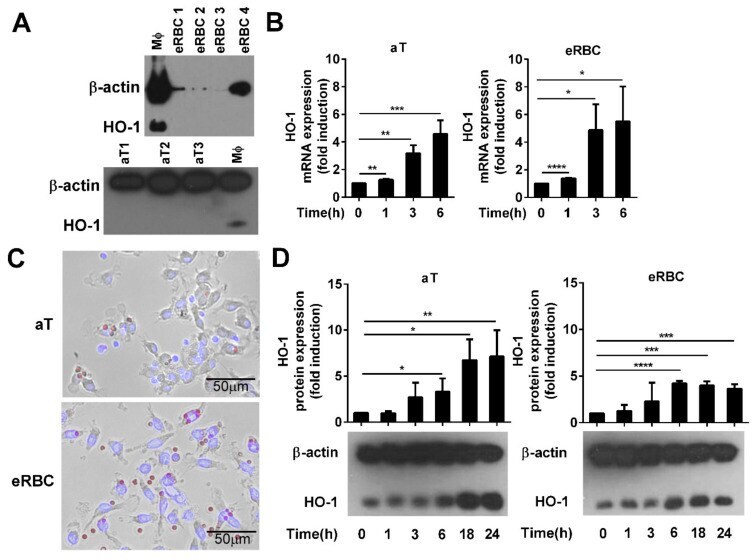
- Figure 1 Phagocytosis of apoptotic cells induces the expression of heme oxygenase-1 (HO-1) in engulfing macrophages. ( A ) Lack of detectable HO-1 expression in apoptotic thymocytes (aT) and eryptotic red blood cells (eRBCs) determined by Western blot analysis. beta-actin was used as a loading control. MPhi, macrophage. ( B ) Representative fluorescent microscopic images of macrophages engulfing apoptotic thymocytes or eryptotic RBCs. Scale 50 um. ( C ) Induction of HO-1 expression at mRNA levels in engulfing macrophages exposed to either apoptotic thymocytes or to eryptotic RBCs for the indicated time periods. mRNA expressions were determined by qRT-PCR using cyclophilin as a normalizing gene. Data are fold expressions as compared to the basal HO-1 mRNA expressions in non-engulfing macrophages. ( D ) Induction of HO-1 protein levels in engulfing macrophages exposed to apoptotic thymocytes or eryptotic RBCs for the indicated time periods. Protein levels were determined by Western blot analysis using beta-actin as a loading control. One representative Western blot is shown. Data are fold expressions as compared to the basal HO-1 protein expressions in non-engulfing macrophages. Data represent mean +- S.D. ( n = 3) * p < 0.05, ** p < 0.01, *** p < 0.001, **** p < 0.0001.
- Submitted by
- Invitrogen Antibodies (provider)
- Main image
- Experimental details
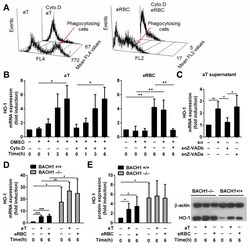
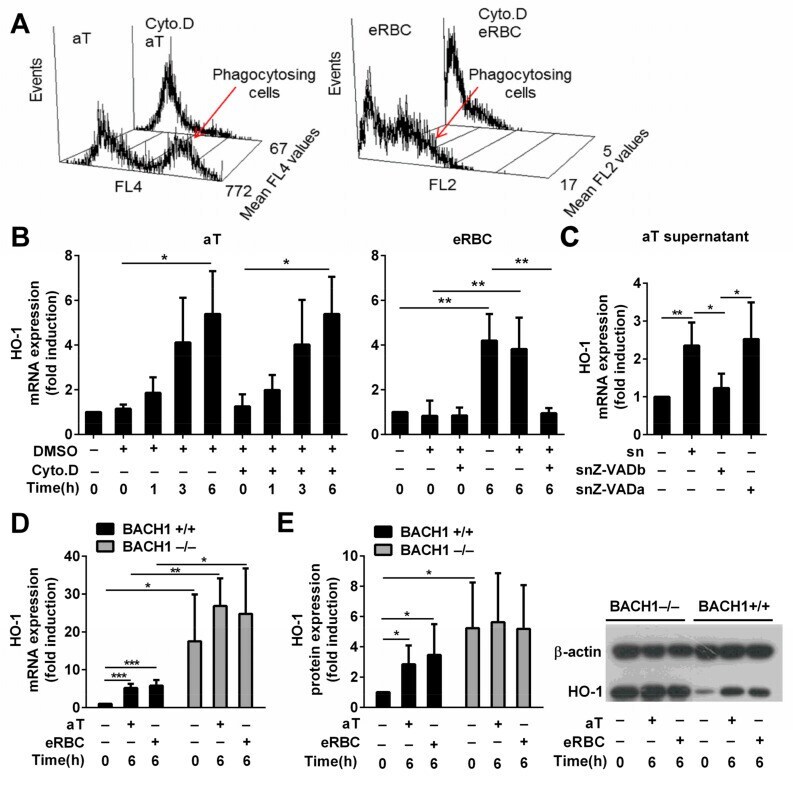
- Figure 2 HO-1 expression is BTB and CNC homology 1 (BACH1)-dependent and is induced by soluble signals in macrophages engulfing apoptotic thymocytes, while it is cell uptake-dependent in macrophages engulfing eryptotic RBCs. ( A ) Cytochalasin D, an actin polymerization inhibitor, administered at 5 muM concentration 30 min before phagocytosis inhibits the uptake of both apoptotic thymocytes and eryptotic RBCs determined after 1 h phagocytosis. Data show mean fluorescence intensity within the macrophage population. ( B ) Induction of HO-1 mRNA expression in macrophages engulfing apoptotic thymocytes or eryptotic RBCs in the presence and absence of 5 muM cytochalasin D determined by qRT-PCR using cyclophilin A as a normalizing gene. ( C ) Induction of HO-1 mRNA expression in macrophages exposed to the supernatant of apoptotic thymocytes collected after 24 h serum withdrawal in the presence (snZ-VADb) and absence (sn) of 20 muM Z-VAD-FMK. For determining the Z-VAD-FMK target cell, Z-VAD-FMK was also added directly to the macrophages together with the supernatant generated in the absence of Z-VAD-FMK (snZ-VADa). mRNA expressions were determined at 6 h after supernatant addition by qRT-PCR using cyclophilin A as a normalizing gene. ( D ) Induction of HO-1 mRNA expression in BACH1 +/+ and BACH1 -/- macrophages engulfing apoptotic thymocytes or eRBCs. mRNA expressions were determined by qRT-PCR using cyclophilin A as a normalizing gene. Data are fold expressions as compared to the b
- Submitted by
- Invitrogen Antibodies (provider)
- Main image
- Experimental details
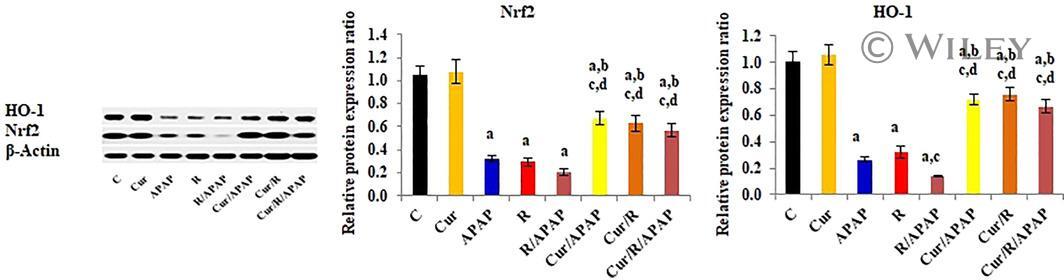
- 8 FIGURE Curcumin up-regulates the relative protein expression ratio of Nuclear factor erythroid-related factor-2 (Nrf2), and Hemeoxygenase-1 (HO-1) to beta-actin, determined by Western blot analysis in liver tissues of intoxicated rats. The results are demonstrated as mean +- SE, n = 10 rats/group. C, control untreated group; CUR, curcumin-pretreated rats; APAP, acetaminophen treated rats; R, gamma-irradiated rats; R/APAP, animals exposed to gamma-irradiation then intoxicated with APAP; CUR/APAP, Curcumin pretreated rats intoxicated with APAP; CUR/R, Curcumin pretreated rats then exposed to gamma-irradiation; CUR/R/APAP, Curcumin pretreated rats, exposed to gamma-irradiation and intoxicated with APAP; a: significant to the untreated control, b: significant to APAP, c: significant to R, and d: significant to R/APAP, ( p
- Submitted by
- Invitrogen Antibodies (provider)
- Main image
- Experimental details
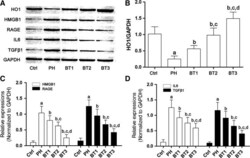
- Figure 4 Effects of baicalin on the HO 1- HMGB 1- RAGE pathway in infant rats with PH . (A) Immunoblots of HO 1, HMGB 1, RAGE , IL 6, TGF beta1 and GAPDH in lung tissue harvested from infant rats with PH . (B) The relative expression level of HO 1 in the Ctrl, PH , BT 1, BT 2 and BT 3 groups. (C) The relative expression of HMGB 1 (white columns) and RAGE (black columns) in the Ctrl, PH , BT 1, BT 2 and BT 3 groups. (D) The relative expression of IL 6 (white columns) and TGF beta1 (black columns) in the Ctrl, PH , BT 1, BT 2 and BT 3 groups. a-d: differences were significant when compared with Ctrl (a), PH (b), BT 1 (c) and BT 2 (d).

- Submitted by
- Invitrogen Antibodies (provider)
- Main image
- Experimental details
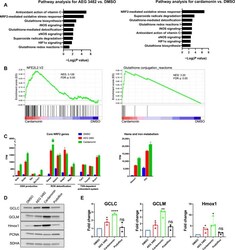
- Fig. 5 Nrf2 antioxidant signature in response to AEG 3482 or cardamonin treatment. ( A ) Pathways related to oxidative stress response from IPA for DE genes induced by AEG 3482 and cardominin. P values represented in negative log form; all pathways are significant at P < 0.05. eNOS, endothelial nitric oxide synthase; iNOS, inducible nitric oxide synthase. ( B ) GSEA for cardamonin for pathways indicated. NES, normalized enrichment score. ( C ) Transcripts in key pathways induced by Nrf2 are significantly elevated by AEG 3482 and cardamonin treatment. All FDRs for comparison to DMSO are q < 5 x 10 -6 . TPM, transcripts per million. ( D ) Immunoblot analysis of Nrf2 targets after treatment with indicated compounds for 48 hours. PCNA and SDHA serve as loading controls. ( E ) Immunoblot in (D) was performed three times using independent biological samples. Band intensities were quantified by ImageJ and then normalized to control loading band (SDHA or PCNA). Mean and SEM are designated. Each treatment was compared to DMSO via two-tailed unpaired t test. * P < 0.05, ** P < 0.01, and **** P < 0.0001. ns, not significant.

- Submitted by
- Invitrogen Antibodies (provider)
- Main image
- Experimental details
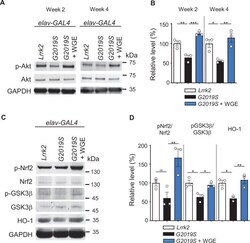
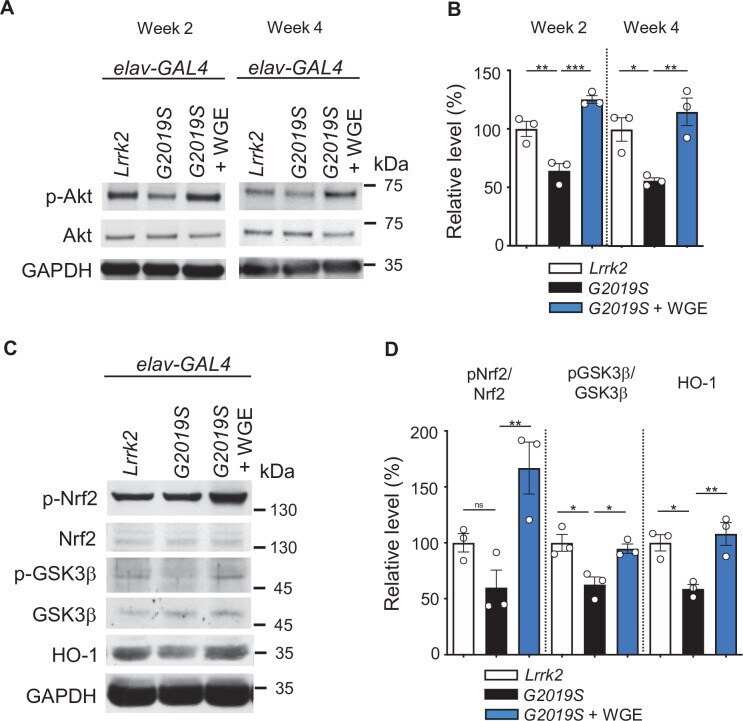
- Figure 4. Water extract of Gastrodia elata Blume (WGE) activates the Akt-Nrf2 pathway in elav>G2019S flies. ( A ) Representative immunoblots of 2- and 4-week-old adult brain lysates showing levels of Akt and pAkt in brain extracts of elav>Lrrk2 , elav>G2019S , and WGE-fed elav>G2019S flies. ( B ) Quantification (mean +- SEM, N = 3) of pAkt/Akt levels in 2- and 4-week-old adult brains. ( C ) Representative immunoblots of 4-week-old adult brain lysates showing levels of Nrf2, pNrf2 (phosphorylated at Ser 40 ), GSK3beta, pGSK3beta (phosphorylated at Ser 9 ), and HO-1 in elav>Lrrk2 , elav>G2019S , and WGE-fed elav>G2019S flies. GADPH acted as a loading control in ( A ) and ( C ). ( D ) Quantification (mean +- SEM, N = 3) of relative protein levels to respective Nrf2, GSK3beta, and HO-1. One-way ANOVA with Tukey's post-hoc multiple comparison test (relative to elav>G2019S ): *p
- Submitted by
- Invitrogen Antibodies (provider)
- Main image
- Experimental details
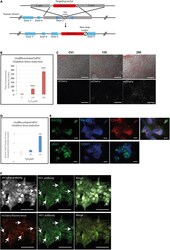
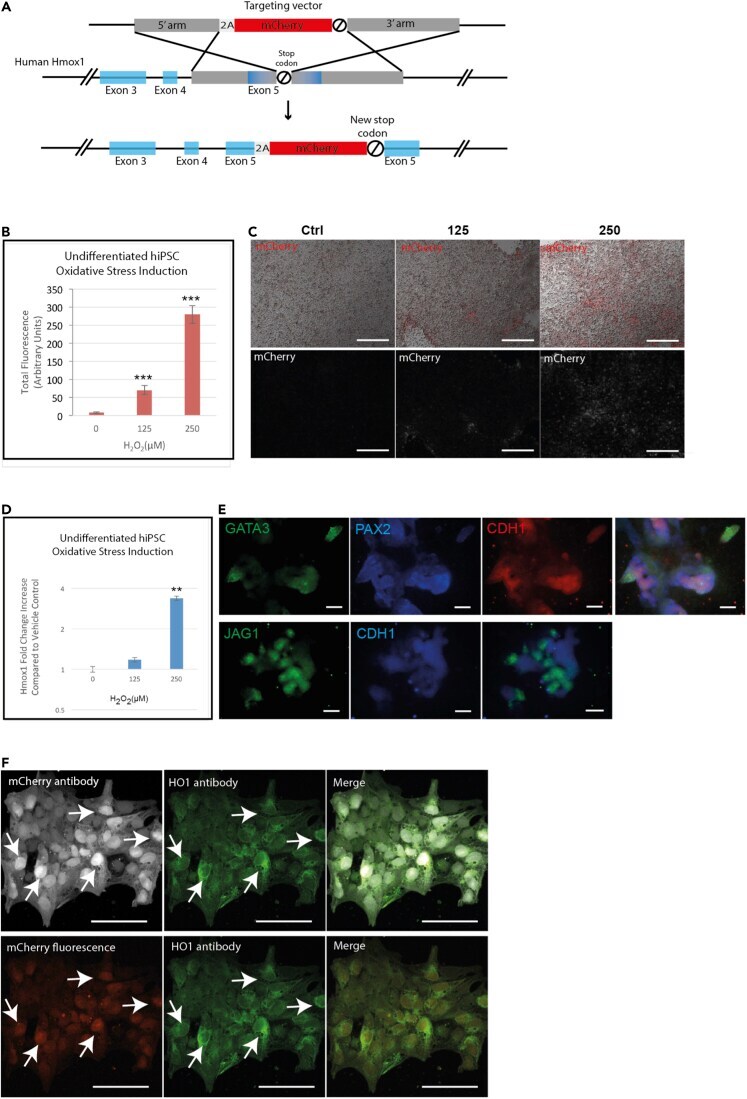
- Construction and verification of HMOX1 reporter hiPSCs (A) Targeting vector diagram showing insertion of 2A peptide-mCherry-STOP sequence replacing endogenous stop codon of human HMOX1 in hiPSCs using CRISPR gene editing. Homologous arms upstream (5': 500bp) and downstream (3': 1049bp) of the stop codon are shown in gray (B and C) Increase in mCherry expression in undifferentiated H O 1 -mCherry-hiPSCs after induction of oxidative stress with hydrogen peroxide by measuring total fluorescence and (C) representative images. Scale bars are 200 mum. (D) HMOX1 transcript increase in undifferentiated H O 1 -mCherry-hiPSCs after induction of oxidative stress (by qPCR). (E) H O 1 -mCherry-hiPSC differentiated flat renal organoids express nephron markers (GATA3, PAX2, CHD1, and JAG1) and form renal structures. Scale bars are 100 mum. (F) Cellular co-expression of HO-1 and mCherry in undifferentiated hiPSCs after induction of oxidative stress with hydrogen peroxide (150 muM), either using anti-HMOX1 and anti-mCherry antibodies (top panel) or anti-HMOX1 antibody together with reporter mCherry fluorescence (bottom panel). Scale bars are 100 muM. In all graphs, data are represented as mean +- SEM, and p < 0.05 is indicated with (*), p < 0.01 with (**) and p < 0.001 with (***)
- Submitted by
- Invitrogen Antibodies (provider)
- Main image
- Experimental details
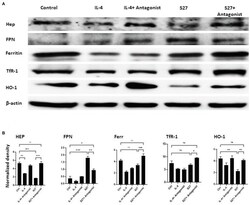
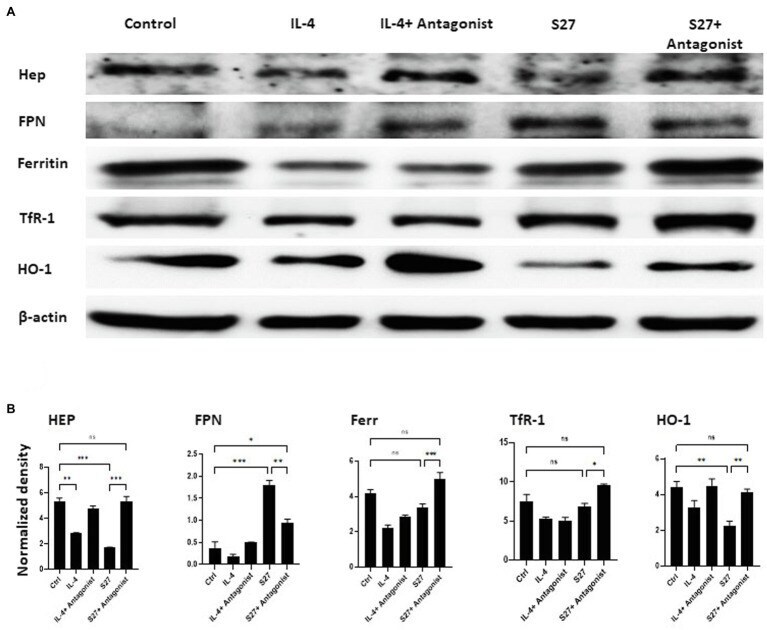
- Western blot analysis of the expression of Hep, FPN, Ferritin, TfR-1, and HO-1 in PBMMs cells treated with S27 alone or in the presence of STAT-6 antagonist. (A) Cell lysates were prepared from PBMMs treated with IL-4 at 15 ng/ml and in addition to STAT-6 antagonist at 1 muM and S27 at 10 ng/ml/STAT-6 antagonist at 1 muM. As they were cultured for 8 days. The results shown are representative of three experiments. (B) The band intensity was measured by densitometry using the Image J software. The results were analyzed using one-way ANOVA and presented as means +- SEM of three independent experiments. * p < 0.05, ** p < 0.01 and *** p < 0.001, which is significantly different from other groups.
- Submitted by
- Invitrogen Antibodies (provider)
- Main image
- Experimental details
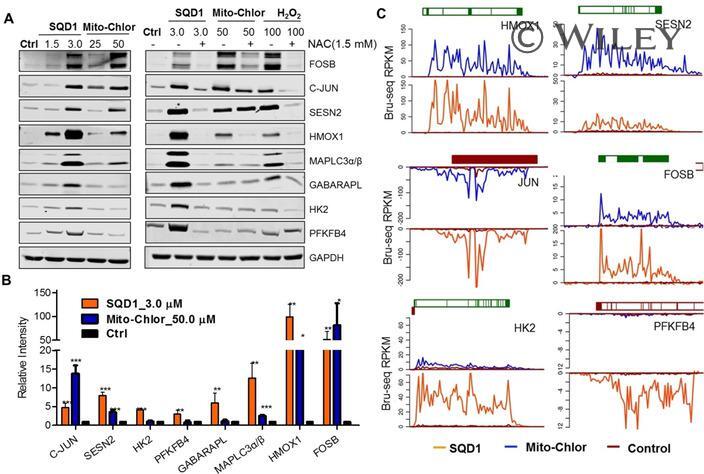
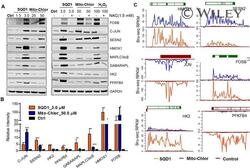
- Figure SQD1 , Mito-Chlor , and H 2 O 2 induced similar changes in protein expression in MIA PaCa-2 cells. (A), 24 h treatment of SQD1 increased the expression levels of FOSB, c-JUN, HMOX1, HK2, PFKFB4, MAPLC-3alpha/beta, and GABARAPL in a dose-dependent manner. Mito-Chlor treatment induced similar protein expression changes with the exception of GABARAPL, HK2, and PFKFB4. SQD1 -, Mito-Chlor -, and H 2 O 2 -induced changes in select protein levels were rescued by the addition of 1.5 mM NAC. (B), Protein levels induced by SQD1 and Mito-Chlor were quantified by ImageJ and normalized to respective loading controls. The data are presented as mean+-standard deviation of at least three independent experiments. * denotes p