Explore
 Validate
 Learn
Learn Western blot
 Immunocytochemistry
Antibody data
- Antibody Data
- Antigen structure
- References [2]
- Comments [0]
- Validations
- Immunocytochemistry [1]
- Immunohistochemistry [1]
- Other assay [2]
Submit
Validation data
Reference
Comment
Report error
- Product number
- PA5-29961 - Provider product page

- Provider
- Invitrogen Antibodies
- Product name
- Acid Phosphatase 2 Polyclonal Antibody
- Antibody type
- Polyclonal
- Antigen
- Recombinant full-length protein
- Description
- Recommended positive controls: A431, H1299, HeLa, HepG2, H3347, CX-1, SW48, HCT116, Human Lymphoma Tissue. Predicted reactivity: Mouse (87%), Rat (87%), Pig (94%), Chimpanzee (100%), Bovine (94%). Store product as a concentrated solution. Centrifuge briefly prior to opening the vial.
- Reactivity
- Human
- Host
- Rabbit
- Isotype
- IgG
- Vial size
- 100 μL
- Concentration
- 1 mg/mL
- Storage
- Store at 4°C short term. For long term storage, store at -20°C, avoiding freeze/thaw cycles.
Submitted references AMPylation profiling during neuronal differentiation reveals extensive variation on lysosomal proteins.
Proteomics reveals signal peptide features determining the client specificity in human TRAP-dependent ER protein import.
Becker T, Cappel C, Di Matteo F, Sonsalla G, Kaminska E, Spada F, Cappello S, Damme M, Kielkowski P
iScience 2021 Dec 17;24(12):103521
iScience 2021 Dec 17;24(12):103521
Proteomics reveals signal peptide features determining the client specificity in human TRAP-dependent ER protein import.
Nguyen D, Stutz R, Schorr S, Lang S, Pfeffer S, Freeze HH, Förster F, Helms V, Dudek J, Zimmermann R
Nature communications 2018 Sep 14;9(1):3765
Nature communications 2018 Sep 14;9(1):3765
No comments: Submit comment
Supportive validation
- Submitted by
- Invitrogen Antibodies (provider)
- Main image

- Experimental details
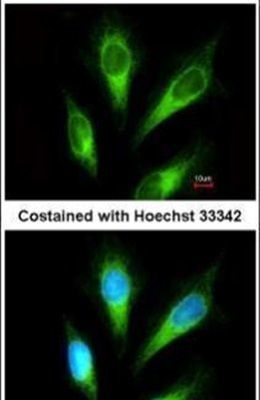
- Immunofluorescent analysis of ACP2 in methanol-fixed HeLa cells using an ACP2 polyclonal antibody (Product # PA5-29961) at a 1:200 dilution.
Supportive validation
- Submitted by
- Invitrogen Antibodies (provider)
- Main image
- Experimental details
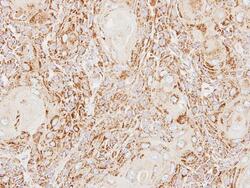
- Acid Phosphatase 2 Polyclonal Antibody detects ACP2 protein at lysosome on Ca922 xenograft by immunohistochemical analysis. Sample: Paraffin-embedded Ca922 xenograft. Acid Phosphatase 2 Polyclonal Antibody (Product # PA5-29961) dilution: 1:500. Antigen Retrieval: EDTA based buffer, pH 8.0, 15 min.

Supportive validation
- Submitted by
- Invitrogen Antibodies (provider)
- Main image
- Experimental details
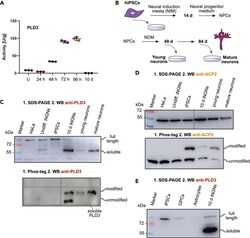
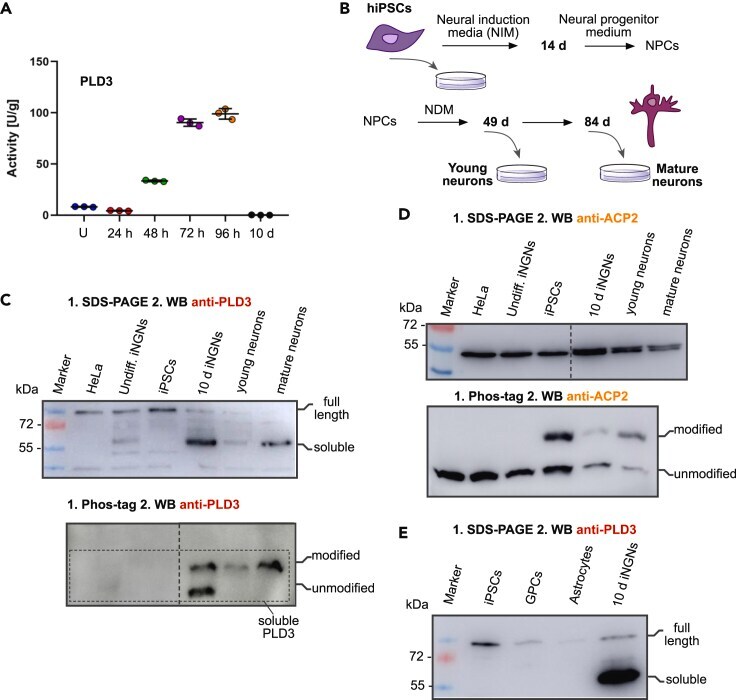
- Figure 4 Modification of PLD3 correlates with its activity in neurons (A) PLD3 5' exonuclease activity assay correlates the amount of the soluble PLD3 form with its activity and shows the modification to inhibit the catalytic activity ( n = 3, line indicates the mean, error bars show the standard deviation). (B) Directed differentiation protocol of human iPSCs into dopaminergic neurons. NDM, neural differentiation medium. (C) SDS-PAGE and Phos-tag ligand SDS-PAGE separations followed by western blot using the anti-PLD3 antibody show pronounced and nearly quantitative modification, likely AMPylation of PLD3 in dopaminergic neurons compared with the iNGN forward reprogramming. (D) ACP2 SDS-PAGE and Phos-tag ligand SDS-PAGE separations followed by western blot using anti-ACP2 antibody. (E) SDS-PAGE followed by western blot using the anti-PLD3 antibody detects solely the full-length PLD3 in iPSCs, GPCs, and astrocytes.
- Submitted by
- Invitrogen Antibodies (provider)
- Main image

- Experimental details
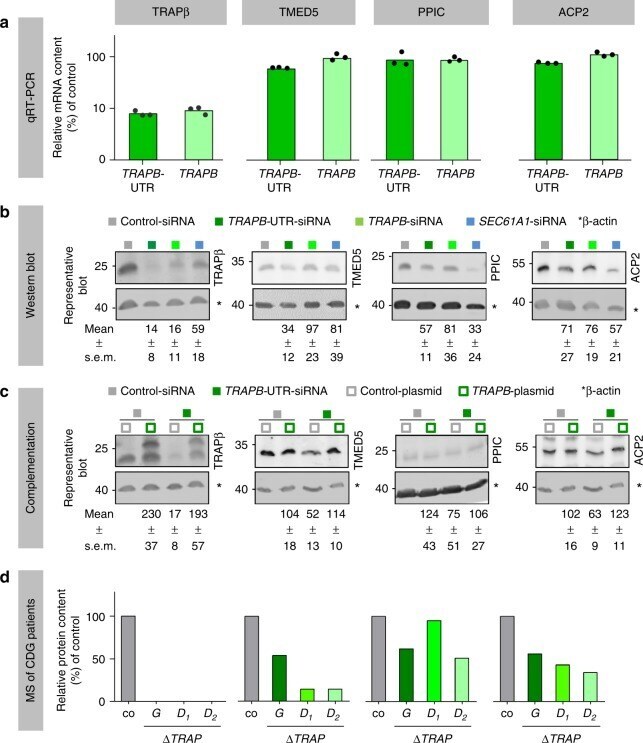
- Fig. 3 Validation of TRAP clients by western blot and quantitative RT-PCR. The color coding follows Fig. 1 . a - c HeLa cells were depleted of TRAP- or Sec61-complex using two different TRAPB -targeting siRNAs, or SEC61A1- UTR-targeting siRNA, or treated with a non-targeting (control) siRNA, and the consequences of complex depletion were analyzed by quantitative RT-PCR and western blots for TRAPbeta and TRAP client candidates. a Quantitative RT-PCR data represent the mean mRNA values relative to control and the corresponding dot plots for nine replicates for each siRNA from three independent experiments. b , c Quantitative western blot data represent the mean protein levels (normalized to ss-actin) relative to control and standard errors of the mean (s.e.m.) for five to six ( b ) or three ( c ) independent experiments. c Silencing phenotypes were rescued by the indicated complementation and analyzed by western blot. In the case of TRAPbeta, the upper band represents the tagged protein and the numbers refer to the sum of tagged and un-tagged protein. d Control fibroblasts (co) as well as TRAP-deficient fibroblasts from CDG patients with mutations in TRAPG ( G , one patient) or TRAPD ( D , two patients) genes 27 were analyzed by quantitative proteomics