Explore
 Validate
 Learn
Learn Western blot
 ELISA
ELISAAntibody data
- Antibody Data
- Antigen structure
- References [0]
- Comments [0]
- Validations
- Western blot [4]
- Immunocytochemistry [2]
- Immunohistochemistry [2]
- Flow cytometry [1]
- Other assay [2]
Submit
Validation data
Reference
Comment
Report error
- Product number
- 71-7100 - Provider product page

- Provider
- Invitrogen Antibodies
- Product name
- Pan-cadherin Polyclonal Antibody
- Antibody type
- Polyclonal
- Antigen
- Synthetic peptide
- Description
- This peptide antibody is broadly cross-reactive with all members of the cadherin family of proteins including N-cadherin, E-cadherin, P-cadherin, and R-cadherin. The antibody also displays broad species cross-reactivity including human, bovine, mouse, rat, chicken, amphibian, as well as other species. Rabbit anti-pan-Cadherin is useful as both a ubiquitous cadherin probe as well as a marker for adherens junctions. 71-7100 was used successfully in the immunofluorescence analysis of pan cadherin in MDCK cells.
- Reactivity
- Human, Mouse, Rat, Canine, Chicken/Avian, Xenopus
- Host
- Rabbit
- Isotype
- IgG
- Vial size
- 100 µg
- Concentration
- 0.25 mg/mL
- Storage
- -20°C
No comments: Submit comment
Supportive validation
- Submitted by
- Invitrogen Antibodies (provider)
- Main image
- Experimental details
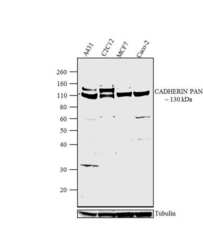
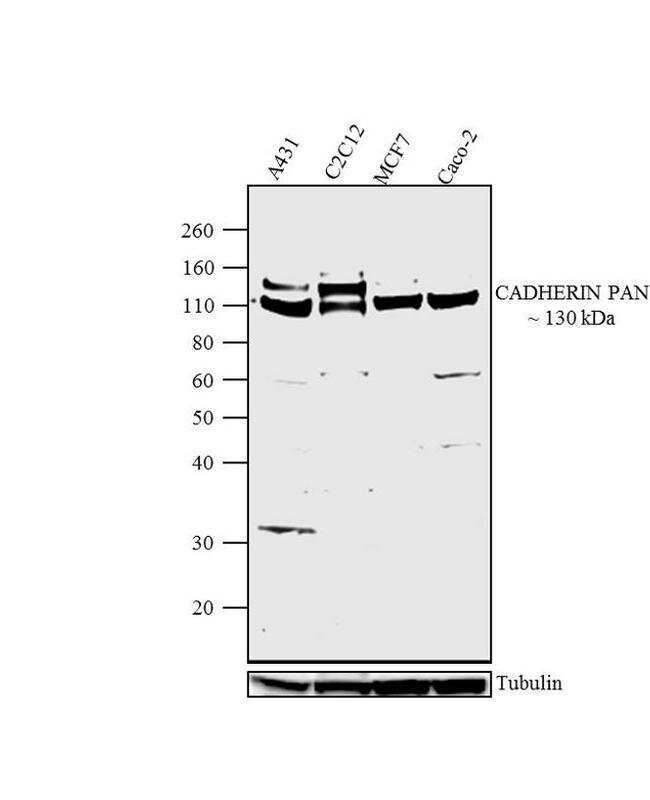
- Western blot analysis was performed on membrane enriched extracts (30 µg lysate) of A431 (Lane 1), C2C12 (Lane 2), MCF 7 (Lane 3) and Caco2 (Lane 4). The blots were probed with Anti-CADHERIN PAN Rabbit Polyclonal Antibody (Product # 71-7100, 1-2 µg/mL) and detected by chemiluminescence using Goat anti-Rabbit IgG (H+L) Secondary Antibody, HRP conjugate (Product # G-21234, 1:5000 dilution). A ~ 130 kDa band corresponding to CADHERIN PAN was observed across cell lines tested. Known quantity of protein samples were electrophoresed using Novex® NuPAGE® 10 % Bis-Tris gel (Product # NP0302BOX), XCell SureLock™ Electrophoresis System (Product # EI0002) and Novex® Sharp Pre-Stained Protein Standard (Product # LC5800). Resolved proteins were then transferred onto a nitrocellulose membrane with Pierce™ Power Blotter System (Product # 22834). The membrane was probed with the relevant primary and secondary Antibody following blocking with 5 % skimmed milk. Chemiluminescent detection was performed using Pierce™ ECL Western Blotting Substrate (Product # 32106).
- Submitted by
- Invitrogen Antibodies (provider)
- Main image

- Experimental details
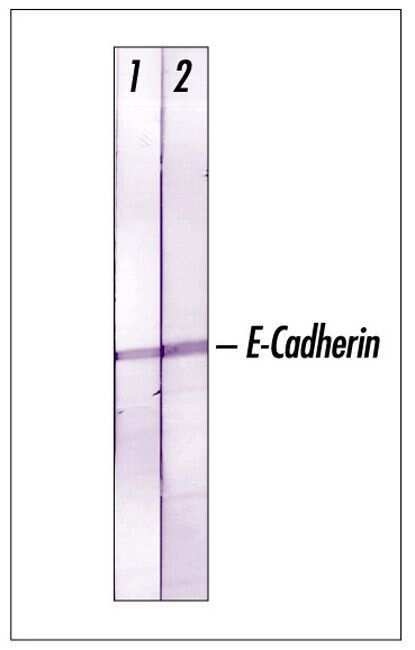
- Recognition of E-Cadherin in A431 cells by using Rabbit pan-Cadherin.
- Submitted by
- Invitrogen Antibodies (provider)
- Main image
- Experimental details
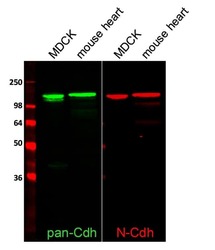
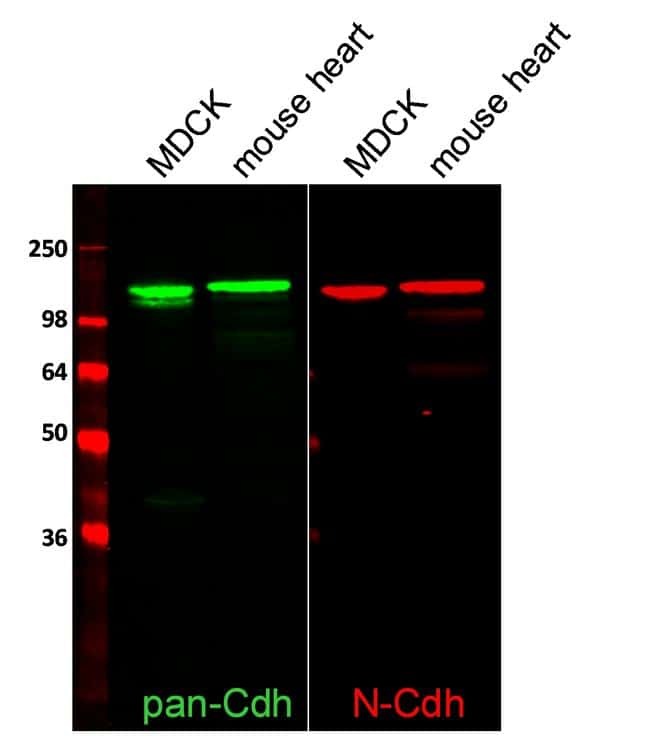
- Western blot analysis of total Cadherin and N-Cadherin was performed by loading 2 µL SeeBlue® Plus2 Prestained Protein Ladder (Product # LC5925), 50 µg of MDCK cell lysates and 10 µg mouse heart lysate per well onto a 4-20% Tris-HCl polyacrylamide gel. Proteins were transferred to a nitrocellulose membrane and blocked with 1% BSA/TBST for at least 1 hour at room temperature. Total cadherin was detected using a rabbit antibody (Product # 71-7100) and N-Cadherin was detected using a mouse antibody (Product # 33-3900), both at a concentration of 1 µg/mL in blocking buffer overnight at 4°C on a rocking platform. The blot was then incubated with goat anti-rabbit IgG-Alexa Fluor 790 secondary antibody (Product # A11369) and goat anti-mouse IgG-Alexa Fluor 680 secondary antibody (Product # A-21058) at a dilution of 1:10,000 for at least 1 hour. Fluorescent detection was performed using the Odyssey® CLx imaging system (Li-cor Biosciences). Images generated by Joell Solan in Paul Lampe Lab at Fred Hutchinson Cancer Research Center.
- Submitted by
- Invitrogen Antibodies (provider)
- Main image
- Experimental details
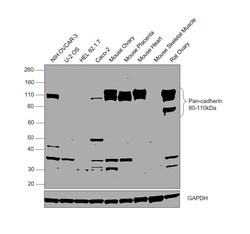
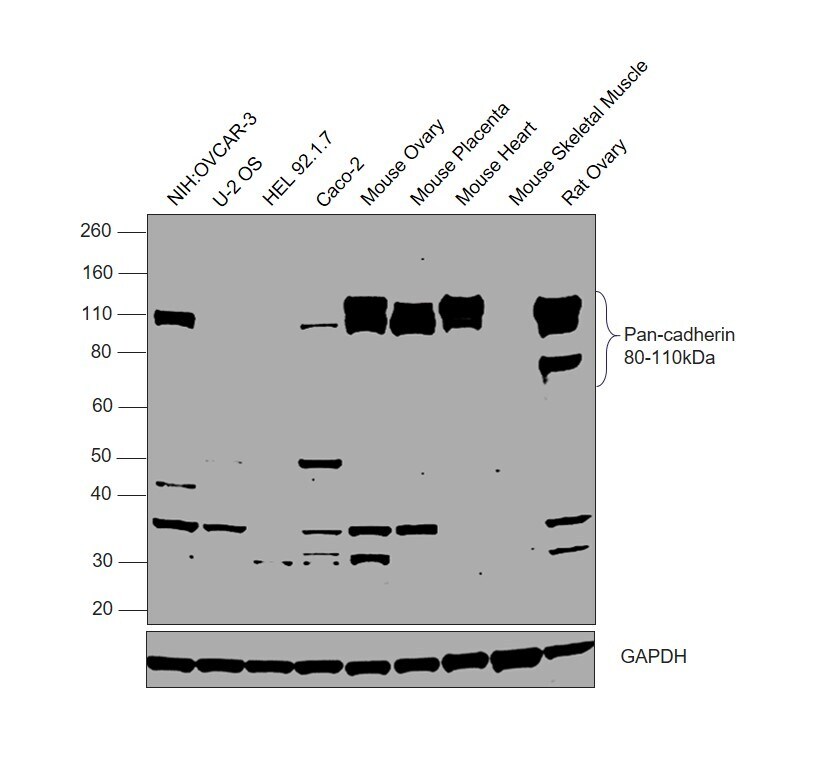
- Western Blot was performed using Anti-Pan-cadherin Polyclonal Antibody (Product # 71-7100) and a 80-110 kDa band corresponding to Cadherin-3 was observed across all the tested cell lines and tissues, except U-2 OS, HEL 92.1.7 and Mouse Skeletal Muscle. Whole cell extracts (30 µg lysate) of NIH:OVCAR-3 (Lane 1), U-2 OS (Lane 2), HEL 92.1.7 (Lane 3), Caco-2 (Lane 4), Mouse Ovary (Lane 5), Mouse Placenta (Lane 6), Mouse Heart (Lane 7), Mouse Skeletal Muscle (Lane 8), Rat Ovary (Lane 9) were electrophoresed using NuPAGE™ 4-12% Bis-Tris Protein Gel (Product # NP0322BOX). Resolved proteins were then transferred onto a nitrocellulose membrane (Product # IB23002) by iBlot® 2 Dry Blotting System (Product # IB21001). The blot was probed with the primary antibody (1 µg/mL) and detected by chemiluminescence with Goat anti-Rabbit IgG (H+L) Superclonal™ Recombinant Secondary Antibody, HRP (Product # A27036, 1/4000) using the iBright FL 1000 (Product # A32752). Chemiluminescent detection was performed using Novex® ECL Chemiluminescent Substrate Reagent Kit (Product # WP20005).
Supportive validation
- Submitted by
- Invitrogen Antibodies (provider)
- Main image
- Experimental details
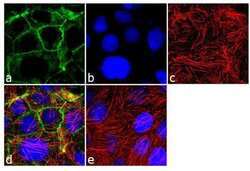
- Immunofluorescence analysis of Pan-Cadherin was performed using 90% confluent log phase Caco-2 cells. The cells were fixed with 4% paraformaldehyde for 10 minutes, permeabilized with 0.1% Triton™ X-100 for 10 minutes, and blocked with 2% BSA for 1 hour at room temperature. The cells were labeled with Cadherin pan Rabbit Polyclonal Antibody (Product # 71-7100) at 2 µg/mL in 0.1% BSA and incubated for 3 hours at room temperature and then labeled with Goat anti-Rabbit IgG (H+L) Superclonal™ Secondary Antibody, Alexa Fluor® 488 conjugate (Product # A27034) a dilution of 1:2000 for 45 minutes at room temperature (Panel a: green). Nuclei (Panel b: blue) were stained with SlowFade® Gold Antifade Mountant with DAPI (Product # S36938). F-actin (Panel c: red) was stained with Alexa Fluor® 555 Rhodamine Phalloidin (Product # R415, 1:300). Panel d represents the merged image showing cell junctional localization. Panel e shows the no primary antibody control. The images were captured at 60X magnification.
- Submitted by
- Invitrogen Antibodies (provider)
- Main image

- Experimental details
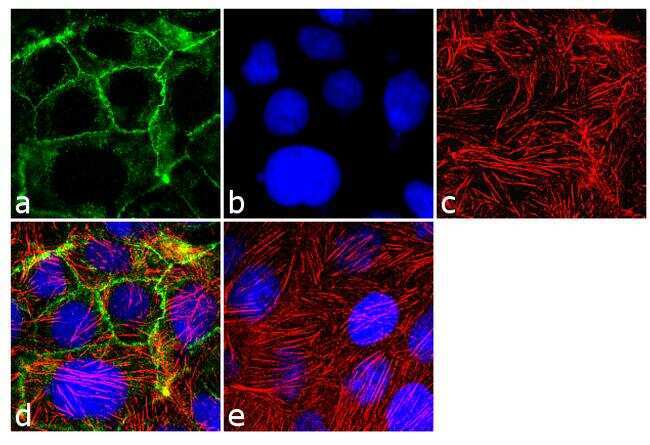
- Immunofluorescent detection of pan cadherin in MDCK cells. Confluent monolayers were fixed in 50%methanol/50%Acetone, blocked for at least 30 minutes in 1% BSA then incubated 2 hours with a pan cadherin antibody (Product # 71-7100) at 2.5 µg/mL, washed, then incubated 1 hour with Alexa Fluor 594 conjugated Donkey anti-Rabbit secondary antibody (Product # A-21207) at 1:2000 dilution. Cells were counterstained with DAPI (blue). Coverslips were mounted with Prolong Gold Antifade reagent (Product # P36930) and imaged at 40X. Images generated by Joell Solan in Paul Lampe Lab at the Fred Hutchinson cancer Research Center.
Supportive validation
- Submitted by
- Invitrogen Antibodies (provider)
- Main image
- Experimental details
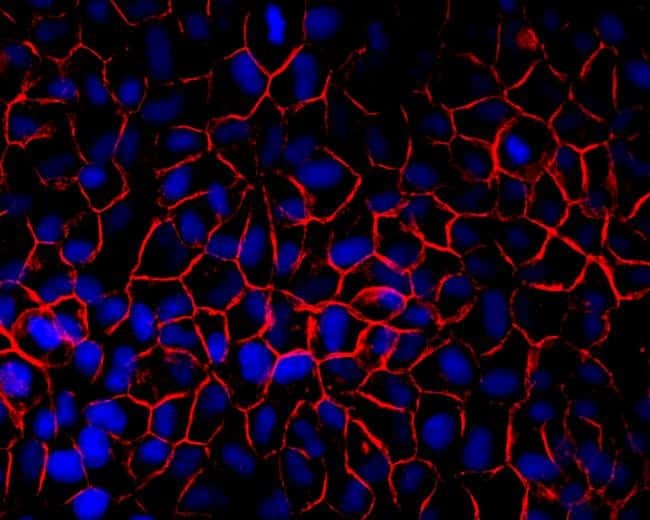
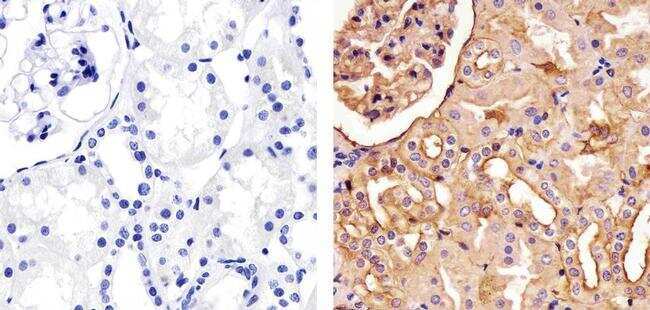
- Immunohistochemistry analysis of Cadherin pan showing staining in the membrane and also weakly in the cytoplasm of paraffin-embedded human kidney tissue (right) compared to a negative control without primary antibody (left). To expose target proteins, antigen retrieval was performed using 10mM sodium citrate (pH 6.0), microwaved for 8-15 min. Following antigen retrieval, tissues were blocked in 3% H2O2-methanol for 15 min at room temperature, washed with ddH2O and PBS, and then probed with a Anti- Cadherin pan Polyclonal Antibody (Product # 71-7100) diluted in 3% BSA-PBS at a dilution of 1:100 overnight at 4°C in a humidified chamber. Tissues were washed extensively in PBST and detection was performed using an HRP-conjugated secondary antibody followed by colorimetric detection using a DAB kit. Tissues were counterstained with hematoxylin and dehydrated with ethanol and xylene to prep for mounting.
- Submitted by
- Invitrogen Antibodies (provider)
- Main image
- Experimental details
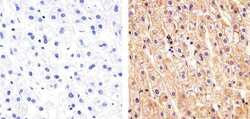
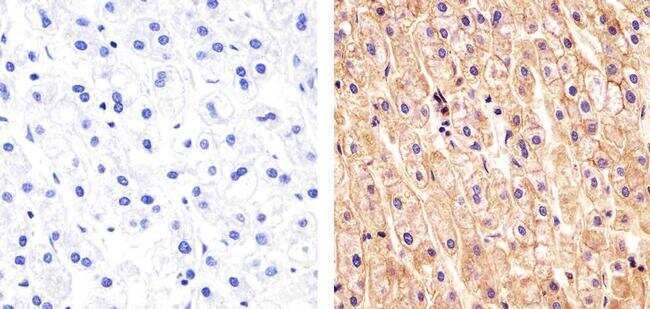
- Immunohistochemistry analysis of Cadherin pan showing staining in the membrane and also weakly in the cytoplasm of paraffin-embedded human liver tissue (right) compared to a negative control without primary antibody (left). To expose target proteins, antigen retrieval was performed using 10mM sodium citrate (pH 6.0), microwaved for 8-15 min. Following antigen retrieval, tissues were blocked in 3% H2O2-methanol for 15 min at room temperature, washed with ddH2O and PBS, and then probed with a Anti- Cadherin pan Polyclonal Antibody (Product # 71-7100) diluted in 3% BSA-PBS at a dilution of 1:100 overnight at 4°C in a humidified chamber. Tissues were washed extensively in PBST and detection was performed using an HRP-conjugated secondary antibody followed by colorimetric detection using a DAB kit. Tissues were counterstained with hematoxylin and dehydrated with ethanol and xylene to prep for mounting.
Supportive validation
- Submitted by
- Invitrogen Antibodies (provider)
- Main image
- Experimental details
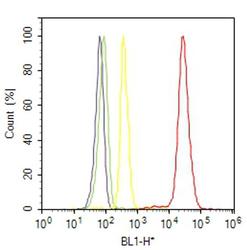
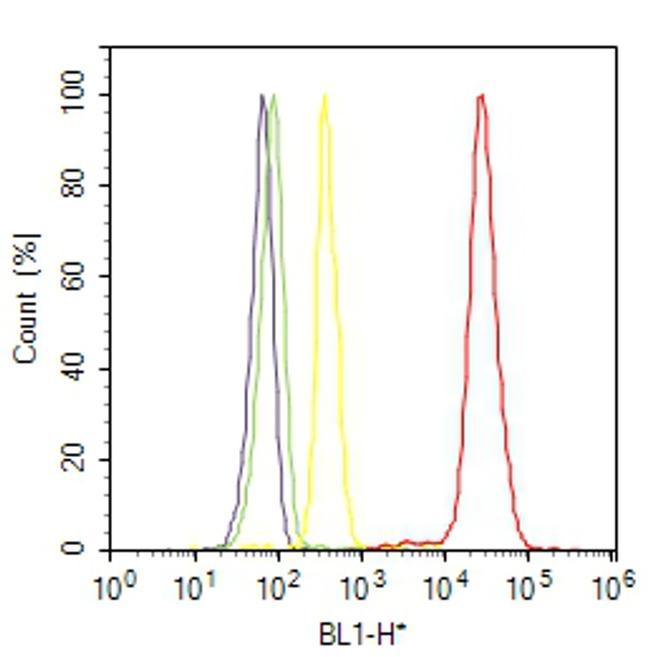
- Flow cytometry analysis of Cadherin pan was done on C2C12 cells. Cells were fixed with 70% ethanol for 10 minutes, permeabilized with 0.25% Triton™ X-100 for 20 minutes, and blocked with 5% BSA for 30 minutes at room temperature. Cells were labeled with Cadherin Rabbit Polyclonal Antibody (717100, red histogram) or with rabbit isotype control (yellow histogram) at 3-5 ug/million cells in 2.5% BSA. After incubation at room temperature for 2 hours, the cells were labeled with Alexa Fluor® 488 Goat Anti-Rabbit Secondary Antibody (A11008) at a dilution of 1:400 for 30 minutes at room temperature. The representative 10,000 cells were acquired and analyzed for each sample using an Attune® Acoustic Focusing Cytometer. The purple histogram represents unstained control cells and the green histogram represents no-primary-antibody control.
Supportive validation
- Submitted by
- Invitrogen Antibodies (provider)
- Main image

- Experimental details
- NULL
- Submitted by
- Invitrogen Antibodies (provider)
- Main image
- Experimental details
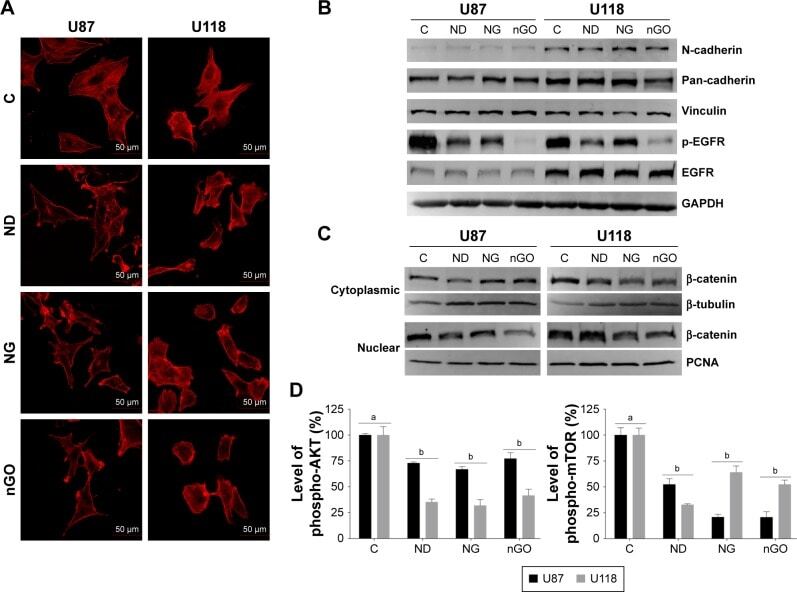
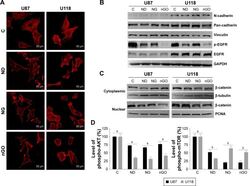
- Figure 5 EGFR/AKT/mTOR and beta-catenin signaling in glioblastoma cells after treated with nanoparticles. Notes: ( A ) Confocal microscope images of U87 and U118 cells actin cytoskeleton. Cells were grown on extracellular matrix for 24 h and treated with diamond nanoparticles, graphite nanoparticles, or graphene oxide nanoparticles at a concentration of 20 mug/mL and incubated for 24 h. F-Actin was stained with phalloidin conjugated with Atto 633. ( B ) Western blot analysis of N-cadherin, pan-cadherin, vinculin, p-EGFR, and EGFR. GAPDH was used as a loading control. ( C ) Western blot analysis of nuclear and cytoplasmic protein fractions used for determination of beta-catenin protein level. PCNA and beta-tubulin were used as loading controls for nuclear and cytoplasmic fractions, respectively. ( D ) ELISA analysis of AKT and mTOR phosphorylation in comparison to control. Treatment with nanoparticles significantly reduced phospho-AKT ( P