 Explore
 Validate
 Learn
Learn720206
antibody from Invitrogen Antibodies
Targeting: PRDM16
KIAA1675, KMT8F, MEL1, MGC166915, PFM13
 Western blot
 Other assay
Antibody data
- Antibody Data
- Antigen structure
- References [1]
- Comments [0]
- Validations
- Other assay [3]
Submit
Validation data
Reference
Comment
Report error
- Product number
- 720206 - Provider product page

- Provider
- Invitrogen Antibodies
- Product name
- PRDM16 Polyclonal Antibody
- Antibody type
- Polyclonal
- Antigen
- Synthetic peptide
- Description
- This antibody is predicted to react with Monkey, Mouse, Dog
- Reactivity
- Human, Mouse, Rat
- Host
- Rabbit
- Isotype
- IgG
- Vial size
- 100 μg
- Concentration
- 0.5 mg/mL
- Storage
- Store at 4°C short term. For long term storage, store at -20°C, avoiding freeze/thaw cycles.
Submitted references PRDM16 suppresses HIF-targeted gene expression in kidney cancer.
Kundu A, Nam H, Shelar S, Chandrashekar DS, Brinkley G, Karki S, Mitchell T, Livi CB, Buckhaults P, Kirkman R, Tang Y, Rowe GC, Wei S, Varambally S, Sudarshan S
The Journal of experimental medicine 2020 Jun 1;217(6)
The Journal of experimental medicine 2020 Jun 1;217(6)
No comments: Submit comment
Supportive validation
- Submitted by
- Invitrogen Antibodies (provider)
- Main image
- Experimental details
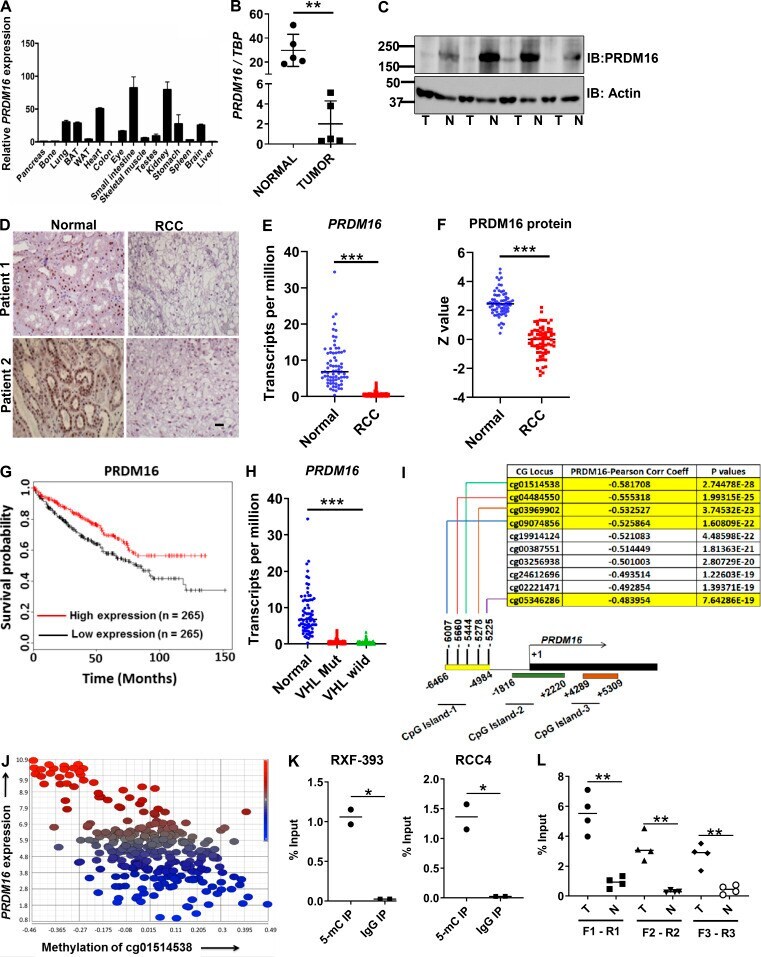
- Figure 1. PRDM16 expression is lost in RCC by promoter hypermethylation. (A) Relative PRDM16 mRNA expression was assayed in murine tissues via qPCR ( n = 3; BAT, brown adipose tissue; WAT, white adipose tissue). (B) Relative PRDM16 mRNA expression in patient-matched tumor/normal pair samples ( n = 5) normalized to TBP. Error bars in A and B indicate mean +- SD. (C) Immunoblot (IB) analysis of PRDM16 protein expression in patient-matched tumor (T)/normal (N) pair samples ( n = 4). (D) PRDM16 immunohistochemistry in RCC tumor and corresponding normal tissue (x400 magnification; scale bar in black, 20 um). (E) Analysis of PRDM16 mRNA expression in normal kidney and ccRCC using TCGA clear cell kidney cancer (KIRC) dataset. Horizontal bars represent median. Student''s t test, ***, P < 0.0001. (F) Analysis of PRDM16 protein levels in ccRCC and normal kidney using TCGA Clinical Proteomic Tumor Analysis Consortium (CPTAC). Data analyzed with the UALCAN analysis portal. Horizontal bars represents median. Student''s t test, ***, P < 0.0001. (G) Kaplan-Meier survival curve analysis of patients from the TCGA dataset on ccRCC based on expression of PRDM16 mRNA (P = 0.0032). (H) PRDM16 expression in normal kidney ( n = 72), VHL mutant RCC ( n = 217), and VHL WT RCC ( n = 205). Data extracted from TCGA KIRC dataset. One-way ANOVA, ***, P < 0.0001. (I) TCGA data on RCC was analyzed to identify the top CpG loci with the strongest negative correlation between methylation and PRDM16 expression.
- Submitted by
- Invitrogen Antibodies (provider)
- Main image
- Experimental details
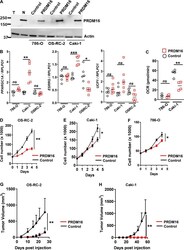
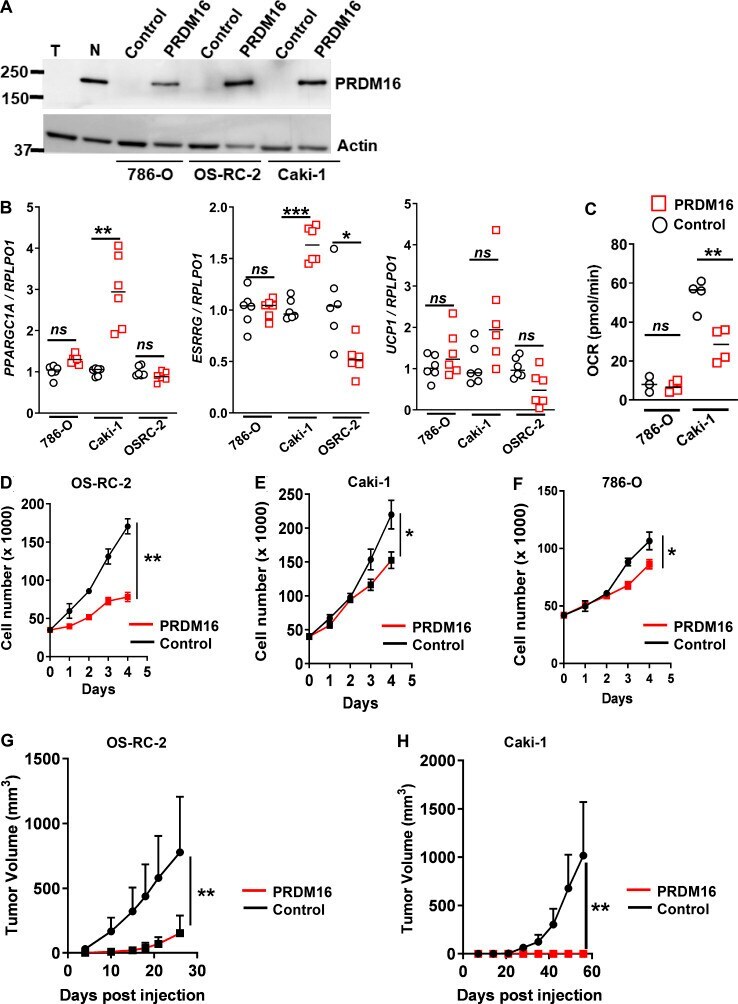
- Figure 2. Effect of PRDM16 on mitochondrial metabolism and tumor phenotypes in RCC cells. (A) PRDM16 immunoblot of samples from normal kidney, RCC primary tissue, and RCC cell lines (786-O, OS-RC-2, Caki-1) stably transduced with control vector or PRDM16. T, tumor; N, normal. (B) qPCR analysis of PPARGC1A , ESRRG , and UCP1 expression in RCC cells (786-O, Caki-1, OS-RC-2) containing either control vector or PRDM16. (C) Oxygen consumption rate analysis of RCC cells (786-O, Caki-1) stably transduced with control vector or PRDM16. (D-F) Proliferation of PRDM16 transduced RCC cells (OS-RC-2, Caki-1, 786-O) relative to control vector ( n = 3 per experimental group). For B and C, horizontal bars represent median. (G and H) In vivo xenograft experiment comparing tumor growth in RCC cells (OS-RC-2, n = 7 per group; Caki-1, n = 6 per group) plus or minus PRDM16 reconstitution. A-C are representative of two independent experiments. D-F are representative of minimum three independent experiments. For D-H, data are mean +- SD. Student''s t test, *, P < 0.05, **, P < 0.005, and ***, P < 0.0001; ns, not significant.
- Submitted by
- Invitrogen Antibodies (provider)
- Main image
- Experimental details
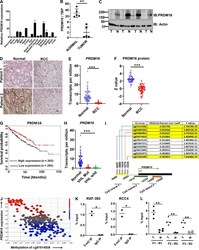
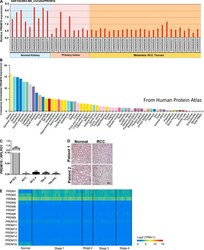
- Figure S1. PRDM16 expression in RCC . (A ) Relative PRDM16 expression in normal kidney ( n = 9), primary RCC ( n = 9), and metastatic RCC tissues ( n = 26) using the NCBI GEO2R analysis tool. Data are log2 transformed. (B) Consensus tissue expression of PRDM16 from three transcriptomic datasets (Human Protein Atlas RNaseq data, GTEx, and CAGE data from the FANTOM5 project; https://www.proteinatlas.org/ENSG00000142611-PRDM16/tissue ). (C) qPCR analysis of PRDM16 transcripts ( n = 3) from different RCC cell lines and from untransformed kidney cell line (RPTEC). RPLPO1 was used as the reference gene. Data are relative with RPTEC expression normalized to 1. Data are mean +- SD; Student''s t test, **, P < 0.005. (D) PRDM16 immunohistochemistry demonstrating nuclear staining in normal kidney with absence of staining in tumor tissue in matched normal/tumor patient samples (x400 magnification; scale bar in black, 20 um). (E) Expression of PRDM family proteins in TCGA KIRC datasets using UALCAN web browser. C is a representative of two independent experiments.
