Explore
 Validate
 Learn
Learn Western blot
Antibody data
- Antibody Data
- Antigen structure
- References [0]
- Comments [0]
- Validations
- Western blot [1]
- Immunocytochemistry [8]
- Immunohistochemistry [2]
- Flow cytometry [4]
- Other assay [1]
Submit
Validation data
Reference
Comment
Report error
- Product number
- MA5-11723 - Provider product page

- Provider
- Invitrogen Antibodies
- Product name
- HLA-ABC Monoclonal Antibody (W6/32)
- Antibody type
- Monoclonal
- Antigen
- Other
- Description
- MA5-11723 targets MHC I (HLA-A B C) in IHC (F), ICC/IF, WB and FACS applications and shows reactivity with Human and Mouse samples. The MA5-11723 immunogen is cell membranes of human tonsil lymphocytes.
- Reactivity
- Human, Mouse
- Host
- Mouse
- Isotype
- IgG
- Antibody clone number
- W6/32
- Vial size
- 200 μL
- Concentration
- 0.5 mg/mL
- Storage
- 4°C
No comments: Submit comment
Supportive validation
- Submitted by
- Invitrogen Antibodies (provider)
- Main image
- Experimental details
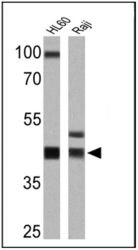
- Western blot analysis of MHC I (HLA-A B C) was performed by loading 25 µg of HL60 (lane 1) and Raji (lane 2) cell lysates onto an SDS polyacrylamide gel. Proteins were transferred to a PVDF membrane and blocked at 4ºC overnight. The membrane was probed with a MHC I (HLA-A B C) monoclonal antibody (Product # MA5-11723) at a dilution of 1:100 overnight at 4°C, washed in TBST, and probed with an HRP-conjugated secondary antibody for 1 hr at room temperature in the dark. Chemiluminescent detection was performed using Pierce ECL Plus Western Blotting Substrate (Product # 32132). Results show a band at ~41 kDa.

Supportive validation
- Submitted by
- Invitrogen Antibodies (provider)
- Main image

- Experimental details
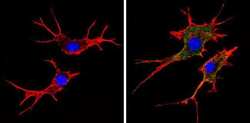
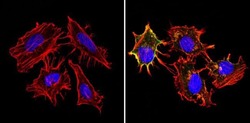
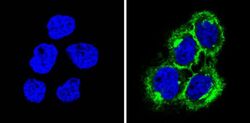
- Immunofluorescent analysis of MHC I (HLA-A B C) (green) showing staining in the cytoplasm and membrane of A431 cells (right) compared to a negative control without primary antibody (left). Formalin-fixed cells were permeabilized with 0.1% Triton X-100 in TBS for 5-10 minutes and blocked with 3% BSA-PBS for 30 minutes at room temperature. Cells were probed with a MHC I (HLA-A B C) monoclonal antibody (Product # MA5-11723) in 3% BSA-PBS at a dilution of 1:50 and incubated overnight at 4 ºC in a humidified chamber. Cells were washed with PBST and incubated with a DyLight-conjugated secondary antibody in PBS at room temperature in the dark. F-actin (red) was stained with a fluorescent red phalloidin and nuclei (blue) were stained with Hoechst or DAPI. Images were taken at a magnification of 60x.

- Submitted by
- Invitrogen Antibodies (provider)
- Main image

- Experimental details
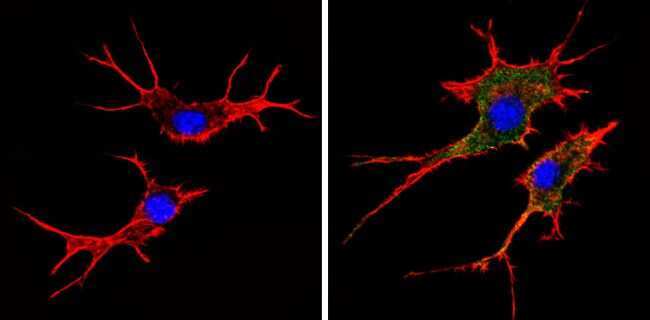
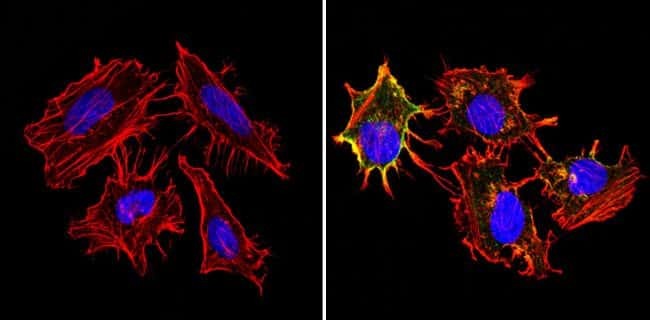
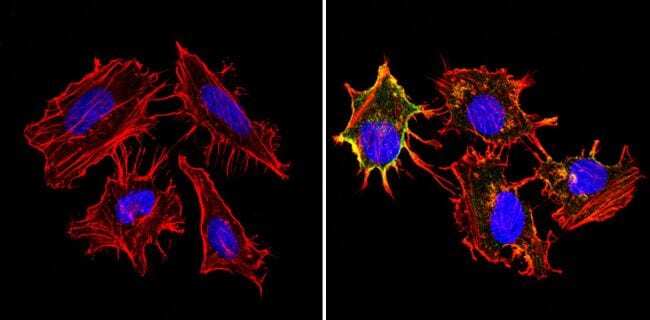
- Immunofluorescent analysis of MHC I (HLA-A B C) (green) showing staining in the cytoplasm and membrane of Hela cells (right) compared to a negative control without primary antibody (left). Formalin-fixed cells were permeabilized with 0.1% Triton X-100 in TBS for 5-10 minutes and blocked with 3% BSA-PBS for 30 minutes at room temperature. Cells were probed with a MHC I (HLA-A B C) monoclonal antibody (Product # MA5-11723) in 3% BSA-PBS at a dilution of 1:100 and incubated overnight at 4 ºC in a humidified chamber. Cells were washed with PBST and incubated with a DyLight-conjugated secondary antibody in PBS at room temperature in the dark. F-actin (red) was stained with a fluorescent red phalloidin and nuclei (blue) were stained with Hoechst or DAPI. Images were taken at a magnification of 60x.

- Submitted by
- Invitrogen Antibodies (provider)
- Main image
- Experimental details
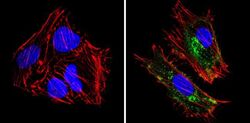
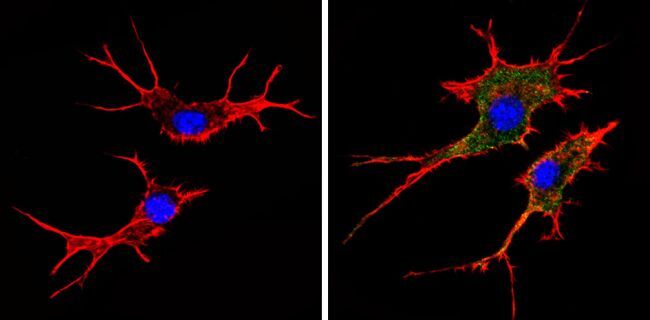
- Immunofluorescent analysis of MHC I (HLA-A B C) (green) showing staining in the cytoplasm and membrane of NIH-3T3 cells (right) compared to a negative control without primary antibody (left). Formalin-fixed cells were permeabilized with 0.1% Triton X-100 in TBS for 5-10 minutes and blocked with 3% BSA-PBS for 30 minutes at room temperature. Cells were probed with a MHC I (HLA-A B C) monoclonal antibody (Product # MA5-11723) in 3% BSA-PBS at a dilution of 1:50 and incubated overnight at 4 ºC in a humidified chamber. Cells were washed with PBST and incubated with a DyLight-conjugated secondary antibody in PBS at room temperature in the dark. F-actin (red) was stained with a fluorescent red phalloidin and nuclei (blue) were stained with Hoechst or DAPI. Images were taken at a magnification of 60x.
- Submitted by
- Invitrogen Antibodies (provider)
- Main image
- Experimental details
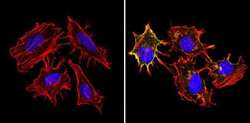
- Immunofluorescent analysis of MHC I HLA-A B C (green) showing staining in the cytoplasm and membrane of non-permeabilized Hela cells (right) compared to a negative control without primary antibody (left). Formalin-fixed cells were permeabilized with 0.1% Triton X-100 in TBS for 5-10 minutes and blocked with 3% BSA-PBS for 30 minutes at room temperature. Cells were probed with an MHC I (HLA-A B C) monoclonal antibody (Product # MA5-11723) in 3% BSA-PBS at a dilution of 1:50 and incubated overnight at 4ºC in a humidified chamber. Cells were washed with PBST and incubated with a DyLight-conjugated secondary antibody in PBS at room temperature in the dark. F-actin (red) was stained with a fluorescent red phalloidin and nuclei (blue) were stained with Hoechst or DAPI. Images were taken at a magnification of 60x.
- Submitted by
- Invitrogen Antibodies (provider)
- Main image
- Experimental details
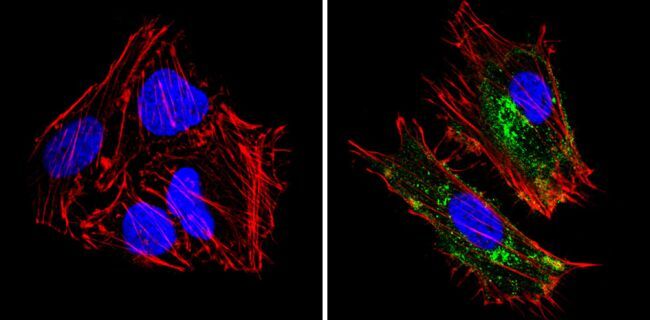
- Immunofluorescent analysis of MHC I (HLA-A B C) (green) showing staining in the cytoplasm and membrane of Hela cells (right) compared to a negative control without primary antibody (left). Formalin-fixed cells were permeabilized with 0.1% Triton X-100 in TBS for 5-10 minutes and blocked with 3% BSA-PBS for 30 minutes at room temperature. Cells were probed with a MHC I (HLA-A B C) monoclonal antibody (Product # MA5-11723) in 3% BSA-PBS at a dilution of 1:100 and incubated overnight at 4 ºC in a humidified chamber. Cells were washed with PBST and incubated with a DyLight-conjugated secondary antibody in PBS at room temperature in the dark. F-actin (red) was stained with a fluorescent red phalloidin and nuclei (blue) were stained with Hoechst or DAPI. Images were taken at a magnification of 60x.
- Submitted by
- Invitrogen Antibodies (provider)
- Main image
- Experimental details
- Immunofluorescent analysis of MHC I (HLA-A B C) (green) showing staining in the cytoplasm and membrane of A431 cells (right) compared to a negative control without primary antibody (left). Formalin-fixed cells were permeabilized with 0.1% Triton X-100 in TBS for 5-10 minutes and blocked with 3% BSA-PBS for 30 minutes at room temperature. Cells were probed with a MHC I (HLA-A B C) monoclonal antibody (Product # MA5-11723) in 3% BSA-PBS at a dilution of 1:50 and incubated overnight at 4 ºC in a humidified chamber. Cells were washed with PBST and incubated with a DyLight-conjugated secondary antibody in PBS at room temperature in the dark. F-actin (red) was stained with a fluorescent red phalloidin and nuclei (blue) were stained with Hoechst or DAPI. Images were taken at a magnification of 60x.

- Submitted by
- Invitrogen Antibodies (provider)
- Main image

- Experimental details
- Immunofluorescent analysis of MHC I (HLA-A B C) (green) showing staining in the cytoplasm and membrane of NIH-3T3 cells (right) compared to a negative control without primary antibody (left). Formalin-fixed cells were permeabilized with 0.1% Triton X-100 in TBS for 5-10 minutes and blocked with 3% BSA-PBS for 30 minutes at room temperature. Cells were probed with a MHC I (HLA-A B C) monoclonal antibody (Product # MA5-11723) in 3% BSA-PBS at a dilution of 1:50 and incubated overnight at 4 ºC in a humidified chamber. Cells were washed with PBST and incubated with a DyLight-conjugated secondary antibody in PBS at room temperature in the dark. F-actin (red) was stained with a fluorescent red phalloidin and nuclei (blue) were stained with Hoechst or DAPI. Images were taken at a magnification of 60x.
- Submitted by
- Invitrogen Antibodies (provider)
- Main image
- Experimental details
- Immunofluorescent analysis of MHC I HLA-A B C (green) showing staining in the cytoplasm and membrane of non-permeabilized Hela cells (right) compared to a negative control without primary antibody (left). Formalin-fixed cells were permeabilized with 0.1% Triton X-100 in TBS for 5-10 minutes and blocked with 3% BSA-PBS for 30 minutes at room temperature. Cells were probed with an MHC I (HLA-A B C) monoclonal antibody (Product # MA5-11723) in 3% BSA-PBS at a dilution of 1:50 and incubated overnight at 4ºC in a humidified chamber. Cells were washed with PBST and incubated with a DyLight-conjugated secondary antibody in PBS at room temperature in the dark. F-actin (red) was stained with a fluorescent red phalloidin and nuclei (blue) were stained with Hoechst or DAPI. Images were taken at a magnification of 60x.
Supportive validation
- Submitted by
- Invitrogen Antibodies (provider)
- Main image
- Experimental details
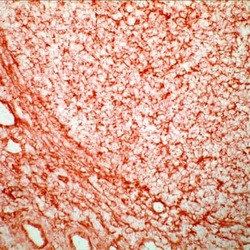
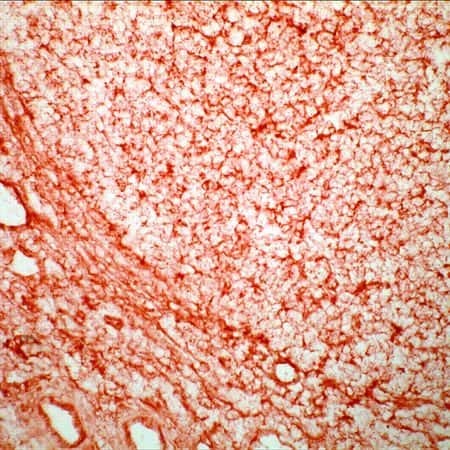
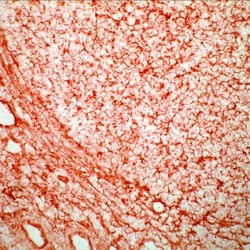
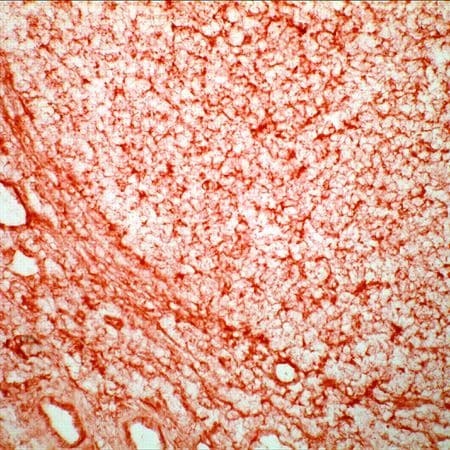
- Frozen human tonsil section stained with MHC-I antibody using UltraVision LP and AEC chromogen. Note membrane staining.
- Submitted by
- Invitrogen Antibodies (provider)
- Main image
- Experimental details
- Frozen human tonsil section stained with MHC-I antibody using UltraVision LP and AEC chromogen. Note membrane staining.
Supportive validation
- Submitted by
- Invitrogen Antibodies (provider)
- Main image
- Experimental details
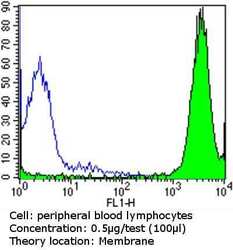
- Flow cytometry analysis of MHC I in peripheral blood mononuclear cells compared to an isotype control (blue). Human blood was collected, combined with a hydrophilic polysaccharide, centrifuged, transferred to a conical tube and washed with PBS. 50 µL of cell solution was added to each tube at a dilution of 2x10^7 cells/mL, followed by the addition of 50 µL of isotype control and primary antibody (Product # MA5-11723) at a dilution of 0.5 µg/test. Cells were incubated for 30 min at 4ºC and washed with a cell buffer, followed by incubation with a DyLight 488-conjugated goat anti-mouse IgG (H+L) secondary for 30 min at 4ºC in the dark. FACS analysis was performed using 400 µL of cell buffer.

- Submitted by
- Invitrogen Antibodies (provider)
- Main image
- Experimental details
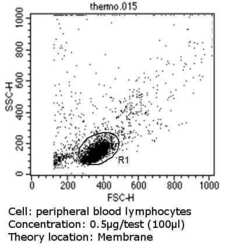
- Flow cytometry analysis of MHC I in peripheral blood mononuclear cells compared to an isotype control (blue). Human blood was collected, combined with a hydrophilic polysaccharide, centrifuged, transferred to a conical tube and washed with PBS. 50 µL of cell solution was added to each tube at a dilution of 2x10^7 cells/mL, followed by the addition of 50 µL of isotype control and primary antibody (Product # MA5-11723) at a dilution of 0.5 µg/test. Cells were incubated for 30 min at 4ºC and washed with a cell buffer, followed by incubation with a DyLight 488-conjugated goat anti-mouse IgG (H+L) secondary for 30 min at 4ºC in the dark. FACS analysis was performed using 400 µL of cell buffer.
- Submitted by
- Invitrogen Antibodies (provider)
- Main image

- Experimental details
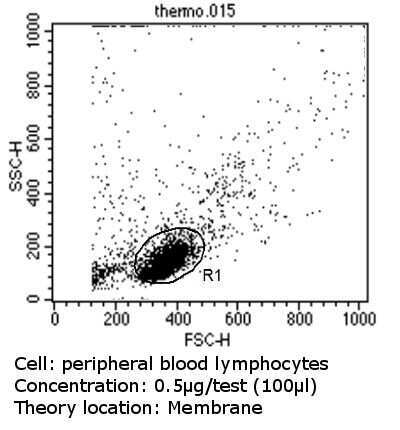
- Flow cytometry analysis of MHC I in peripheral blood mononuclear cells compared to an isotype control (blue). Human blood was collected, combined with a hydrophilic polysaccharide, centrifuged, transferred to a conical tube and washed with PBS. 50 µL of cell solution was added to each tube at a dilution of 2x10^7 cells/mL, followed by the addition of 50 µL of isotype control and primary antibody (Product # MA5-11723) at a dilution of 0.5 µg/test. Cells were incubated for 30 min at 4ºC and washed with a cell buffer, followed by incubation with a DyLight 488-conjugated goat anti-mouse IgG (H+L) secondary for 30 min at 4ºC in the dark. FACS analysis was performed using 400 µL of cell buffer.
- Submitted by
- Invitrogen Antibodies (provider)
- Main image

- Experimental details
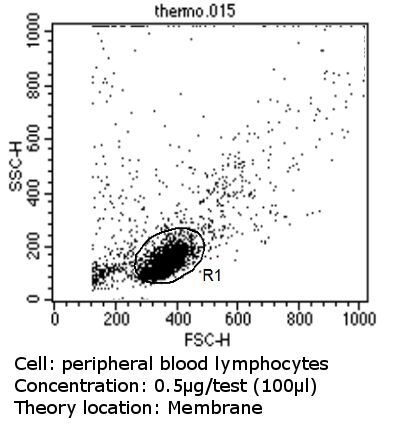
- Flow cytometry analysis of MHC I in peripheral blood mononuclear cells compared to an isotype control (blue). Human blood was collected, combined with a hydrophilic polysaccharide, centrifuged, transferred to a conical tube and washed with PBS. 50 µL of cell solution was added to each tube at a dilution of 2x10^7 cells/mL, followed by the addition of 50 µL of isotype control and primary antibody (Product # MA5-11723) at a dilution of 0.5 µg/test. Cells were incubated for 30 min at 4ºC and washed with a cell buffer, followed by incubation with a DyLight 488-conjugated goat anti-mouse IgG (H+L) secondary for 30 min at 4ºC in the dark. FACS analysis was performed using 400 µL of cell buffer.

Supportive validation
- Submitted by
- Invitrogen Antibodies (provider)
- Main image

- Experimental details
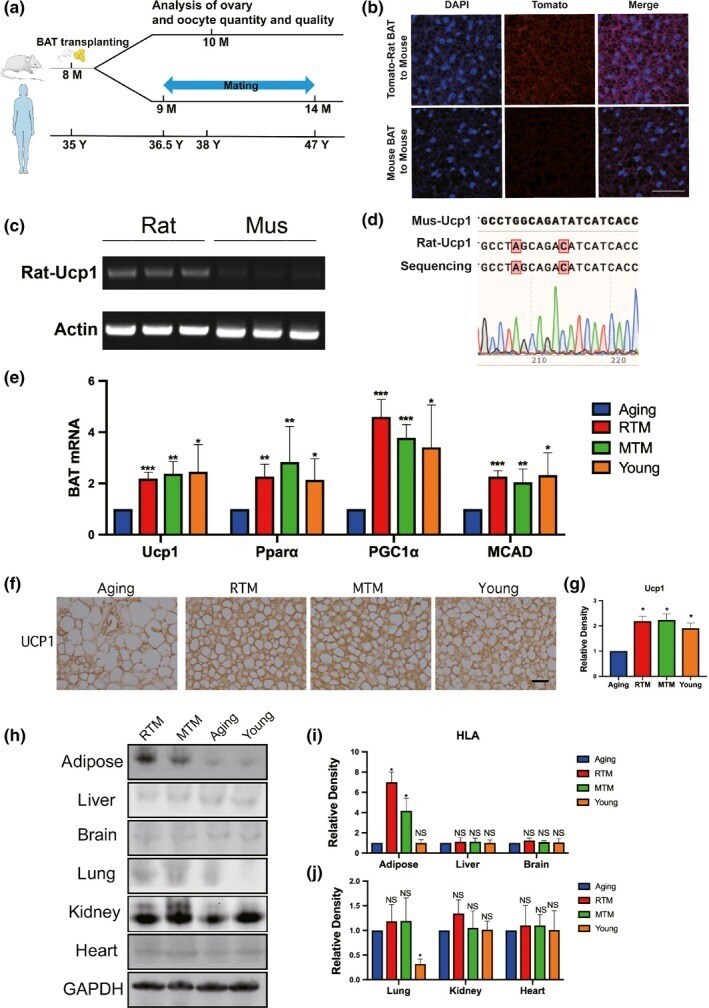
- Figure 1 Rat-to-mouse (RTM) xenotransplanted brown adipose tissue (BAT) was functional well and did not cause injurious histocompatibility in aging mice. (a) Scheme of experimental design. Eight-month-old aging mice were divided into four groups, RTM and MTM groups received brown adipose tissue (BAT) from 1-month-old rats or mice, then recovered for 1 month. Aging mice accepted a pseudo operation (cut and stitch up without BAT transplantation). At 9 months old, mating assays started, five mice for each group. At about 10 months old, when the first litter is delivered, more mice were used for all other experiments. The age line of human corresponds to age in mice. (b-d) Verification of xenotransplanted rat BAT 3 weeks after xenotransplantation. (b) BAT paraffin sections were stained with DAPI (blue) and fluorescence image showed that tomato fluorescence (red) was very remarkable in the RTM group while very low in the MTM group. (c) RT-PCR with rat-specific UCP1 primers detects a bright band with expected size from all three RTM mice, while no observable bands from three MTM mice. (d) The bright band from (c) was identified to be rat UCP1 by Sanger sequencing. (e) qPCR showed that the mRNA levels of four BAT marker genes, UCP1, PPARalpha, PGC-1alpha, and MCAD, were significantly rescued close to the young group. (f) UCP1 immunohistochemistry in BAT paraffin section showed that UCP-1 level in RTM and MTM group, and young group were significantly higher than in the aging group. (