Explore
 Validate
 Learn
Learn Western blot
 Immunocytochemistry
 Flow cytometry
Antibody data
- Antibody Data
- Antigen structure
- References [31]
- Comments [0]
- Validations
- Immunocytochemistry [2]
- Immunohistochemistry [3]
- Other assay [27]
Submit
Validation data
Reference
Comment
Report error
- Product number
- 14-1079-37 - Provider product page

- Provider
- Invitrogen Antibodies
- Product name
- CD107a (LAMP-1) Monoclonal Antibody (eBioH4A3), eBioscience™
- Antibody type
- Monoclonal
- Antigen
- Other
- Description
- Description: The eBioH4A3 monoclonal antibody reacts with human CD107a, also known as lysosomal-associated membrane protein-1 (LAMP-1). CD107a is a highly glycosylated protein of approximately 110kDa. It is predominantly expressed intracellularly in the lysosomal/endosomal membrane in nearly all cells. CD107a is transiently expressed on the cell surface of degranulating cytolytic T cells, and is also upregulated on the surface of activated platelets and some cancer cells. Applications Reported: Purified anti-human CD107a (LAMP-1) has been reported for use in flow cytometric analysis, immunohistochemistry, immunocytochemistry, and immunoblotting. It has also been reported for use in surface staining in a flow cytometric based degranulation assay. (Fluorochrome conjugated eBioH4B4 (H4B4) is recommended for use in flow cytometry.). Applications Tested: This eBioH4A3 antibody has been tested by intracellular staining and flow cytometric analysis, immunocytochemistry of methanol-fixed cells, immunohistochemistry of formalin-fixed paraffin embedded human tissue using high or low pH antigen retrieval, or western blotting. For flow cytometry this can be used at less than or equal to 0.5 µg per test. A test is defined as the amount (µg) of antibody that will stain a cell sample in a final volume of 100 µL. Cell number should be determined empirically but can range from 10^5 to 10^8 cells/test. For both immunocytochemistry and immunohistochemistry, this can be used at less than or equal to 5 µg/mL. It is recommended that the antibody be carefully titrated for optimal performance in the assay of interest. Purity: Greater than 90%, as determined by SDS-PAGE. Aggregation: Less than 10%, as determined by HPLC. Filtration: 0.2 µm post-manufacturing filtered.
- Reactivity
- Human
- Host
- Mouse
- Isotype
- IgG
- Antibody clone number
- eBioH4A3
- Vial size
- 2 mg
- Concentration
- 0.5 mg/mL
- Storage
- 4°C
Submitted references Passive Diffusion vs Active pH-Dependent Encapsulation of Tyrosine Kinase Inhibitors Vandetanib and Lenvatinib into Folate-Targeted Ferritin Delivery System.
Erlotinib Promotes Ligand-Induced EGFR Degradation in 3D but Not 2D Cultures of Pancreatic Ductal Adenocarcinoma Cells.
Exosomes in serum‑free cultures of THP‑1 macrophages infected with Mycobacterium tuberculosis.
Analysis of the intracellular traffic of IgG in the context of Down syndrome (trisomy 21).
Circulating prostate cancer cells have differential resistance to fluid shear stress-induced cell death.
Multiple Immunostainings with Different Epitope Retrievals-The FOLGAS Protocol.
Reducing FASN expression sensitizes acute myeloid leukemia cells to differentiation therapy.
Spatial and temporal VEGF receptor intracellular trafficking in microvascular and macrovascular endothelial cells.
Efficient Protein Transfection by Swarms of Chemically Powered Plasmonic Virus-Sized Nanorobots.
PBRM1 and the glycosylphosphatidylinositol biosynthetic pathway promote tumor killing mediated by MHC-unrestricted cytotoxic lymphocytes.
MAVS Genetic Variation Is Associated with Decreased HIV-1 Replication In Vitro and Reduced CD4(+) T Cell Infection in HIV-1-Infected Individuals.
HLA-B*27:05 alters immunodominance hierarchy of universal influenza-specific CD8+ T cells.
Complement receptor CD46 co-stimulates optimal human CD8(+) T cell effector function via fatty acid metabolism.
TCF1 expression marks self-renewing human CD8(+) T cells.
Human iPSC-Derived Natural Killer Cells Engineered with Chimeric Antigen Receptors Enhance Anti-tumor Activity.
PD1 is expressed on exhausted T cells as well as virus specific memory CD8+ T cells in the bone marrow of myeloma patients.
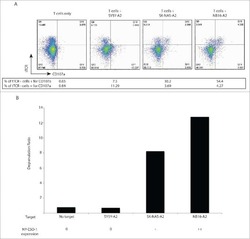
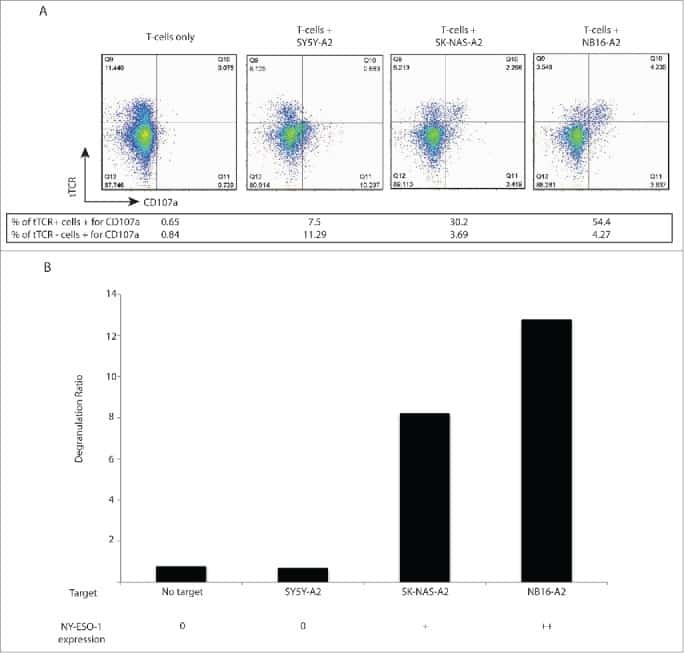
T cells targeting NY-ESO-1 demonstrate efficacy against disseminated neuroblastoma.
Laparoscopic Technique for Serial Collection of Para-Colonic, Left Colic, and Inferior Mesenteric Lymph Nodes in Macaques.
Targeting cancer metabolism by simultaneously disrupting parallel nutrient access pathways.
Functional dichotomy of Vδ2 γδ T cells in chronic hepatitis C virus infections: role in cytotoxicity but not for IFN-γ production.
Lysosomal membrane permeabilization is involved in oxidative stress-induced apoptotic cell death in LAMP2-deficient iPSCs-derived cerebral cortical neurons.
Cross-reactive multifunctional CD4+ T cell responses against Salmonella enterica serovars Typhi, Paratyphi A and Paratyphi B in humans following immunization with live oral typhoid vaccine Ty21a.
A TNFRSF14-FcɛRI-mast cell pathway contributes to development of multiple features of asthma pathology in mice.
Fucosylation of LAMP-1 and LAMP-2 by FUT1 correlates with lysosomal positioning and autophagic flux of breast cancer cells.
Munc18-2 is required for Syntaxin 11 Localization on the Plasma Membrane in Cytotoxic T-Lymphocytes.
Phase I trial of a multi-epitope-pulsed dendritic cell vaccine for patients with newly diagnosed glioblastoma.
Unexpected heterogeneity of multifunctional T cells in response to superantigen stimulation in humans.
Simian immunodeficiency virus-induced changes in T cell cytokine responses in cynomolgus macaques with latent Mycobacterium tuberculosis infection are associated with timing of reactivation.
Lysosomal localization and mechanism of membrane penetration influence nonenveloped virus activation of the NLRP3 inflammasome.
Differential effects of TBC1D15 and mammalian Vps39 on Rab7 activation state, lysosomal morphology, and growth factor dependence.
The small chemical vacuolin-1 alters the morphology of lysosomes without inhibiting Ca2+-regulated exocytosis.
Skubalova Z, Rex S, Sukupova M, Zahalka M, Skladal P, Pribyl J, Michalkova H, Weerasekera A, Adam V, Heger Z
International journal of nanomedicine 2021;16:1-14
International journal of nanomedicine 2021;16:1-14
Erlotinib Promotes Ligand-Induced EGFR Degradation in 3D but Not 2D Cultures of Pancreatic Ductal Adenocarcinoma Cells.
Betriu N, Andreeva A, Semino CE
Cancers 2021 Sep 7;13(18)
Cancers 2021 Sep 7;13(18)
Exosomes in serum‑free cultures of THP‑1 macrophages infected with Mycobacterium tuberculosis.
Biadglegne F, Rademacher P, De Sulbaran YGJ, König B, Rodloff AC, Zedler U, Dorhoi A, Sack U
Molecular medicine reports 2021 Nov;24(5)
Molecular medicine reports 2021 Nov;24(5)
Analysis of the intracellular traffic of IgG in the context of Down syndrome (trisomy 21).
Cejas RB, Tamaño-Blanco M, Blanco JG
Scientific reports 2021 May 26;11(1):10981
Scientific reports 2021 May 26;11(1):10981
Circulating prostate cancer cells have differential resistance to fluid shear stress-induced cell death.
Hope JM, Bersi MR, Dombroski JA, Clinch AB, Pereles RS, Merryman WD, King MR
Journal of cell science 2021 Feb 22;134(4)
Journal of cell science 2021 Feb 22;134(4)
Multiple Immunostainings with Different Epitope Retrievals-The FOLGAS Protocol.
von Schoenfeld A, Bronsert P, Poc M, Fuller A, Filby A, Kraft S, Kurowski K, Sörensen K, Huber J, Pfeiffer J, Proietti M, Stehl V, Werner M, Seidl M
International journal of molecular sciences 2021 Dec 25;23(1)
International journal of molecular sciences 2021 Dec 25;23(1)
Reducing FASN expression sensitizes acute myeloid leukemia cells to differentiation therapy.
Humbert M, Seiler K, Mosimann S, Rentsch V, Sharma K, Pandey AV, McKenna SL, Tschan MP
Cell death and differentiation 2021 Aug;28(8):2465-2481
Cell death and differentiation 2021 Aug;28(8):2465-2481
Spatial and temporal VEGF receptor intracellular trafficking in microvascular and macrovascular endothelial cells.
Silva JAF, Qi X, Grant MB, Boulton ME
Scientific reports 2021 Aug 30;11(1):17400
Scientific reports 2021 Aug 30;11(1):17400
Efficient Protein Transfection by Swarms of Chemically Powered Plasmonic Virus-Sized Nanorobots.
Ressnerova A, Novotny F, Michalkova H, Pumera M, Adam V, Heger Z
ACS nano 2021 Aug 24;15(8):12899-12910
ACS nano 2021 Aug 24;15(8):12899-12910
PBRM1 and the glycosylphosphatidylinositol biosynthetic pathway promote tumor killing mediated by MHC-unrestricted cytotoxic lymphocytes.
Menasche BL, Davis EM, Wang S, Ouyang Y, Li S, Yu H, Shen J
Science advances 2020 Nov;6(48)
Science advances 2020 Nov;6(48)
MAVS Genetic Variation Is Associated with Decreased HIV-1 Replication In Vitro and Reduced CD4(+) T Cell Infection in HIV-1-Infected Individuals.
Stunnenberg M, van Pul L, Sprokholt JK, van Dort KA, Gringhuis SI, Geijtenbeek TBH, Kootstra NA
Viruses 2020 Jul 16;12(7)
Viruses 2020 Jul 16;12(7)
HLA-B*27:05 alters immunodominance hierarchy of universal influenza-specific CD8+ T cells.
Sant S, Quiñones-Parra SM, Koutsakos M, Grant EJ, Loudovaris T, Mannering SI, Crowe J, van de Sandt CE, Rimmelzwaan GF, Rossjohn J, Gras S, Loh L, Nguyen THO, Kedzierska K
PLoS pathogens 2020 Aug;16(8):e1008714
PLoS pathogens 2020 Aug;16(8):e1008714
Complement receptor CD46 co-stimulates optimal human CD8(+) T cell effector function via fatty acid metabolism.
Arbore G, West EE, Rahman J, Le Friec G, Niyonzima N, Pirooznia M, Tunc I, Pavlidis P, Powell N, Li Y, Liu P, Servais A, Couzi L, Fremeaux-Bacchi V, Placais L, Ferraro A, Walsh PR, Kavanagh D, Afzali B, Lavender P, Lachmann HJ, Kemper C
Nature communications 2018 Oct 10;9(1):4186
Nature communications 2018 Oct 10;9(1):4186
TCF1 expression marks self-renewing human CD8(+) T cells.
Kratchmarov R, Magun AM, Reiner SL
Blood advances 2018 Jul 24;2(14):1685-1690
Blood advances 2018 Jul 24;2(14):1685-1690
Human iPSC-Derived Natural Killer Cells Engineered with Chimeric Antigen Receptors Enhance Anti-tumor Activity.
Li Y, Hermanson DL, Moriarity BS, Kaufman DS
Cell stem cell 2018 Aug 2;23(2):181-192.e5
Cell stem cell 2018 Aug 2;23(2):181-192.e5
PD1 is expressed on exhausted T cells as well as virus specific memory CD8+ T cells in the bone marrow of myeloma patients.
Sponaas AM, Yang R, Rustad EH, Standal T, Thoresen AS, Dao Vo C, Waage A, Slørdahl TS, Børset M, Sundan A
Oncotarget 2018 Aug 10;9(62):32024-32035
Oncotarget 2018 Aug 10;9(62):32024-32035
T cells targeting NY-ESO-1 demonstrate efficacy against disseminated neuroblastoma.
Singh N, Kulikovskaya I, Barrett DM, Binder-Scholl G, Jakobsen B, Martinez D, Pawel B, June CH, Kalos MD, Grupp SA
Oncoimmunology 2016;5(1):e1040216
Oncoimmunology 2016;5(1):e1040216
Laparoscopic Technique for Serial Collection of Para-Colonic, Left Colic, and Inferior Mesenteric Lymph Nodes in Macaques.
Smedley J, Macalister R, Wangari S, Gathuka M, Ahrens J, Iwayama N, May D, Bratt D, O'Connor M, Munson P, Koday M, Lifson J, Fuller DH
PloS one 2016;11(6):e0157535
PloS one 2016;11(6):e0157535
Targeting cancer metabolism by simultaneously disrupting parallel nutrient access pathways.
Kim SM, Roy SG, Chen B, Nguyen TM, McMonigle RJ, McCracken AN, Zhang Y, Kofuji S, Hou J, Selwan E, Finicle BT, Nguyen TT, Ravi A, Ramirez MU, Wiher T, Guenther GG, Kono M, Sasaki AT, Weisman LS, Potma EO, Tromberg BJ, Edwards RA, Hanessian S, Edinger AL
The Journal of clinical investigation 2016 Nov 1;126(11):4088-4102
The Journal of clinical investigation 2016 Nov 1;126(11):4088-4102
Functional dichotomy of Vδ2 γδ T cells in chronic hepatitis C virus infections: role in cytotoxicity but not for IFN-γ production.
Yin W, Tong S, Zhang Q, Shao J, Liu Q, Peng H, Hu H, Peng M, Hu P, Ren H, Tian Z, Zhang D
Scientific reports 2016 May 19;6:26296
Scientific reports 2016 May 19;6:26296
Lysosomal membrane permeabilization is involved in oxidative stress-induced apoptotic cell death in LAMP2-deficient iPSCs-derived cerebral cortical neurons.
Law CY, Siu CW, Fan K, Lai WH, Au KW, Lau YM, Wong LY, Ho JCY, Lee YK, Tse HF, Ng KM
Biochemistry and biophysics reports 2016 Mar;5:335-345
Biochemistry and biophysics reports 2016 Mar;5:335-345
Cross-reactive multifunctional CD4+ T cell responses against Salmonella enterica serovars Typhi, Paratyphi A and Paratyphi B in humans following immunization with live oral typhoid vaccine Ty21a.
Wahid R, Fresnay S, Levine MM, Sztein MB
Clinical immunology (Orlando, Fla.) 2016 Dec;173:87-95
Clinical immunology (Orlando, Fla.) 2016 Dec;173:87-95
A TNFRSF14-FcɛRI-mast cell pathway contributes to development of multiple features of asthma pathology in mice.
Sibilano R, Gaudenzio N, DeGorter MK, Reber LL, Hernandez JD, Starkl PM, Zurek OW, Tsai M, Zahner S, Montgomery SB, Roers A, Kronenberg M, Yu M, Galli SJ
Nature communications 2016 Dec 16;7:13696
Nature communications 2016 Dec 16;7:13696
Fucosylation of LAMP-1 and LAMP-2 by FUT1 correlates with lysosomal positioning and autophagic flux of breast cancer cells.
Tan KP, Ho MY, Cho HC, Yu J, Hung JT, Yu AL
Cell death & disease 2016 Aug 25;7(8):e2347
Cell death & disease 2016 Aug 25;7(8):e2347
Munc18-2 is required for Syntaxin 11 Localization on the Plasma Membrane in Cytotoxic T-Lymphocytes.
Dieckmann NM, Hackmann Y, Aricò M, Griffiths GM
Traffic (Copenhagen, Denmark) 2015 Dec;16(12):1330-41
Traffic (Copenhagen, Denmark) 2015 Dec;16(12):1330-41
Phase I trial of a multi-epitope-pulsed dendritic cell vaccine for patients with newly diagnosed glioblastoma.
Phuphanich S, Wheeler CJ, Rudnick JD, Mazer M, Wang H, Nuño MA, Richardson JE, Fan X, Ji J, Chu RM, Bender JG, Hawkins ES, Patil CG, Black KL, Yu JS
Cancer immunology, immunotherapy : CII 2013 Jan;62(1):125-35
Cancer immunology, immunotherapy : CII 2013 Jan;62(1):125-35
Unexpected heterogeneity of multifunctional T cells in response to superantigen stimulation in humans.
McArthur MA, Sztein MB
Clinical immunology (Orlando, Fla.) 2013 Feb;146(2):140-52
Clinical immunology (Orlando, Fla.) 2013 Feb;146(2):140-52
Simian immunodeficiency virus-induced changes in T cell cytokine responses in cynomolgus macaques with latent Mycobacterium tuberculosis infection are associated with timing of reactivation.
Mattila JT, Diedrich CR, Lin PL, Phuah J, Flynn JL
Journal of immunology (Baltimore, Md. : 1950) 2011 Mar 15;186(6):3527-37
Journal of immunology (Baltimore, Md. : 1950) 2011 Mar 15;186(6):3527-37
Lysosomal localization and mechanism of membrane penetration influence nonenveloped virus activation of the NLRP3 inflammasome.
Barlan AU, Danthi P, Wiethoff CM
Virology 2011 Apr 10;412(2):306-14
Virology 2011 Apr 10;412(2):306-14
Differential effects of TBC1D15 and mammalian Vps39 on Rab7 activation state, lysosomal morphology, and growth factor dependence.
Peralta ER, Martin BC, Edinger AL
The Journal of biological chemistry 2010 May 28;285(22):16814-21
The Journal of biological chemistry 2010 May 28;285(22):16814-21
The small chemical vacuolin-1 alters the morphology of lysosomes without inhibiting Ca2+-regulated exocytosis.
Huynh C, Andrews NW
EMBO reports 2005 Sep;6(9):843-7
EMBO reports 2005 Sep;6(9):843-7
No comments: Submit comment
Supportive validation
- Submitted by
- Invitrogen Antibodies (provider)
- Main image
- Experimental details
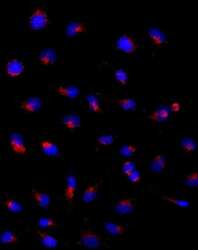
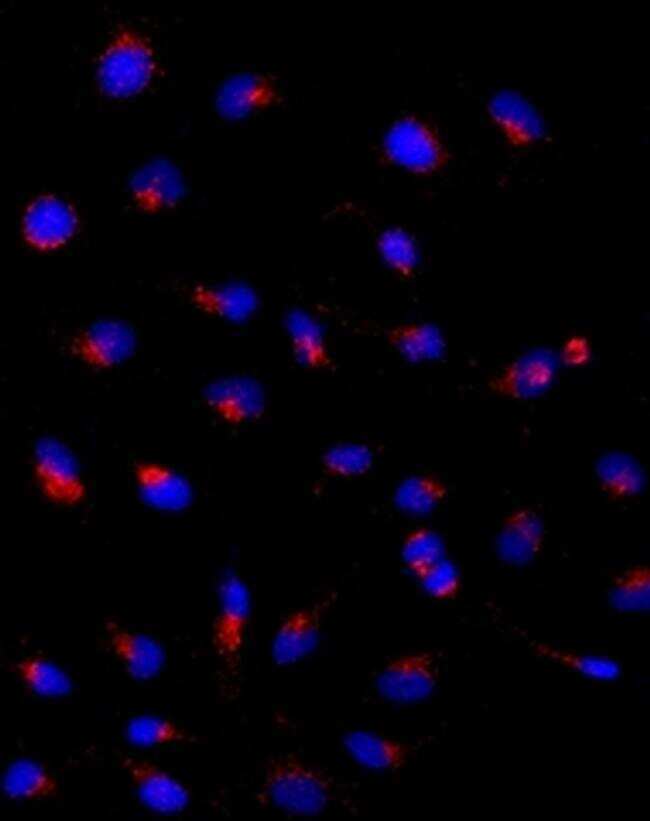
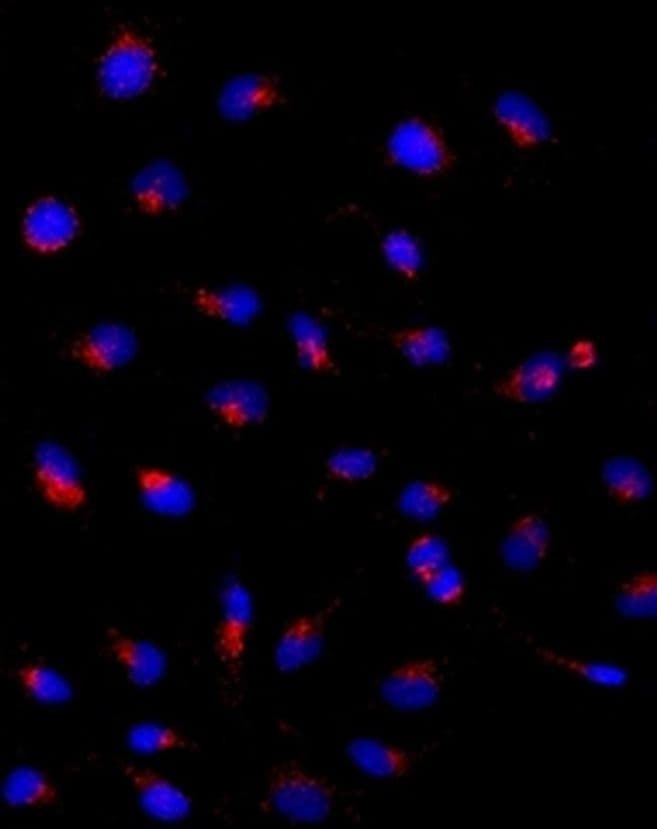
- Immunocytochemistry of HeLa cells stained with 5 µg/mL Anti-Human CD107a (LAMP-1) Purified followed by F (ab')2 Anti-Mouse IgG eFluor® 570 (left). Nuclei are stained with DAPI.
- Submitted by
- Invitrogen Antibodies (provider)
- Main image

- Experimental details
- Immunocytochemistry of HeLa cells stained with 5 µg/mL Anti-Human CD107a (LAMP-1) Purified followed by F (ab')2 Anti-Mouse IgG eFluor® 570 (left). Nuclei are stained with DAPI.
Supportive validation
- Submitted by
- Invitrogen Antibodies (provider)
- Main image
- Experimental details
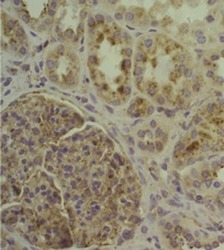
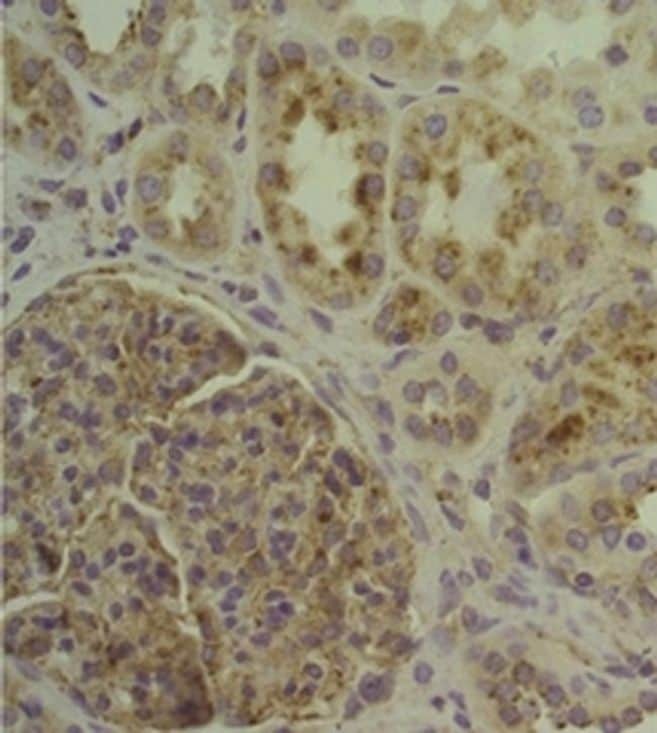
- Immunohistochemistry of human formalin-fixed paraffin embedded kidney (right) stained with 5 µg/mL Anti-Human CD107a (LAMP-1) Purified followed by Anti-Mouse IgG Biotin, Avidin HRP followed by DAB visualization. Nuclei are counterstained with hematoxylin.
- Submitted by
- Invitrogen Antibodies (provider)
- Main image
- Experimental details
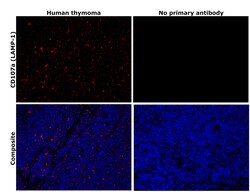
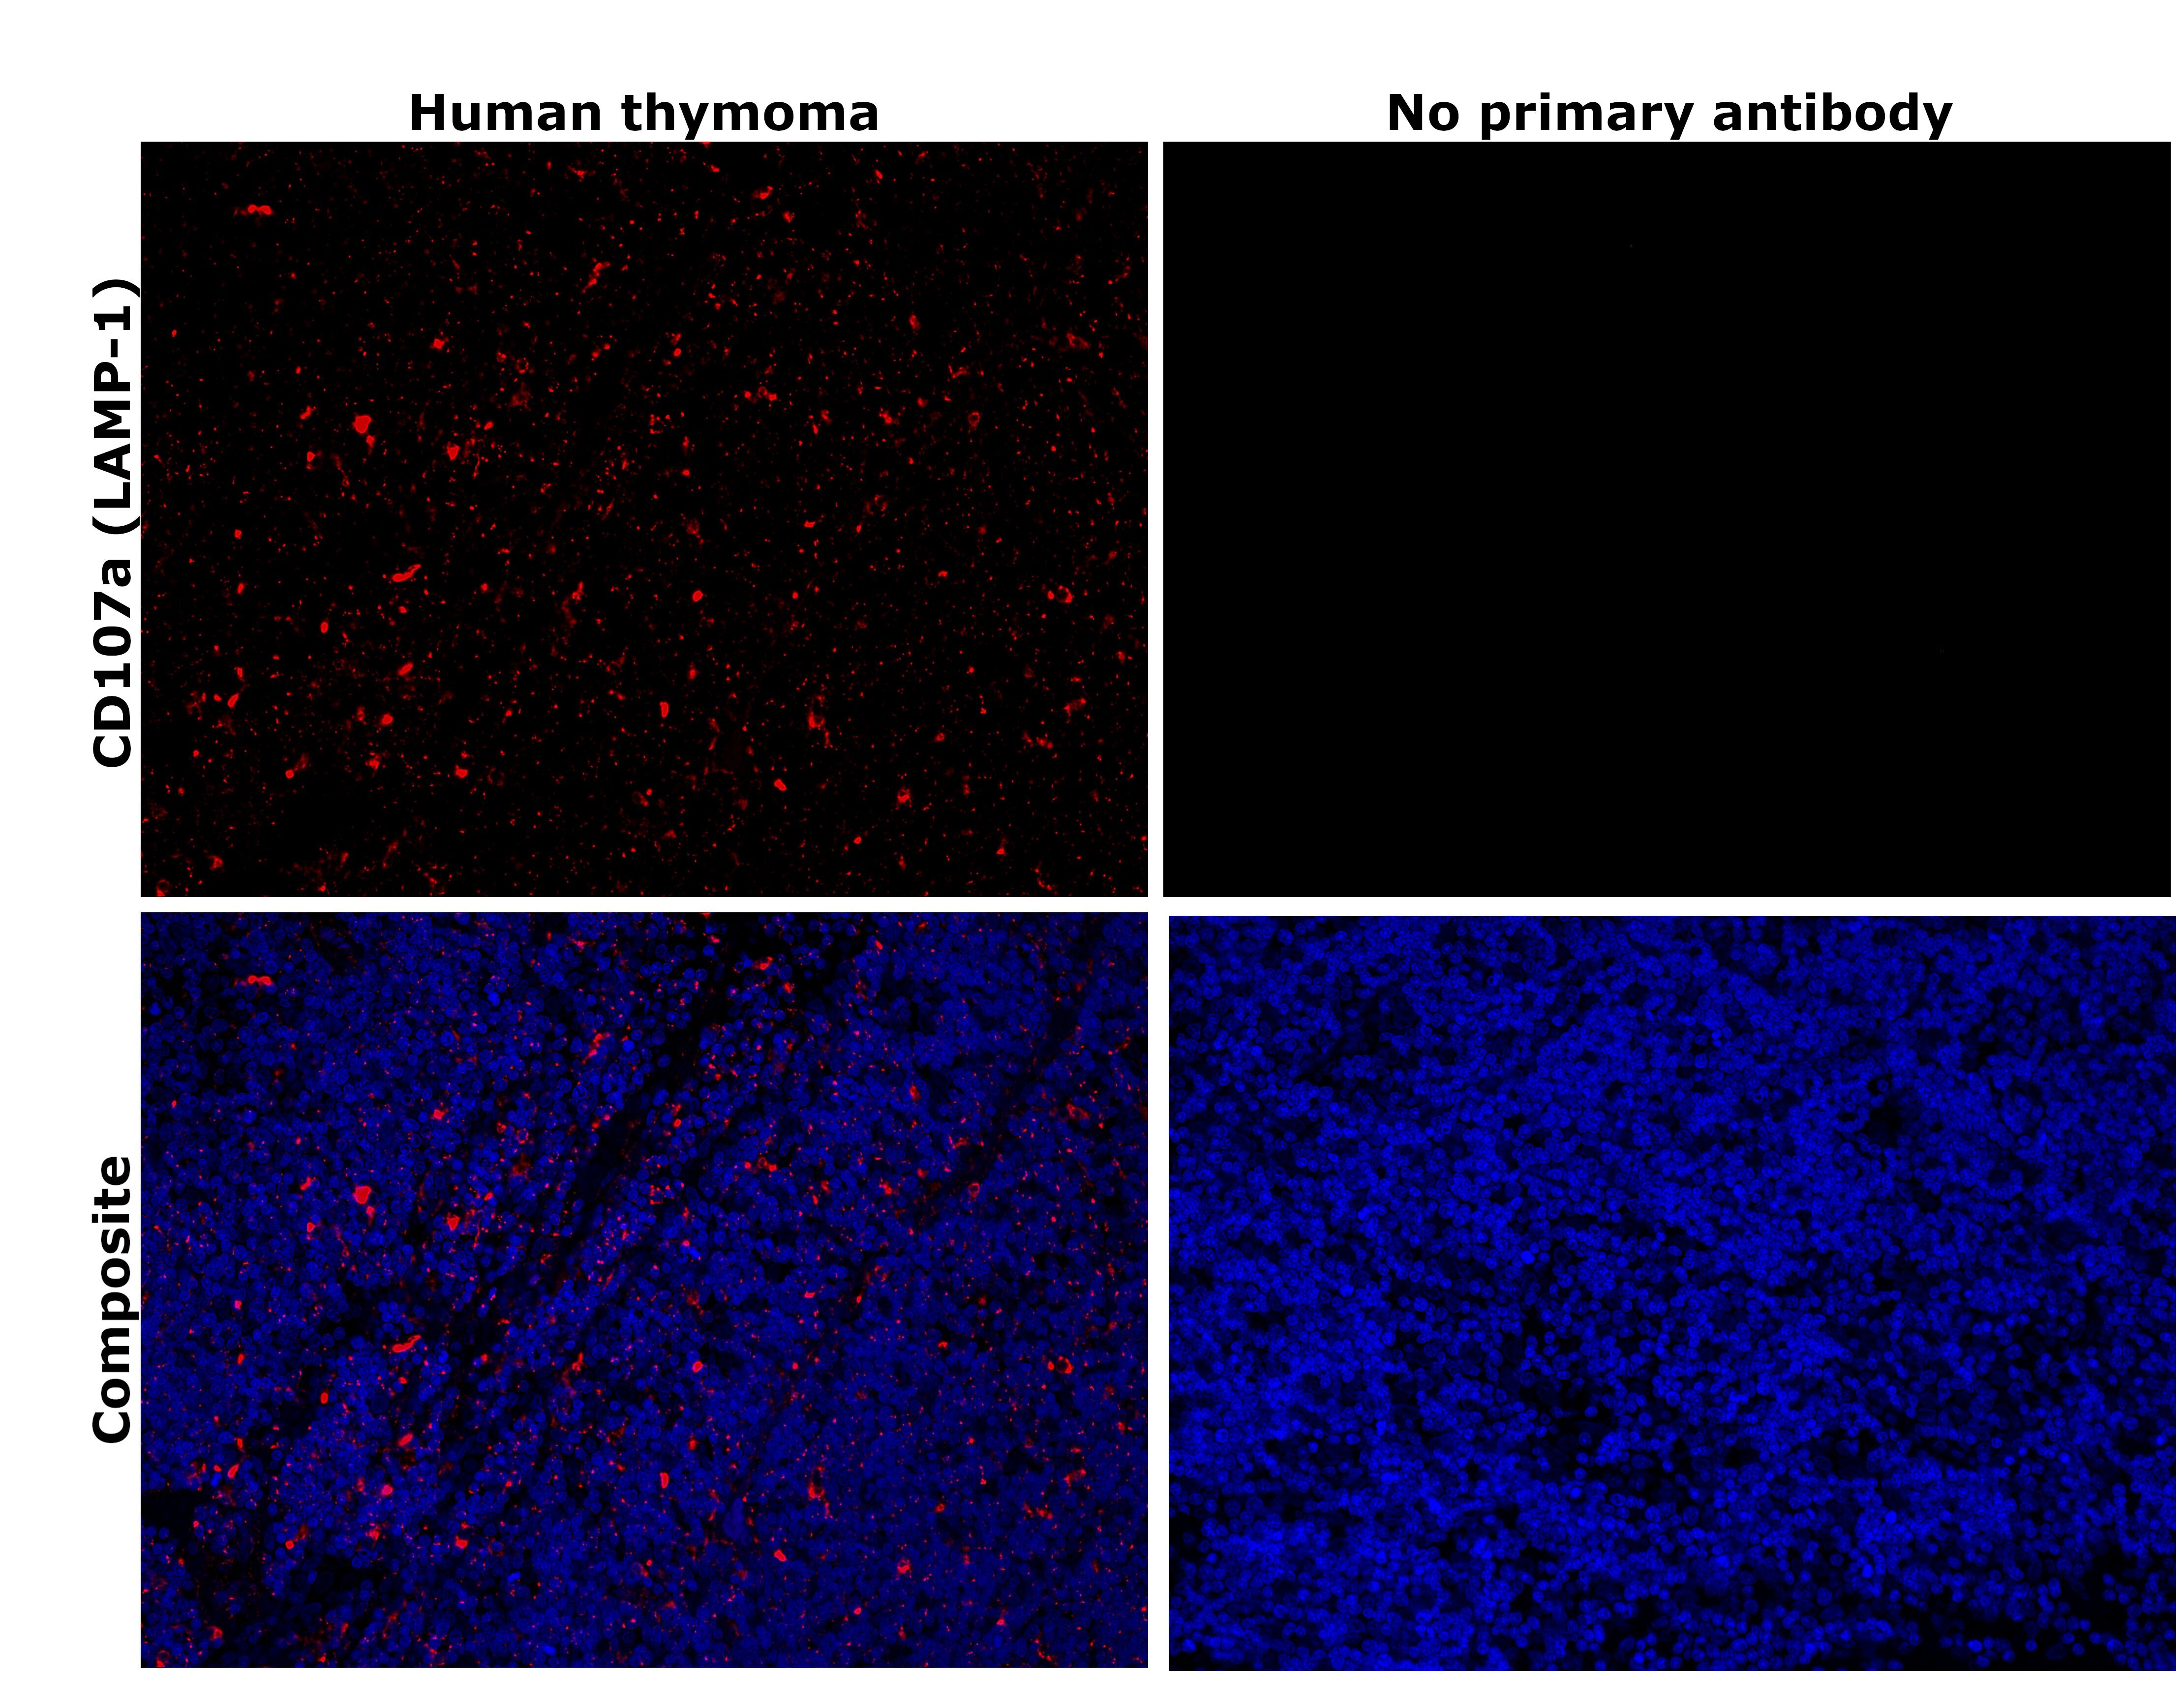
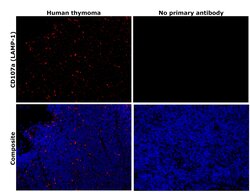
- Immunohistochemical analysis of CD107a (LAMP-1) was performed using formalin-fixed paraffin-embedded human cancer (thymoma) tissue sections. To expose the target protein, heat-induced epitope retrieval was performed on de-paraffinized sections using eBioscience™ IHC Antigen Retrieval Solution - High pH (10X) (Product # 00-4956-58) diluted to 1X solution in water in a decloaking chamber at 110 degree Celsius for 15 minutes. Following antigen retrieval, the sections were blocked with 3% H2O2 for 1 hour at room temperature followed by 2% normal goat serum in 1X PBS for 45 minutes at room temperature and then probed with or without CD107a (LAMP-1) Monoclonal Antibody (eBioH4A3), eBioscience™ (Product # 14-1079-80) at 1 µg/mL in 0.1% normal goat serum overnight at 4 degree Celsius in a humidified chamber. Detection was performed using Alexa Fluor™ 594 Tyramide SuperBoost™ Kit, goat anti-mouse IgG (Product # B40915). Nuclei were stained with DAPI (Product # D1306) and the sections were mounted using ProLong™ Glass Antifade Mountant (Product # P36984). The images were captured on EVOS™ M7000 Imaging System (Product # AMF7000) at 20X magnification and externally deconvoluted.
- Submitted by
- Invitrogen Antibodies (provider)
- Main image
- Experimental details
- Immunohistochemical analysis of CD107a (LAMP-1) was performed using formalin-fixed paraffin-embedded human cancer (thymoma) tissue sections. To expose the target protein, heat-induced epitope retrieval was performed on de-paraffinized sections using eBioscience™ IHC Antigen Retrieval Solution - High pH (10X) (Product # 00-4956-58) diluted to 1X solution in water in a decloaking chamber at 110 degree Celsius for 15 minutes. Following antigen retrieval, the sections were blocked with 3% H2O2 for 1 hour at room temperature followed by 2% normal goat serum in 1X PBS for 45 minutes at room temperature and then probed with or without CD107a (LAMP-1) Monoclonal Antibody (eBioH4A3), eBioscience™ (Product # 14-1079-80) at 1 µg/mL in 0.1% normal goat serum overnight at 4 degree Celsius in a humidified chamber. Detection was performed using Alexa Fluor™ 594 Tyramide SuperBoost™ Kit, goat anti-mouse IgG (Product # B40915). Nuclei were stained with DAPI (Product # D1306) and the sections were mounted using ProLong™ Glass Antifade Mountant (Product # P36984). The images were captured on EVOS™ M7000 Imaging System (Product # AMF7000) at 20X magnification and externally deconvoluted.
Supportive validation
- Submitted by
- Invitrogen Antibodies (provider)
- Main image
- Experimental details
- NULL
- Submitted by
- Invitrogen Antibodies (provider)
- Main image
- Experimental details
- NULL
- Submitted by
- Invitrogen Antibodies (provider)
- Main image
- Experimental details
- NULL

- Submitted by
- Invitrogen Antibodies (provider)
- Main image
- Experimental details
- NULL
- Submitted by
- Invitrogen Antibodies (provider)
- Main image
- Experimental details
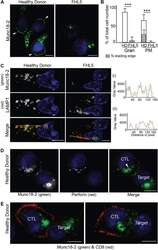
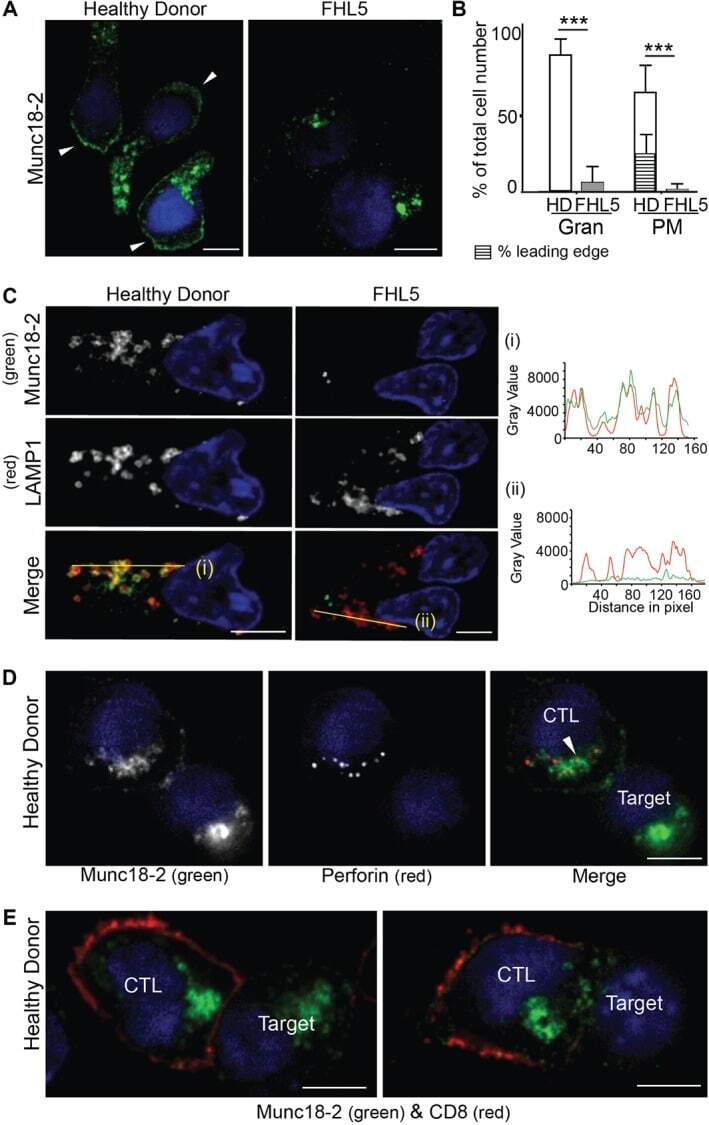
- Figure 2 Endogenous Munc18-2 localizes predominantly to cytolytic granules in human CTL. A) Immunofluorescence microscopy showing localization of Munc18-2 (antibody 5182) in healthy donor (HD) and FHL5 CTL (UPN666). White arrowheads: leading edge. B) Quantitation of Munc18-2 antibody staining from 6 independent experiments: HD (white, n = 397) and FHL5 (gray, n = 374). Gran: granular staining, PM: plasma membrane staining, hatched bar = HD CTL with an accumulation of Munc18-2 at the leading edge. Shown is the mean with standard deviation, *** indicates a significant difference with p < 0.0001, two-tailed students t-test (unpaired), 95% confidence limits. C) Co-staining for Munc18-2 (green) and LAMP1 (red) in three independent experiments comparing HD and FHL5 CTL ( n = 158 each). Yellow lines (i) and (ii) were drawn via the image J line tool (linewidth: 3 pixel) to obtain Munc18-2 and LAMP1 intensity profiles. Imaris display adjustments optimized for granular signal. D) Co-staining of a CTL-P815 conjugate for Munc18-2 (green) and perforin (red, exclusively expressed in CTL). The white arrowhead indicates a perforin core surrounded by Munc18-2 ( n = 119 HD, 2 independent experiments). E) Co-staining of a CTL-P815 conjugate for Munc18-2 (green) and CD8 (red) showing polarization of granule-associated Munc18-2 toward the synapse ( n = 63). All images show single confocal planes. Scale bars: 5 um. TRA-12337-FIG-0002-c
- Submitted by
- Invitrogen Antibodies (provider)
- Main image
- Experimental details
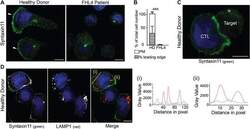
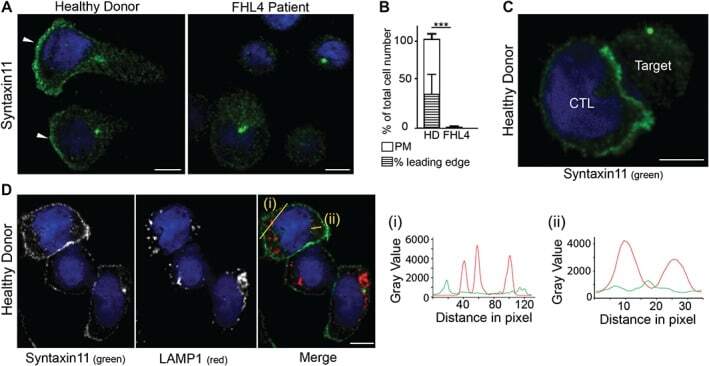
- Figure 3 Endogenous STX11 is on the plasma membrane of human CTL. A) Localization of STX11 in healthy donor (HD) and FHL4 patient 847-1850 CTL using antibody 5412. White arrowheads: leading edge. B) Percentage of cells with plasma membrane staining for HD (white, n = 328) and FHL4 (black, n = 312) CTL using antibody 5412. PM: plasma membrane staining, hatched bar = HD CTL with an accumulation of STX11 at the leading edge. Results shown as mean from five independent experiments with standard deviation, *** indicate a significant difference with p < =0.0001, two-tailed students t-test (unpaired), 95% confidence limits. C) STX11 staining using antibody 5412 in HD CTL-target conjugates illustrating STX11 accumulation at the synapse (5 experiments, n = 128). D) Co-staining for anti-STX11 5412 (green) and LAMP1 (red) in HD cells (2 experiments, n = 135). Yellow lines (i) and (ii) were drawn via the image J line tool (linewidth: 3 pixel) to obtain STX11 and LAMP1 intensity profiles. All images show single confocal planes. Scale bars: 5 um. TRA-12337-FIG-0003-c
- Submitted by
- Invitrogen Antibodies (provider)
- Main image

- Experimental details
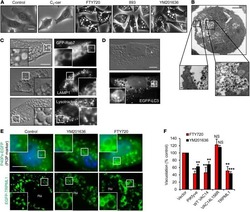
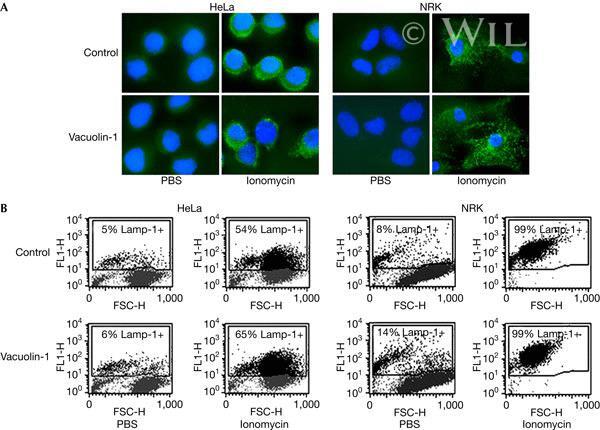
- Vacuolin-1 does not inhibit the surface exposure of Lamp-1 induced by ionomycin. ( A ) HeLa and NRK cells that were plated on glass coverslips and treated or not with 5 muM vacuolin-1 for 1 h were exposed or not to 5 muM ionomycin for 10 min, transferred to ice and surface labelled with monoclonal antibodies against the luminal domain of Lamp-1, followed by fixation and staining with fluorescent secondary antibodies (green), and 4,6-diamidino-2-phenylindole to label cell nuclei (blue). Punctate Lamp-1 surface staining was observed after ionomycin exposure, in cells treated or nor with vacuolin-1. ( B ) HeLa and NRK cells that were treated or not with 5 muM vacuolin-1 for 1 h were trypsinized, exposed to 5 muM ionomycin for 10 min, surface stained for Lamp-1 and examined by fluorescence-activated cell sorting. FL1-H, fluorescence intensity; FSC-H, forward scatter.
- Submitted by
- Invitrogen Antibodies (provider)
- Main image
- Experimental details
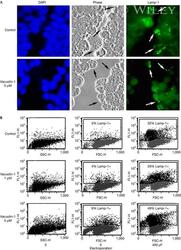
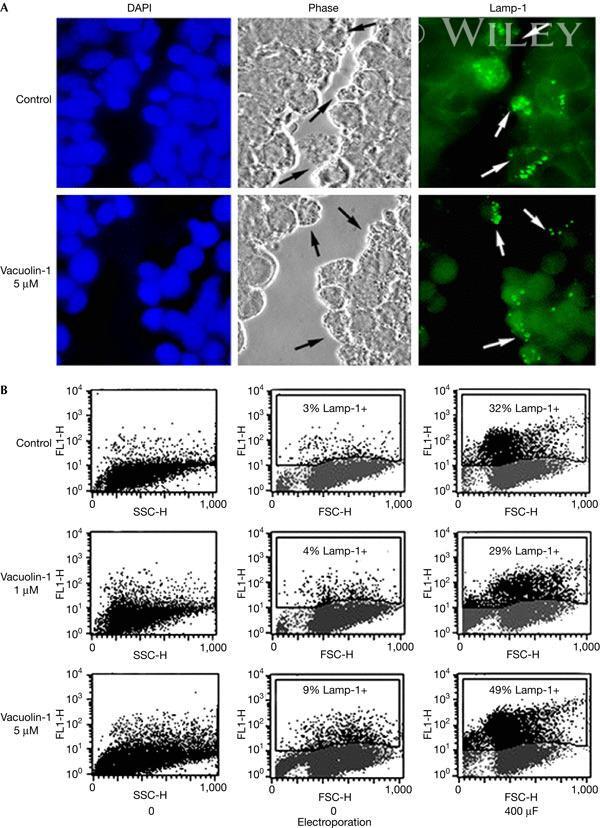
- Vacuolin-1 does not inhibit the surface exposure of Lamp-1 induced by plasma membrane wounding. ( A ) Confluent monolayers of HeLa cells grown on glass coverslips were treated or not with 5 muM vacuolin for 1 h, scratched several times in a grid fashion with a scalpel, transferred to ice and surface labelled with anti-Lamp-1 monoclonal antibodies. After fixation, cells were incubated with a fluorescent secondary antibody (green), and 4,6-diamidino-2-phenylindole to stain cell nuclei (blue). The arrows point to wounded cells that exposed the luminal domain of Lamp-1 on the cell surface. ( B ) NRK cells, treated or not with vacuolin-1 for 1 h, were wounded in suspension by electroporation, surface stained for Lamp-1 and examined by fluorescence-activated cell sorting. No inhibition of injury-induced lysosomal exocytosis was observed after vacuolin-1 treatment. FL1-H, fluorescence intensity; FSC-H, forward scatter; SSC-H, side scatter.
- Submitted by
- Invitrogen Antibodies (provider)
- Main image
- Experimental details
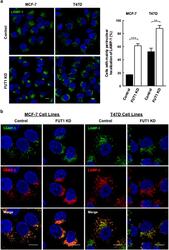
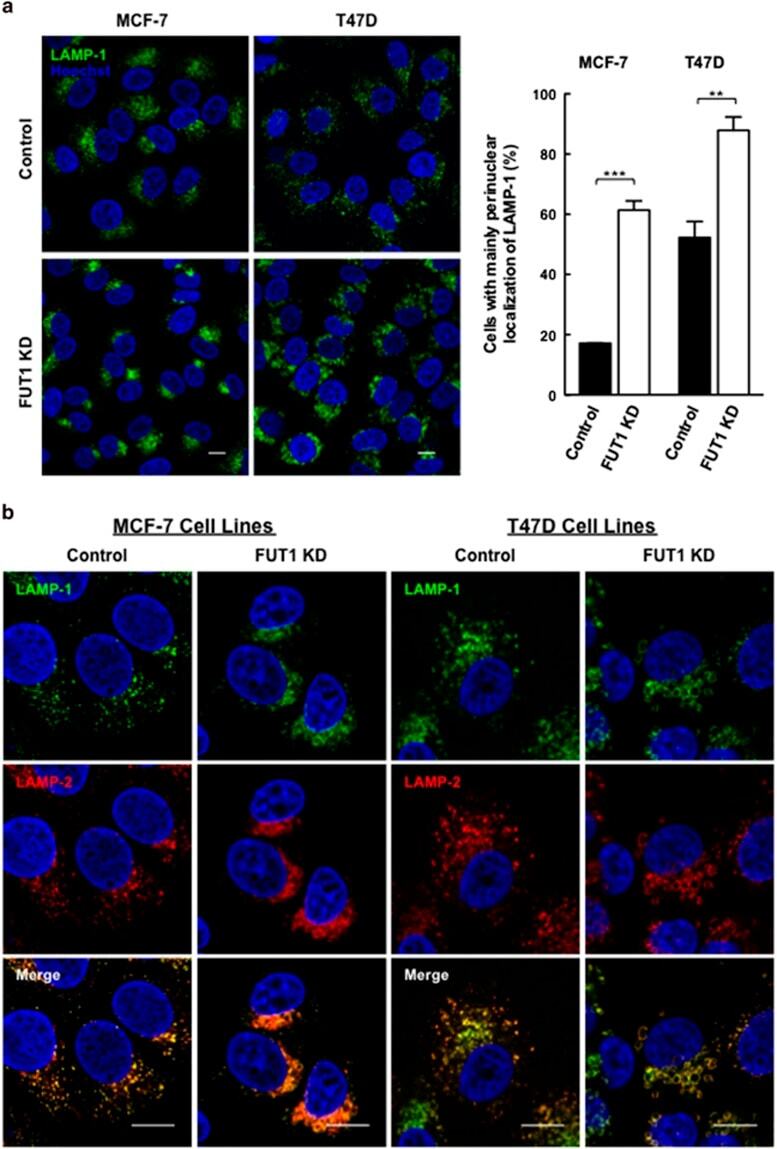
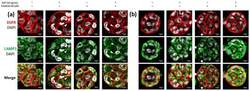
- Figure 4 Downregulation of FUT1 leads to accumulation of LAMP-1/2(+) vesicles at perinulear area of MCF-7 and T47D cells. ( a ) Immunofluorescence staining for LAMP-1 in control and FUT1 knockdown cells with anti-LAMP-1 (green) and Hoechst (nucleus, blue). Stained cells were then analyzed by confocal microscopy at x 63 magnification (MCF-7 cells) and x 100 magnification (T47D cells). Scale bars, 10 mu m. Histogram shows the percentage of control (black bars) and FUT1 knockdown (white bars) cells with predominantly perinuclear localization of LAMP-1. Data shown are the mean+-S.E.M. of three independent experiments (*** P
- Submitted by
- Invitrogen Antibodies (provider)
- Main image
- Experimental details
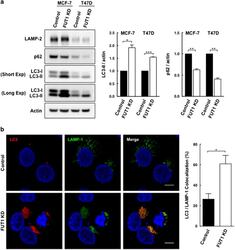
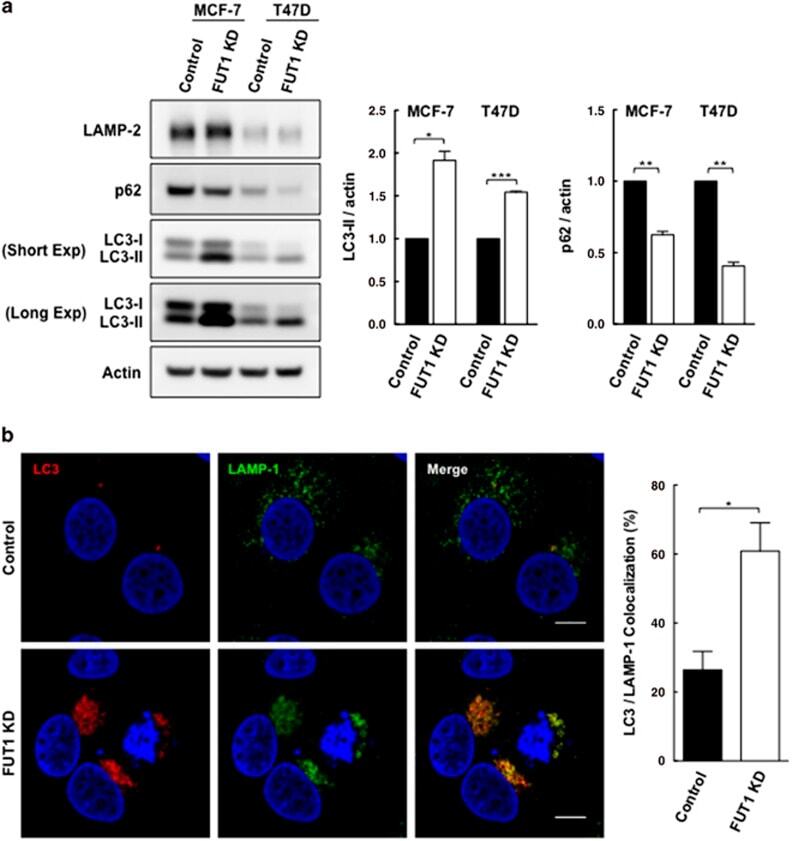
- Figure 5 Knockdown of FUT1 is associated with an increase in autophagic flux. ( a ) Immunoblot analysis of LC3-II and p62 levels in control and FUT1 knockdown cells. Total cell lysates from MCF-7 and T47D cells transfected with control or FUT1 siRNAs were collected at 120 and 96 h post-transfection, respectively. Equal amounts of cell lysates were then loaded in each lane and separated by SDS-PAGE. Immunoblot analysis was performed with LC3 and p62 antibodies. Actin was used as a loading control. The intensity of LC3-II and p62 protein bands on immunoblot were quantified and normalized to actin, and the relative levels of protein expression were expressed as fold change by setting the control group value to 1. Values shown are mean+-S.E.M. of three independent experiments (*** P
- Submitted by
- Invitrogen Antibodies (provider)
- Main image
- Experimental details
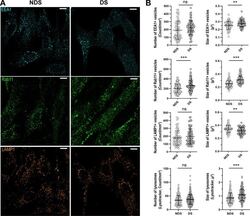
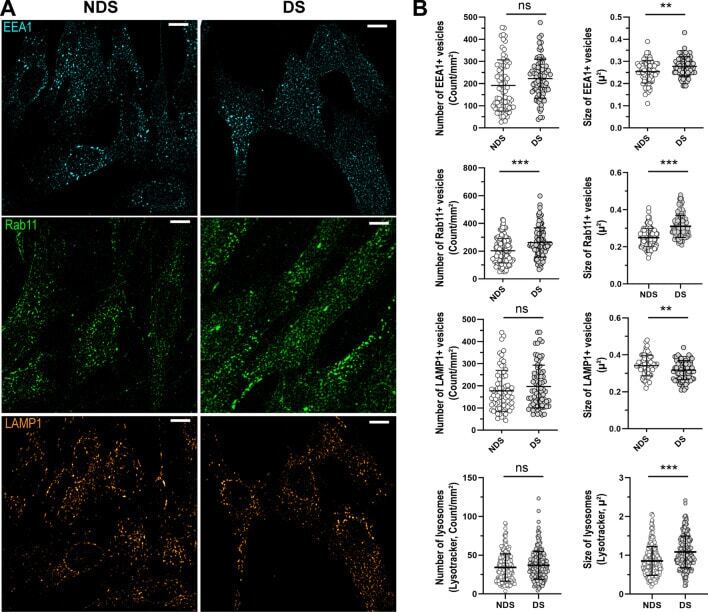
- Figure 3 Characterization of the compartments involved in the trafficking of IgG. ( A ) Representative confocal microscopy images showing the distribution of early endosomes (EEA1, cyan), recycling endosomes (Rab11, green), and lysosomes (LAMP1, orange) in diploid (NDS) and trisomic (DS) fibroblasts after incubation with IgG for 60 min at 37 degC. Scale bar: 10 um. ( B ) Number and size of EEA1 + endosomes (upper panel), Rab11 + recycling endosomes (upper middle panel), and lysosomes (LAMP1, Lysotracker) (lower middle and lower panels) in NDS (NDS-1, -2, and -3) and DS (DS-1, -2, and -3) cells. Each bar represents the mean +- SD. Each point represents measurements in individual cells (NDS, 72-296 cells/marker; DS, 82-250 cells cells/marker). **P < 0.01, ***P < 0.001, ns = not significant, Student's t test.
- Submitted by
- Invitrogen Antibodies (provider)
- Main image
- Experimental details
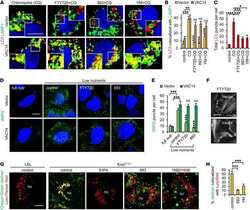
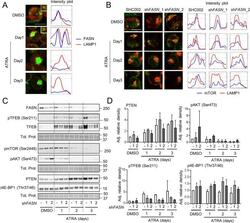
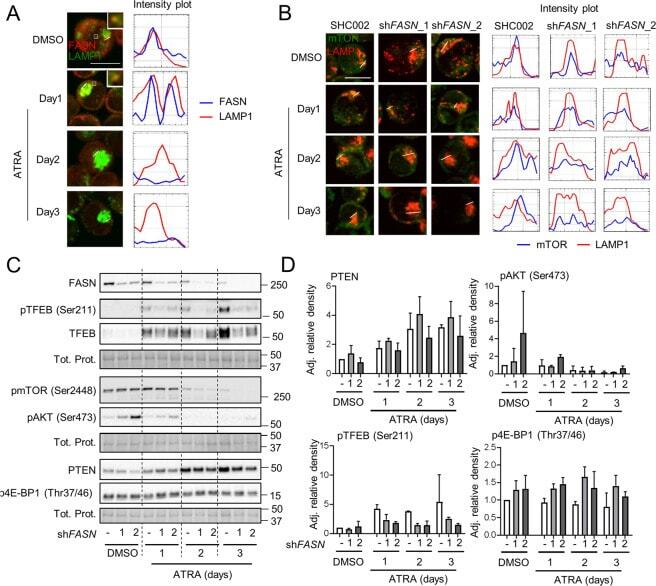
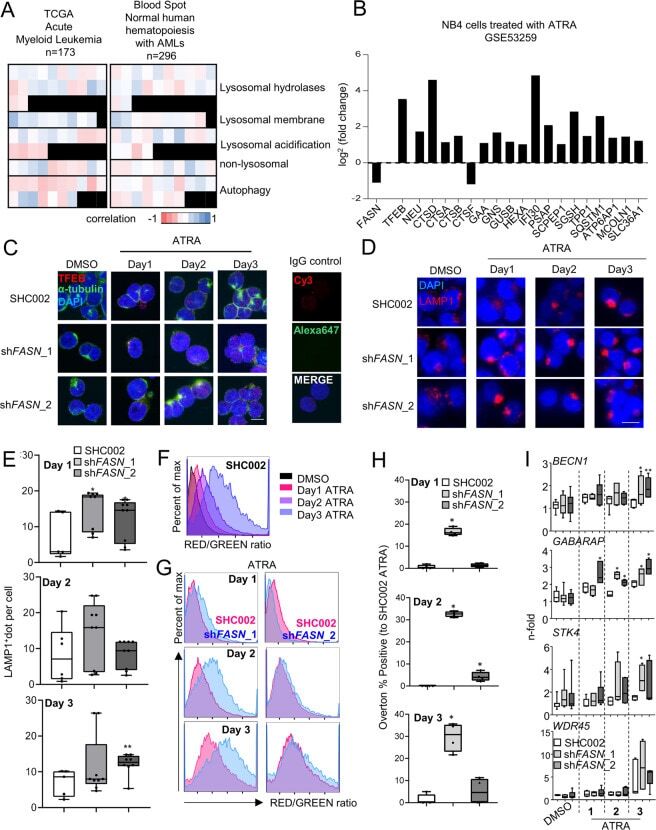
- Fig. 5 FASN localizes at the lysosome to increase mTOR activity. A NB4 cells were treated as in 2D and fixed and stained for endogenous FASN (red) and LAMP1 (green) protein. The colocalization analysis was performed using ImageJ software. Scale: 10 um. Results shown are from at least two biological duplicates. B - D NB4 control (SHC002) and FASN knockdown (sh FASN _1, _2) cells were treated for 1-3 days with ATRA. B Immunofluorescence microscopy of endogenous mTOR (green) and LAMP1 (red). The colocalization analysis was performed using ImageJ software. Scale: 10 um. C Total protein was extracted and subjected to immunoblotting using anti-FASN, anti-pmTOR(Ser2448), anti-pTFEB(Ser211), anti-TFEB, anti-pAKT(Ser473) anti-PTEN and anti-p4E-BP1 (Thr37/46) antibodies. D Relative protein expressions of two independent experiments were normalized to total protein or the respective non-phosphorylated protein and quantified using ImageJ software (NIH, Bethesda, MD, USA).
- Submitted by
- Invitrogen Antibodies (provider)
- Main image

- Experimental details
- Fig. 6 FASN expression negatively associates with TFEB activity. A Heatmaps of the correlation between FASN and TFEB target genes extracted from the TCGA-AML cohort analyzed by the UCSD xena platform and from the blood spot data bank (Spearman, p values in Supplementary Table 1 and 2 ). B mRNA sequencing data of NB4 cells treated with ATRA. Relative expression of FASN , TFEB and TFEB transcriptional targets involved in lysosomal function and biogenesis are shown. C - H NB4 control (SHC002) and FASN knockdown (sh FASN _1, _2) cells were treated for 1-3 days with ATRA. C Immunofluorescence microscopy of endogenous TFEB (red) and alpha-tubulin (green). IgG staining was used as negative control. Nuclei were stained with DAPI (blue). D Immunofluorescence microscopy of endogenous LAMP1 (red). Nuclei were stained with DAPI (blue). Scale: 10 um ( E ) LAMP1 punctae quantification of cells shown in ( D ). Scale: 10 um ( F - H ) Acridine Orange staining. F Histogram representation of the ratio between RED and GREEN of NB4 control (SHC002) cells treated as described in 6 C. G Representative histogram of NB4 control (SHC002) and FASN knockdown (sh FASN _1, _2) cells treated as in 6 C. H Overton percentage positive quantification of the RED/GREEN ratio of NB4 control (SHC002) and FASN knockdown (sh FASN _1, _2) cells treated with ATRA at indicated times. I Evaluation of BECN1 , GABARAP , STK4 and WDR45 mRNA transcripts was done by qPCR. Values were normalized to the HMBS housekeeping gene.
- Submitted by
- Invitrogen Antibodies (provider)
- Main image
- Experimental details
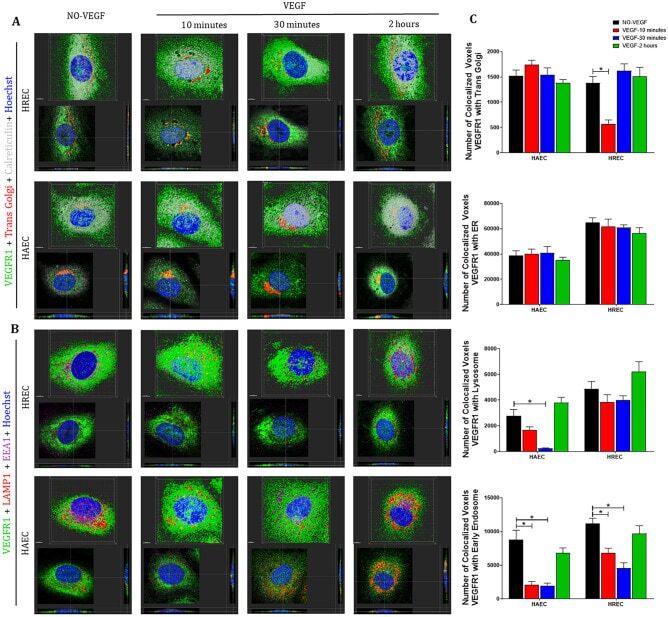
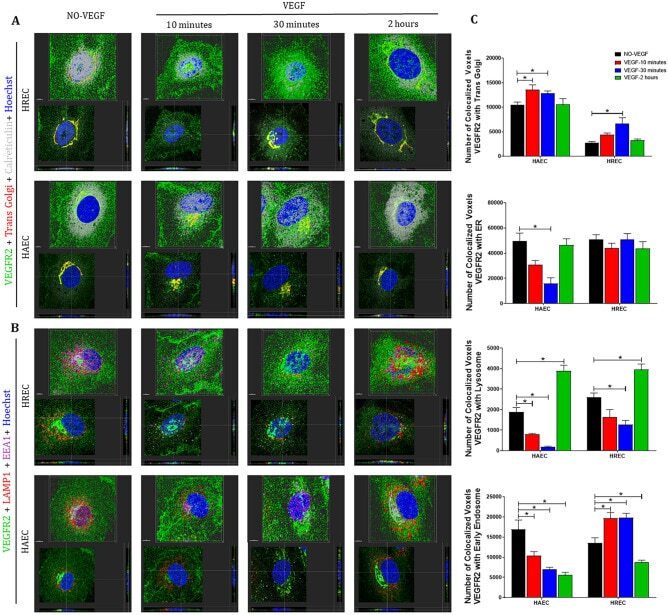
- Figure 4 VEGFR1 translocates from intracellular compartments to the nucleus after VEGF treatment of endothelial cells . Intracellular trafficking of VEGFR1 in HREC and HAEC were evaluated by immunofluorescence at different time points (10 min, 30 min and 2 h) after exposure to 100 ng/ml VEGF and compared to saline controls (NO-VEGF). Triple immunofluorescence was performed to colocalize VEGFR1 with specific organelles. ( A ) 3D reconstruction rendering of the HREC and HAEC immunostained with VEGFR1 (green), trans Golgi (red) and calreticulin (endoplasmic reticulum-ER gray) ( B ) 3D reconstruction rendering of HREC and HAEC immunostained with VEGFR1 (green), LAMP1 (lysosome-red) and EEA1 (early endosome-magenta). The nuclei in ( A ) and ( B ) were fluorescently stained with the DNA intercalating dye Hoechst (blue). The colocalization points between green and red are shown in yellow and between green and magenta shown in gray. The top image of each block shows the 3D rendering of the representative cells at each time point and the same cells are shown in the lower image of each block showing the position of the nuclear translocation of VEGFR1 in only one focal plane in the center and the correlation of this point located in the 3D lateral and lower cross sections. Scale bars = 5 mum. ( C ) Quantification of the number of VEGFR1 colocalized voxels with the organelles relative to the number of cells in each image. The results show the analyzes of at least 10 confocal z-stack imag
- Submitted by
- Invitrogen Antibodies (provider)
- Main image
- Experimental details
- Figure 5 VEGFR2 can translocate from plasma membrane and intracellular compartments to the nucleus via early endosomes following VEGF treatment in endothelial cells . Intracellular trafficking of VEGFR2 in HREC and HAEC was evaluated by immunofluorescence at different time points (10 min, 30 min and 2 h) after exposure to 100 ng/ml VEGF and compared to saline controls (NO-VEGF). Triple immunofluorescence was performed to colocalize VEGFR2 with specific organelles. ( A ) 3D reconstruction rendering of the HREC and HAEC immunostained with VEGFR2 (green), trans Golgi (red) and calreticulin (endoplasmic reticulum-ER gray) ( B ) 3D reconstruction rendering of HREC and HAEC immunostained with VEGFR2 (green), LAMP1 (lysosome-red) and EEA1 (early endosome-magenta). The nuclei in ( A ) and ( B ) were fluorescently stained with the DNA intercalating dye Hoechst (blue). The colocalization points between green and red are shown in yellow and between green and magenta shown in gray. The top image of each block shows the 3D rendering of the representative cells of each time point and the same cells are shown in the lower image of each block showing the position of the nuclear translocation of VEGFR2 in only one focal plane in the center and the correlation of this point located in the 3D lateral and lower cross sections. Scale bars = 5 mum. ( C ) Quantification of the number of VEGFR2 colocalized voxels with the organelles relative to the number of cells in each image. The results show the
- Submitted by
- Invitrogen Antibodies (provider)
- Main image

- Experimental details
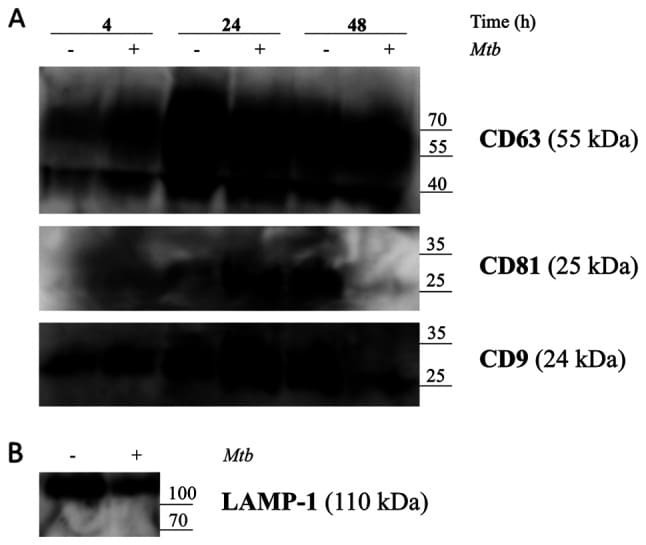
- Figure 5. Release of exosomes from Mtb H37Rv-infected or naive THP-1 cells. THP-1 macrophages were infected with Mtb H37Rv (Mtb + ) for 4 h (MOI 5) in DCM-UG medium for 4, 24 and 48 h at 37degC and in the presence of 5% CO 2 . Exosomes were extracted from cell culture supernatants using total exosome isolation reagent and were further analyzed by western blot analysis for the exosomal protein markers, (A) CD63, CD81, CD9 and (B) LAMP-1, which served as a positive control for exosomes signal and Mtb proteins [Ag85 and Mpt64 and recombinant Mtb Mpt64 protein (His-tag)]. Data from one representative experiment out of at least three independent experiments are shown. MOI, multiplicity of infection; Mtb, Mycobacterium tuberculosis ; DCM-UG, ultra-centrifuged CellGenix (r) GMP DC Medium; LAMP-1, lysosomal associated membrane protein-1; Ag85, mycobacterial antigen 85.
- Submitted by
- Invitrogen Antibodies (provider)
- Main image
- Experimental details
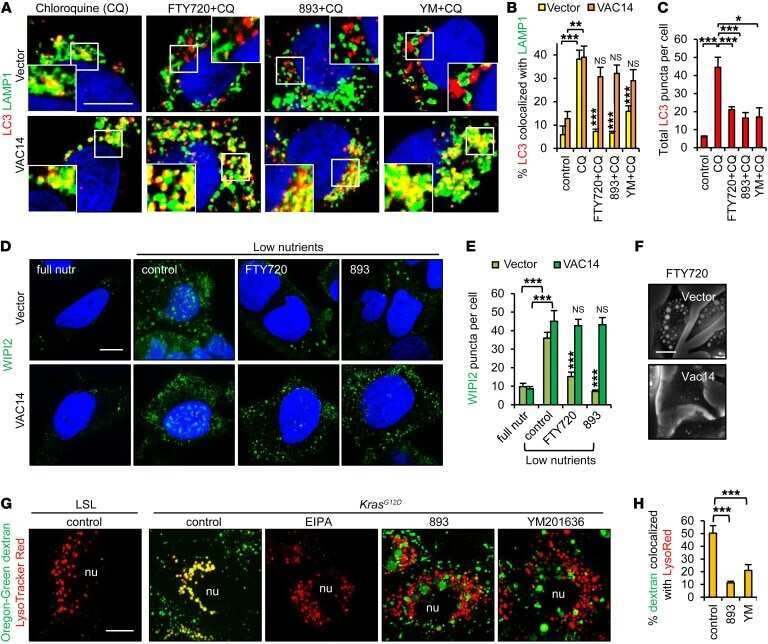
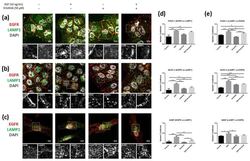
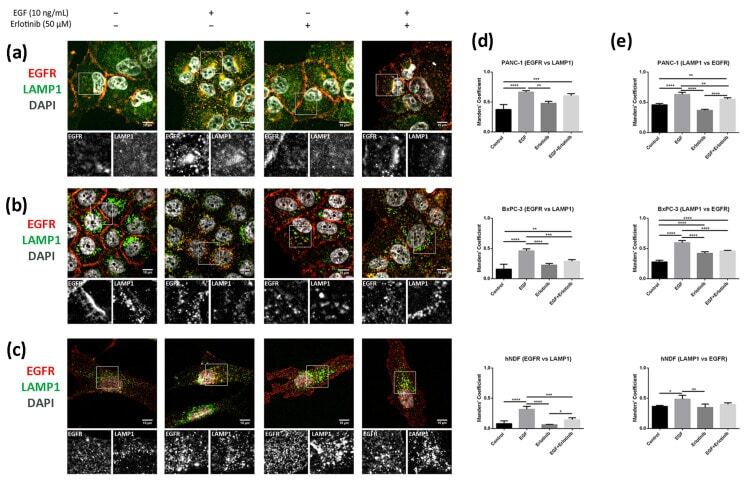
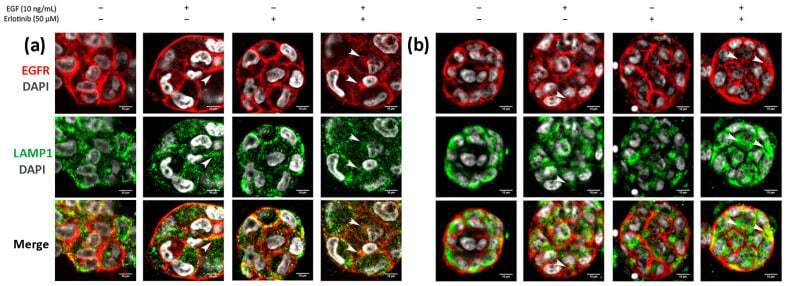
- Figure 10 Colocalization analysis of the EGFR and LAMP1 (lysosomes) in cells incubated with EGF, erlotinib or both in 2D cultures. EGFR (red) and LAMP1 (green) immunofluorescence counterstained with DAPI (grey) in ( a ) PANC-1; ( b ) BxPC-3 and ( c ) hNDF cells. Scale bars represent 10 um. Gray pictures show close-up sections of each marker; ( d ) Manders' colocalization coefficients showing the proportion of EGFR overlapping with LAMP1; ( e ) Manders' colocalization coefficients showing the proportion of LAMP1 overlapping with EGFR. Statistical differences are indicated as * for p < 0.05, ** for p < 0.01, *** for p < 0.001 and **** for p < 0.0001.
- Submitted by
- Invitrogen Antibodies (provider)
- Main image
- Experimental details
- Figure 12 Immunofluorescence of EGFR and LAMP1 in ( a ) PANC-1 and ( b ) BxPC-3 cells incubated with EGF, erlotinib or both in 0.15% RAD16-I 3D cultures. One representative Z plane is shown. Scale bars represent 10 um. White arrows show EGFR colocalizing with lysosomes.
- Submitted by
- Invitrogen Antibodies (provider)
- Main image
- Experimental details
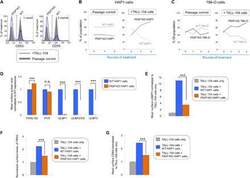
- Fig. 4 The GPI biosynthetic pathway is essential to CL activation and cytolytic granule secretion. ( A ) A mixed population of WT and PIGP KO HAP1 cells was either untreated or treated with TALL-104 cells. Negative surface staining of CD55, a GPI-AP not involved in CL-mediated killing, was used as a marker for PIGP KO cells. CD55 + WT cells and CD55 - PIGP KO cells were analyzed by flow cytometry. ( B ) Percentage of WT and PIGP KO HAP1 cells in the passage control or TALL-104-treated population. ( C ) Percentage of WT and PIGP KO 786-O cells in the passage control or TALL-104-treated population. CD55 + WT cells and CD55 - PIGP KO 786-O cells were quantified by flow cytometry after each round of treatment. Data in (B) and (C) are presented as mean values ( n = 3). ( D ) Normalized surface levels of immune regulators on WT and PIGP KO HAP1 cells. ( E ) TALL-104 degranulation presented as normalized surface levels of LAMP1 on TALL-104 cells. ( F ) Normalized surface levels of TRAIL on TALL-104 cells. ( G ) Normalized surface levels of CD69 on TALL-104 cells. Data in (D) to (G) are presented as means +- SD ( n = 3). P values were calculated using Student's t test. n.s., P > 0.05. *** P < 0.001.
- Submitted by
- Invitrogen Antibodies (provider)
- Main image
- Experimental details
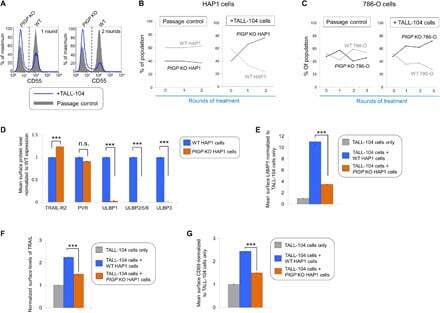
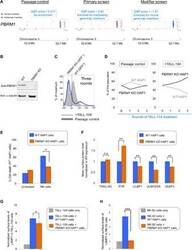
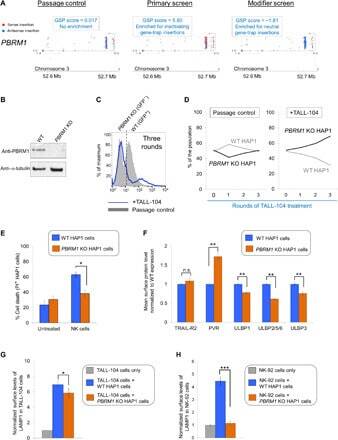
- Fig. 5 PBRM1 regulates ULBP expression in target cells and promotes cytolytic granule secretion in CLs. ( A ) Visual representations of gene-trap insertions in the PBRM1 gene in the screens. The gray boxes indicate exons, and the gray lines indicate introns. The gray arrows depict the direction of transcription. ( B ) Immunoblot showing PBRM1 expression in WT HAP1 cells and a clonal PBRM1 KO HAP1 cell line. PBRM1 mRNA expression in these cells is shown in fig. S13. ( C ) WT (GFP + ) and PBRM1 KO (GFP - ) cells in mixed populations were quantified by flow cytometry after three rounds of passage or TALL-104 treatment. ( D ) Percentage of WT and PBRM1 KO HAP1 cells in the passage control or TALL-104-treated population. Data are presented as mean values ( n = 3). ( E ) Percentage of propidium iodide-positive WT and PBRM1 KO HAP1 cells after treatment with primary human NK cells. ( F ) Mean surface levels of immune regulators on WT and PBRM1 KO HAP1 cells. ( G ) TALL-104 degranulation presented as normalized surface levels of LAMP1 on TALL-104 cells after incubation with target cells. ( H ) NK-92 degranulation presented as normalized surface levels of LAMP1 in NK-92 cells. Data in (E) to (H) are presented as means +- SD ( n = 3). P values were calculated using Student's t test. n.s., P > 0.05. * P < 0.05, ** P < 0.01, *** P < 0.001.
- Submitted by
- Invitrogen Antibodies (provider)
- Main image
- Experimental details
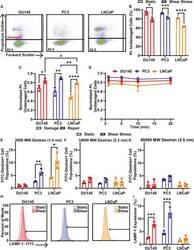
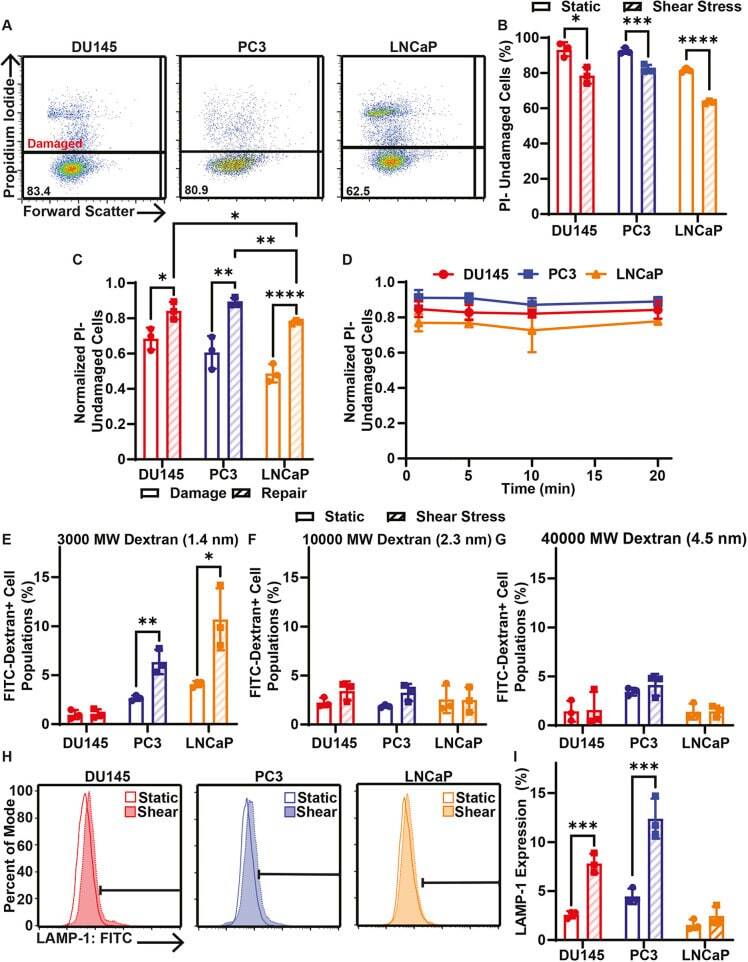
- Fig. 3. Cell membrane repair of cancer cells treated with 10 pulses of elevated FSS. (A) Representative PI flow cytometry scatter plots of membrane damage for DU145, PC3 and LNCaP cells after allowing 20 min of time for cell membrane repair. The percentage of the cell population in the undamaged cell gate (PI negative) is shown for each plot. (B) Average percentage of cancer cells treated with (shear stress) or without (static) 10 pulses of FSS that were undamaged after 20 min of cell membrane repair time. (C) Average proportion of undamaged cells for cell membrane damage measurements taken during FSS (damage) and for cells provided with 20 min of repair time after FSS (repair). (D) Normalized PI-negative (undamaged) cancer cells after different cell membrane repair times, ranging from 1 to 20 min. (E) Uptake of FITC-tagged 3000 MW, (F) 10,000 MW and (G) 40,000 MW dextran by cancer cells treated with or without 10 FSS pulses following 20 min of cell membrane repair. (H) Representative flow cytometry histograms of surface LAMP-1 staining. Horizontal bar indicates the LAMP-1-positive cell gate. (I) Average surface LAMP-1 expression for cancer cells treated with (hatched bars) or without (open bars) 10 pulses of FSS. Data are presented as mean+-s.d. N =3 independent experiments. * P
- Submitted by
- Invitrogen Antibodies (provider)
- Main image

- Experimental details
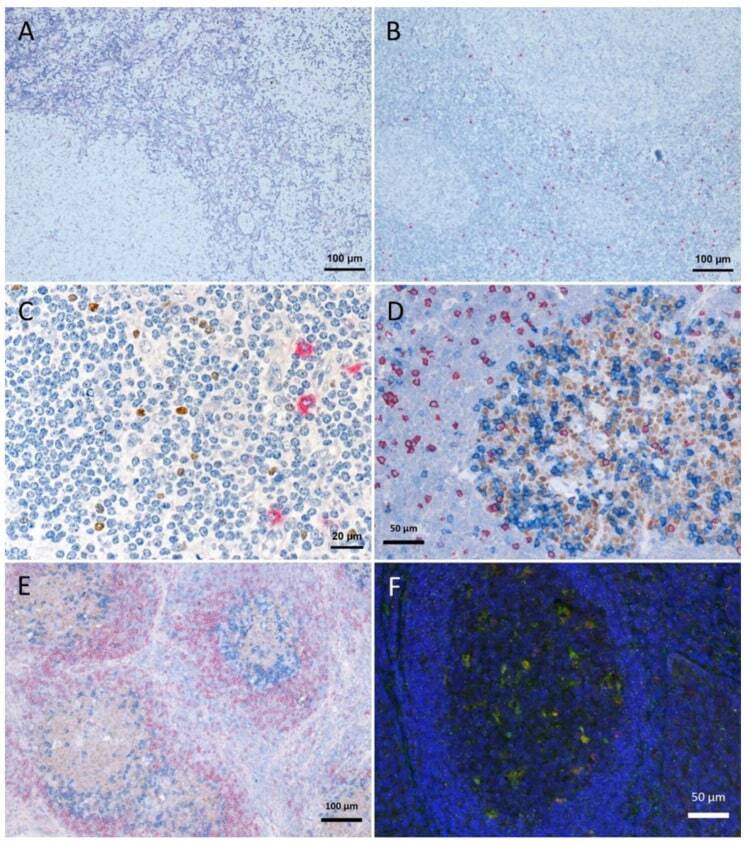
- Figure 1 Tissue degradation and signal loss vs. preserved tissue and signal with refixation. ( A ) FoxP3 staining (brown) after 5 min retrieval in high pressure cooker in citric buffer pH 6, followed by KLRG1 (red) after proteinase K pretreatment and ( B ) vice versa (proteinase K followed by high pressure cooking) lead to strong tissue degradation. ( C - F ) show examples with refixation between the retrievals. ( C ) Protocols from ( B ) with interposed refixation step lead to preservation of tissue structure with maintained signals (KLRG1 red, FoxP3 brown). ( D , E ) Examples of triple staining with up to two retrievals: ( D ) human tonsil, CD8 (red, 2 min high pressure cooking) followed by Bcl6 (brown, 5 min high pressure cooking) together with PD1 (blue, cocktail with Bcl6); ( E ) human lymph node, IgD (red, without retrieval), followed by Bcl6/PD1 (brown and blue, respectively, after 5 min high pressure cooking). ( F ) immunofluorescence in human tonsil: LAMP1 (488 green, after 15 min TRIS pH 9 retrieval), ADA2 (555 red, after 20 min TRIS pH 6.1 retrieval), nuclear counterstain with DAPI (blue fluorescence).
- Submitted by
- Invitrogen Antibodies (provider)
- Main image
- Experimental details
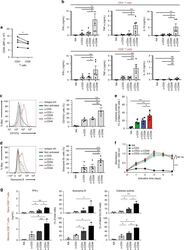
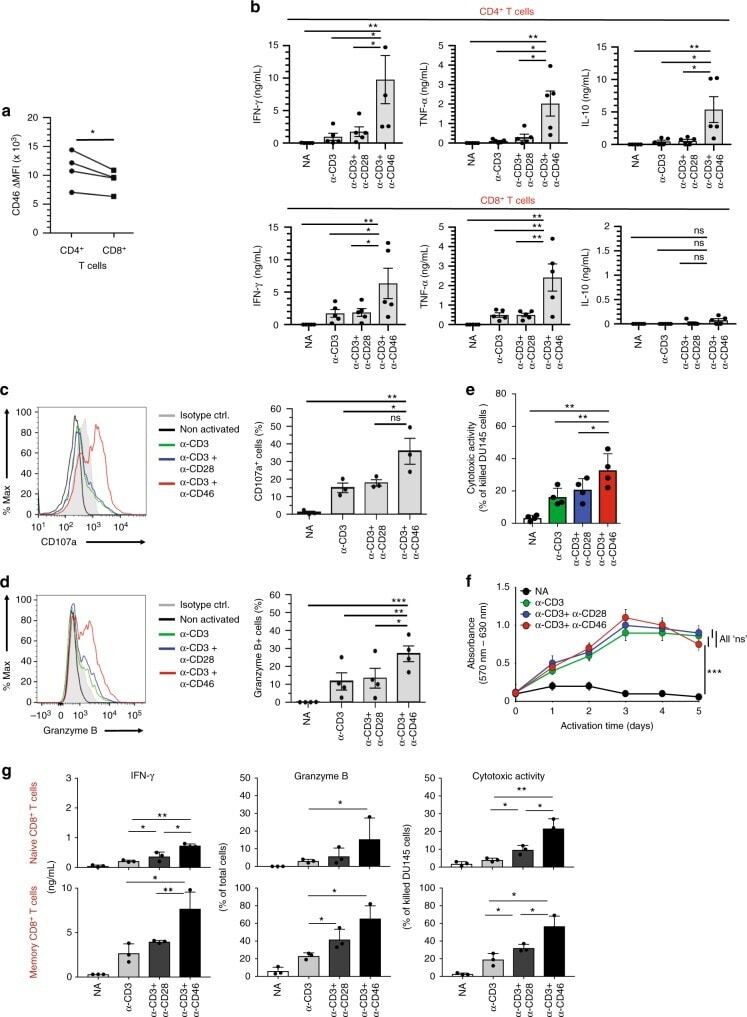
- Fig. 1 CD46 co-stimulation provides superior support for CTL activity. a CD46 expression on the surface of resting human CD4 + and CD8 + T cells assessed by FACS analysis ( n = 4, gating strategy in Supplementary Fig. 7a ). b Comparison of IFN-gamma, TNF-alpha and IL-10 secretion by CD3 + CD46-activated T cells. Purified CD4 + and CD8 + T cells from healthy donors were left non-activated (NA) or stimulated with immobilized antibodies to CD3, CD3 + CD28 or CD3 + CD46 and cytokines measured 60 h post activation ( n = 5). c, d Degranulation (CD107a staining, ( c )) and granzyme B expression ( d ) by CD8 + T cells upon CD46 co-stimulation. CD8 + T cells were stimulated as in ( a ) and CD107a and granzyme B expression assessed with left panels showing representative cytometry images and right panels corresponding quantifications ( n = 3, gating strategy in Supplementary Fig. 7b ). e Killing activity of CD46-activated CD8 + T cells. T cells were stimulated as depicted for 24 h and cytotoxic activity of differently activated CD8 + T cells towards DU145 target cells assessed 24 h post co-culture of T cells and DU145 cells ( n = 4, gating strategy in Supplementary Fig. 7c ). f Effect of CD46 co-stimulation on CD8 + T-cell proliferation. Purified T cells were activated as indicated for 5 days and cell proliferation measured each day ( n = 4) (black circles, non-activated cells; green, blue, and red circles, CD3, CD3 + CD28 or CD3 + CD46-activated cells, res
- Submitted by
- Invitrogen Antibodies (provider)
- Main image

- Experimental details
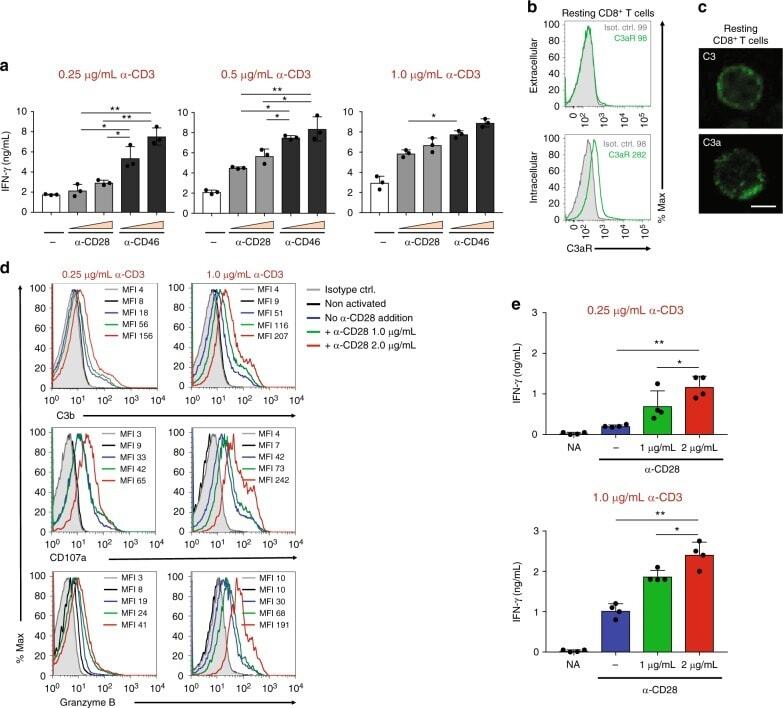
- Fig. 2 Autocrine CD46 engagement supports CTL activation. a Comparison of effects of TCR stimulation as well as CD28 and CD46 co-stimulation on IFN-gamma secretion by CTLs. Purified CD8 + T cells were activated with the depicted antibody combinations (for CD28 and CD46 either 1 mug/mL or 2 mug/mL at all tested CD3 stimulation conditions) for 60 h and IFN-gamma secretion measured ( n = 3). b , c Extracellular and intracellular C3aR, C3, and C3a presence in resting human CD8 + T cells. Freshly purified CD8 + T cells were either left non-permeabilized or were permeabilized and stained with antibodies to the C3aR, to C3 and C3a and evaluated by FACS ( b ) or confocal microscopy ( c , scale bar = 7 mum) for presence and localization of the respective antigens (data shown are one representative of n = 3). d , e Effects of increasing TCR and CD28 activation on C3b generation, CD107a and granzyme B expression and cytokine secretion. CD8 + T cells were left non-activated (NA) or activated with the depicted antibody combinations and C3b surface presence, CD107a and granzyme B positivity ( d , shows a representative FACS analysis of two similarly performed experiments; gray histograms, isotype controls; black histograms, non-activated cells; blue histograms, no CD28 stimulation; green and red histograms, addition of 1 or 2 mug/mL alpha-CD28, respectively) and IFN-gamma production ( e ) measured at 12 h post activation ( n = 3). The gating strategy for CD8 + T cells flow
- Submitted by
- Invitrogen Antibodies (provider)
- Main image
- Experimental details
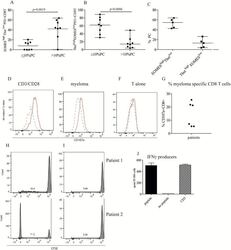
- Figure 3 High tumor load is associated with increased number of CD8+EOMES high T bet low cells (A, B, C) Frequency of EOMES high Tbet low of PD1+CD8+ T cells. Bone marrow cells were surface stained with anti CD3, CD4, CD8 and PD1 followed by intranuclear staining with anti-Tbet and anti-EOMES, or isotype controls ( Supplementary Figure 4A ). Gates were set on isotype controls. Figure shows % EOMES high Tbet low (A) and Tbet high EOMES low (B) of PD1+CD8+ T cells in patients with low plasma cell percentage (10 % PC). (C) % EOMES high Tbet low and Tbet high EOMES low of PD1 expressing CD8 T cells in patients with high tumor load of 40% and above. (D-G) Cytotoxic activity against autologous myeloma cells. Purified CD8+ T cells from the bone marrow of patients were co-cultured with anti CD3/CD28 beads (D) or purified, autologous myeloma cells (E) or the T cells alone (F). For the last 4 hours of the culture period, anti CD8, PD1 and CD107a or isotype controls were added as described in the Materials and Method section. Figures show the staining of isotype control (dashed lines) and CD107a (solid lines) on one representative sample of three positive ( Supplementary Figure 4C ). (G) Pooled data for cytotoxic activity (% CD107a expression) of CD8+ T cells co-cultured with autologous myeloma cells. (H, I) Proliferation of CD8+PD1+ T cells in response to autologous APCs. CFSE labeled CD3+PD1+ cells from the bone marrow of two myelo

- Submitted by
- Invitrogen Antibodies (provider)
- Main image
- Experimental details
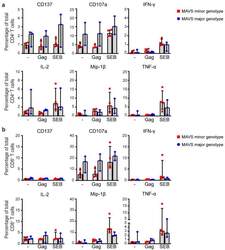
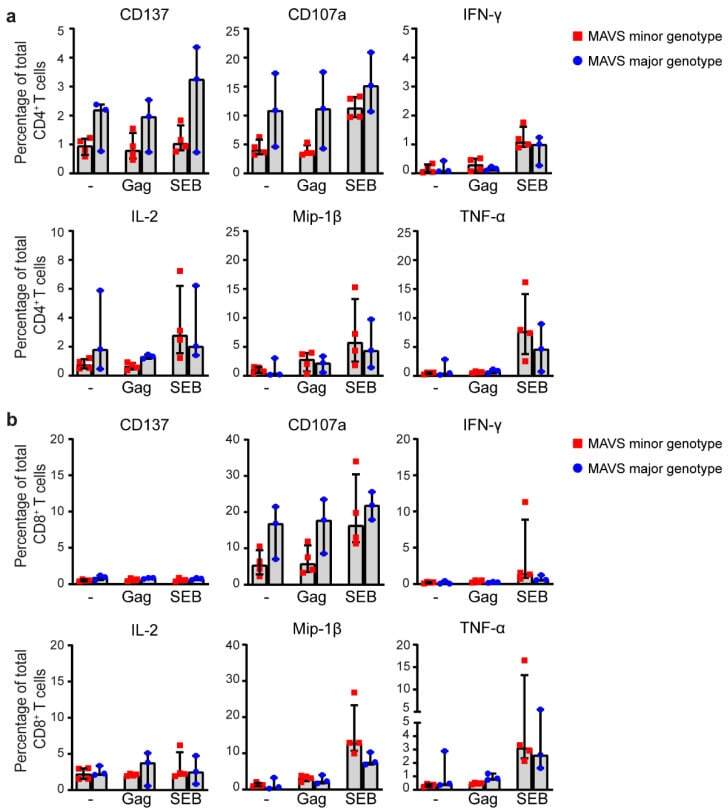
- Figure 5 MAVS genetic variation does not affect intracellular cytokine levels of HIV-1-specific T cells. ( a ) PBMCs of individuals carrying a MAVS minor or MAVS major genotype obtained 2.5-3.5 years p.SC were left unstimulated (-), or were treated with HIV-1 consensus B Gag peptide pool (Gag) or staphylococcal enterotoxin B (SEB). After 6 h, the percentages of surface molecules expressing CD137 + and CD107a + and intracellular expression of IFN-gamma + , IL-2 + , Mip-1beta + , and TNF-alpha + CD4 + T cells and ( b ) CD8 + T cells were analyzed using flow cytometry. Each square or dot represents a different study participant (median +- IQR). No significant differences between HIV-1-infected individuals with a MAVS minor or MAVS major genotype were observed.
- Submitted by
- Invitrogen Antibodies (provider)
- Main image

- Experimental details
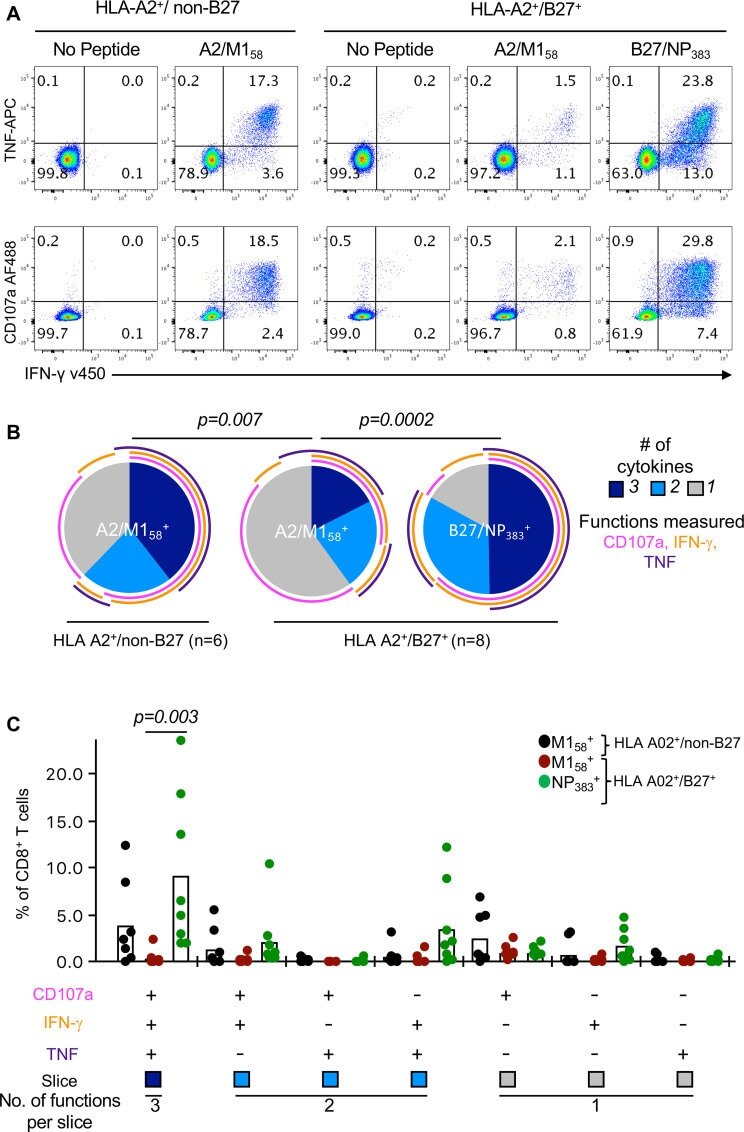
- Fig 4 Diminished polyfunctionality of A2/M158+CD8 + T cells in HLA-A2 + /B27 + individuals. ( A ) Representative FACS plots of CD107a, IFN-gamma and TNF responses of day 10 peptide-expanded CD8 + T cell lines from HLA-A2 + /non-B27 and HLA-A2 + /B27 + donors. ( B ) Pie charts representing the average fractions of expanded CD8 + T cells expressing different combinations of CD107a, IFN-gamma and TNF were generated using Pestle v1.8 and SPICE v5.35 software. Arcs represent average frequency of individual cytokines. Exact p -values are calculated using Spice permutation test (10,000) replicates. ( C ) Frequencies of the CD8 + T cell functional response producing different combinations of CD107a, IFN-gamma and TNF. Data (mean+-SEM) are pooled from blood and spleen donors over 2-3 independent experiments (n = 7-8). For each cytokine combination, statistically significant exact p -values are shown for each response ( p