Explore
 Validate
 Learn
Learn Western blot
 Immunocytochemistry
Antibody data
- Antibody Data
- Antigen structure
- References [11]
- Comments [0]
- Validations
- Immunocytochemistry [3]
- Immunohistochemistry [8]
- Flow cytometry [2]
- Other assay [13]
Submit
Validation data
Reference
Comment
Report error
- Product number
- MA5-27726 - Provider product page

- Provider
- Invitrogen Antibodies
- Product name
- IBA1 Monoclonal Antibody (GT10312)
- Antibody type
- Monoclonal
- Antigen
- Recombinant full-length protein
- Description
- Positive Control: THP-1, HL-60 Predicted Reactivity: Pig (93%), Rhesus Monkey (99%), Bovine (88%) Store as concentrated solution. Centrifuge briefly prior to opening vial. For short-term storage (1-2 weeks), store at 4ºC. For long-term storage, aliquot and store at -20ºC or below. Avoid multiple freeze-thaw cycles.
- Reactivity
- Human, Mouse, Rat
- Host
- Mouse
- Isotype
- IgG
- Antibody clone number
- GT10312
- Vial size
- 100 μL
- Concentration
- 1 mg/mL
- Storage
- Store at 4°C short term. For long term storage, store at -20°C, avoiding freeze/thaw cycles.
Submitted references Sevoflurane Aggravates the Progress of Alzheimer's Disease Through NLRP3/Caspase-1/Gasdermin D Pathway.
PD-L1 Improves Motor Function and Alleviates Neuropathic Pain in Male Mice After Spinal Cord Injury by Inhibiting MAPK Pathway.
Sex differences in the expression of the endocannabinoid system within V1M cortex and PAG of Sprague Dawley rats.
Annexin A1 protects against cerebral ischemia-reperfusion injury by modulating microglia/macrophage polarization via FPR2/ALX-dependent AMPK-mTOR pathway.
NLRP3 inhibition attenuates early brain injury and delayed cerebral vasospasm after subarachnoid hemorrhage.
Microglia-like Cells Promote Neuronal Functions in Cerebral Organoids.
Inhibition of Bruton Tyrosine Kinase Reduces Neuroimmune Cascade and Promotes Recovery after Spinal Cord Injury.
Osteopontin/secreted phosphoprotein-1 behaves as a molecular brake regulating the neuroinflammatory response to chronic viral infection.
Nanotherapeutic Modulation of Human Neural Cells and Glioblastoma in Organoids and Monocultures.
Oral P. gingivalis impairs gut permeability and mediates immune responses associated with neurodegeneration in LRRK2 R1441G mice.
SIRT1 Mediates Melatonin's Effects on Microglial Activation in Hypoxia: In Vitro and In Vivo Evidence.
Tian D, Xing Y, Gao W, Zhang H, Song Y, Tian Y, Dai Z
Frontiers in cell and developmental biology 2021;9:801422
Frontiers in cell and developmental biology 2021;9:801422
PD-L1 Improves Motor Function and Alleviates Neuropathic Pain in Male Mice After Spinal Cord Injury by Inhibiting MAPK Pathway.
Kong F, Sun K, Zhu J, Li F, Lin F, Sun X, Luo X, Ren C, Lu L, Zhao S, Sun J, Wang Y, Shi J
Frontiers in immunology 2021;12:670646
Frontiers in immunology 2021;12:670646
Sex differences in the expression of the endocannabinoid system within V1M cortex and PAG of Sprague Dawley rats.
Levine A, Liktor-Busa E, Lipinski AA, Couture S, Balasubramanian S, Aicher SA, Langlais PR, Vanderah TW, Largent-Milnes TM
Biology of sex differences 2021 Nov 8;12(1):60
Biology of sex differences 2021 Nov 8;12(1):60
Annexin A1 protects against cerebral ischemia-reperfusion injury by modulating microglia/macrophage polarization via FPR2/ALX-dependent AMPK-mTOR pathway.
Xu X, Gao W, Li L, Hao J, Yang B, Wang T, Li L, Bai X, Li F, Ren H, Zhang M, Zhang L, Wang J, Wang D, Zhang J, Jiao L
Journal of neuroinflammation 2021 May 22;18(1):119
Journal of neuroinflammation 2021 May 22;18(1):119
NLRP3 inhibition attenuates early brain injury and delayed cerebral vasospasm after subarachnoid hemorrhage.
Dodd WS, Noda I, Martinez M, Hosaka K, Hoh BL
Journal of neuroinflammation 2021 Jul 20;18(1):163
Journal of neuroinflammation 2021 Jul 20;18(1):163
Microglia-like Cells Promote Neuronal Functions in Cerebral Organoids.
Fagerlund I, Dougalis A, Shakirzyanova A, Gómez-Budia M, Pelkonen A, Konttinen H, Ohtonen S, Fazaludeen MF, Koskuvi M, Kuusisto J, Hernández D, Pebay A, Koistinaho J, Rauramaa T, Lehtonen Š, Korhonen P, Malm T
Cells 2021 Dec 30;11(1)
Cells 2021 Dec 30;11(1)
Inhibition of Bruton Tyrosine Kinase Reduces Neuroimmune Cascade and Promotes Recovery after Spinal Cord Injury.
Yu CG, Bondada V, Iqbal H, Moore KL, Gensel JC, Bondada S, Geddes JW
International journal of molecular sciences 2021 Dec 29;23(1)
International journal of molecular sciences 2021 Dec 29;23(1)
Osteopontin/secreted phosphoprotein-1 behaves as a molecular brake regulating the neuroinflammatory response to chronic viral infection.
Mahmud FJ, Du Y, Greif E, Boucher T, Dannals RF, Mathews WB, Pomper MG, Sysa-Shah P, Metcalf Pate KA, Lyons C, Carlson B, Chacona M, Brown AM
Journal of neuroinflammation 2020 Sep 17;17(1):273
Journal of neuroinflammation 2020 Sep 17;17(1):273
Nanotherapeutic Modulation of Human Neural Cells and Glioblastoma in Organoids and Monocultures.
Zhang I, Lépine P, Han C, Lacalle-Aurioles M, Chen CX, Haag R, Durcan TM, Maysinger D
Cells 2020 Nov 7;9(11)
Cells 2020 Nov 7;9(11)
Oral P. gingivalis impairs gut permeability and mediates immune responses associated with neurodegeneration in LRRK2 R1441G mice.
Feng YK, Wu QL, Peng YW, Liang FY, You HJ, Feng YW, Li G, Li XJ, Liu SH, Li YC, Zhang Y, Pei Z
Journal of neuroinflammation 2020 Nov 19;17(1):347
Journal of neuroinflammation 2020 Nov 19;17(1):347
SIRT1 Mediates Melatonin's Effects on Microglial Activation in Hypoxia: In Vitro and In Vivo Evidence.
Merlo S, Luaces JP, Spampinato SF, Toro-Urrego N, Caruso GI, D'Amico F, Capani F, Sortino MA
Biomolecules 2020 Feb 27;10(3)
Biomolecules 2020 Feb 27;10(3)
No comments: Submit comment
Supportive validation
- Submitted by
- Invitrogen Antibodies (provider)
- Main image
- Experimental details
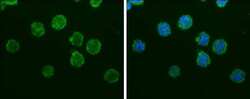
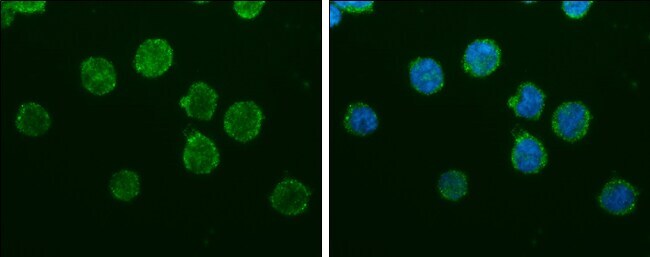
- IBA1 Monoclonal Antibody (GT10312) detects Iba1 protein at cytoplasm by immunofluorescent analysis. Sample: THP-1 cells were fixed in 4% paraformaldehyde at RT for 15 min. Green: Iba1 protein stained by IBA1 Monoclonal Antibody (GT10312) (Product # MA5-27726) diluted at 1:200. Blue: Hoechst 33342 staining.
- Submitted by
- Invitrogen Antibodies (provider)
- Main image
- Experimental details
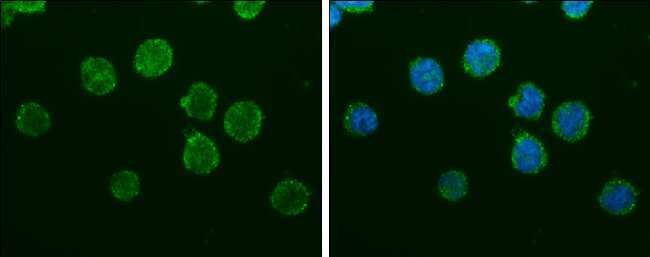
- IBA1 Monoclonal Antibody (GT10312) detects Iba1 protein at cytoplasm by immunofluorescent analysis. Sample: THP-1 cells were fixed in 4% paraformaldehyde at RT for 15 min. Green: Iba1 protein stained by IBA1 Monoclonal Antibody (GT10312) (Product # MA5-27726) diluted at 1:200. Blue: Hoechst 33342 staining.
- Submitted by
- Invitrogen Antibodies (provider)
- Main image

- Experimental details
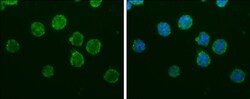
- IBA1 Monoclonal Antibody (GT10312) detects Iba1 protein at cytoplasm by immunofluorescent analysis. Sample: THP-1 cells were fixed in 4% paraformaldehyde at RT for 15 min. Green: Iba1 protein stained by IBA1 Monoclonal Antibody (GT10312) (Product # MA5-27726) diluted at 1:200. Blue: Hoechst 33342 staining.

Supportive validation
- Submitted by
- Invitrogen Antibodies (provider)
- Main image
- Experimental details
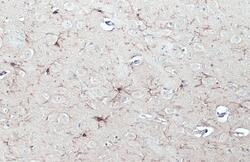
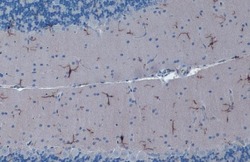
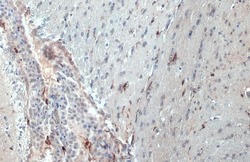
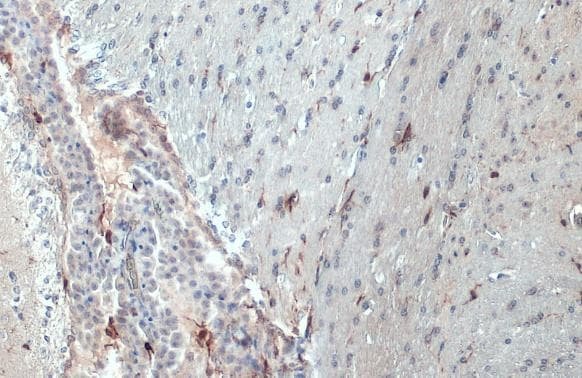
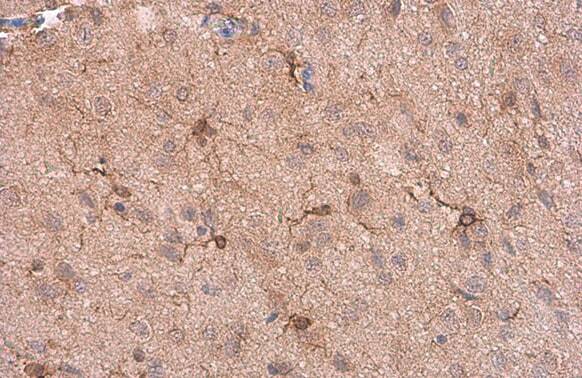
- IBA1 Monoclonal Antibody (GT10312) detects Iba1 protein at cell membrane and cytoplasm by immunohistochemical analysis. Sample: Paraffin-embedded rat brain. Iba1 stained by IBA1 Monoclonal Antibody (GT10312) (Product # MA5-27726) diluted at 1:200. Antigen Retrieval: Citrate.
- Submitted by
- Invitrogen Antibodies (provider)
- Main image
- Experimental details
- IBA1 Monoclonal Antibody (GT10312) detects Iba1 protein at cytoplasm by immunohistochemical analysis. Sample: Paraffin-embedded mouse cerebellum. Iba1 stained by IBA1 Monoclonal Antibody (GT10312) (Product # MA5-27726) diluted at 1:1,000. Antigen Retrieval: Citrate buffer, pH 6.0, 15 min.
- Submitted by
- Invitrogen Antibodies (provider)
- Main image
- Experimental details
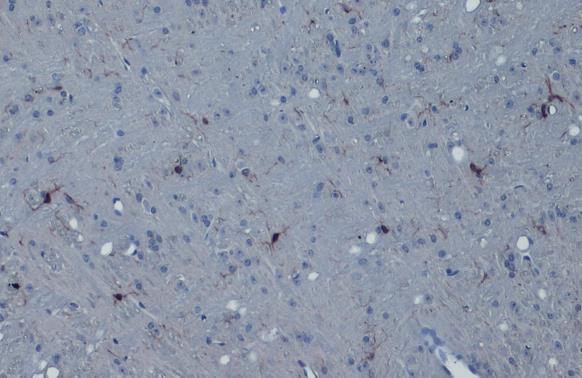
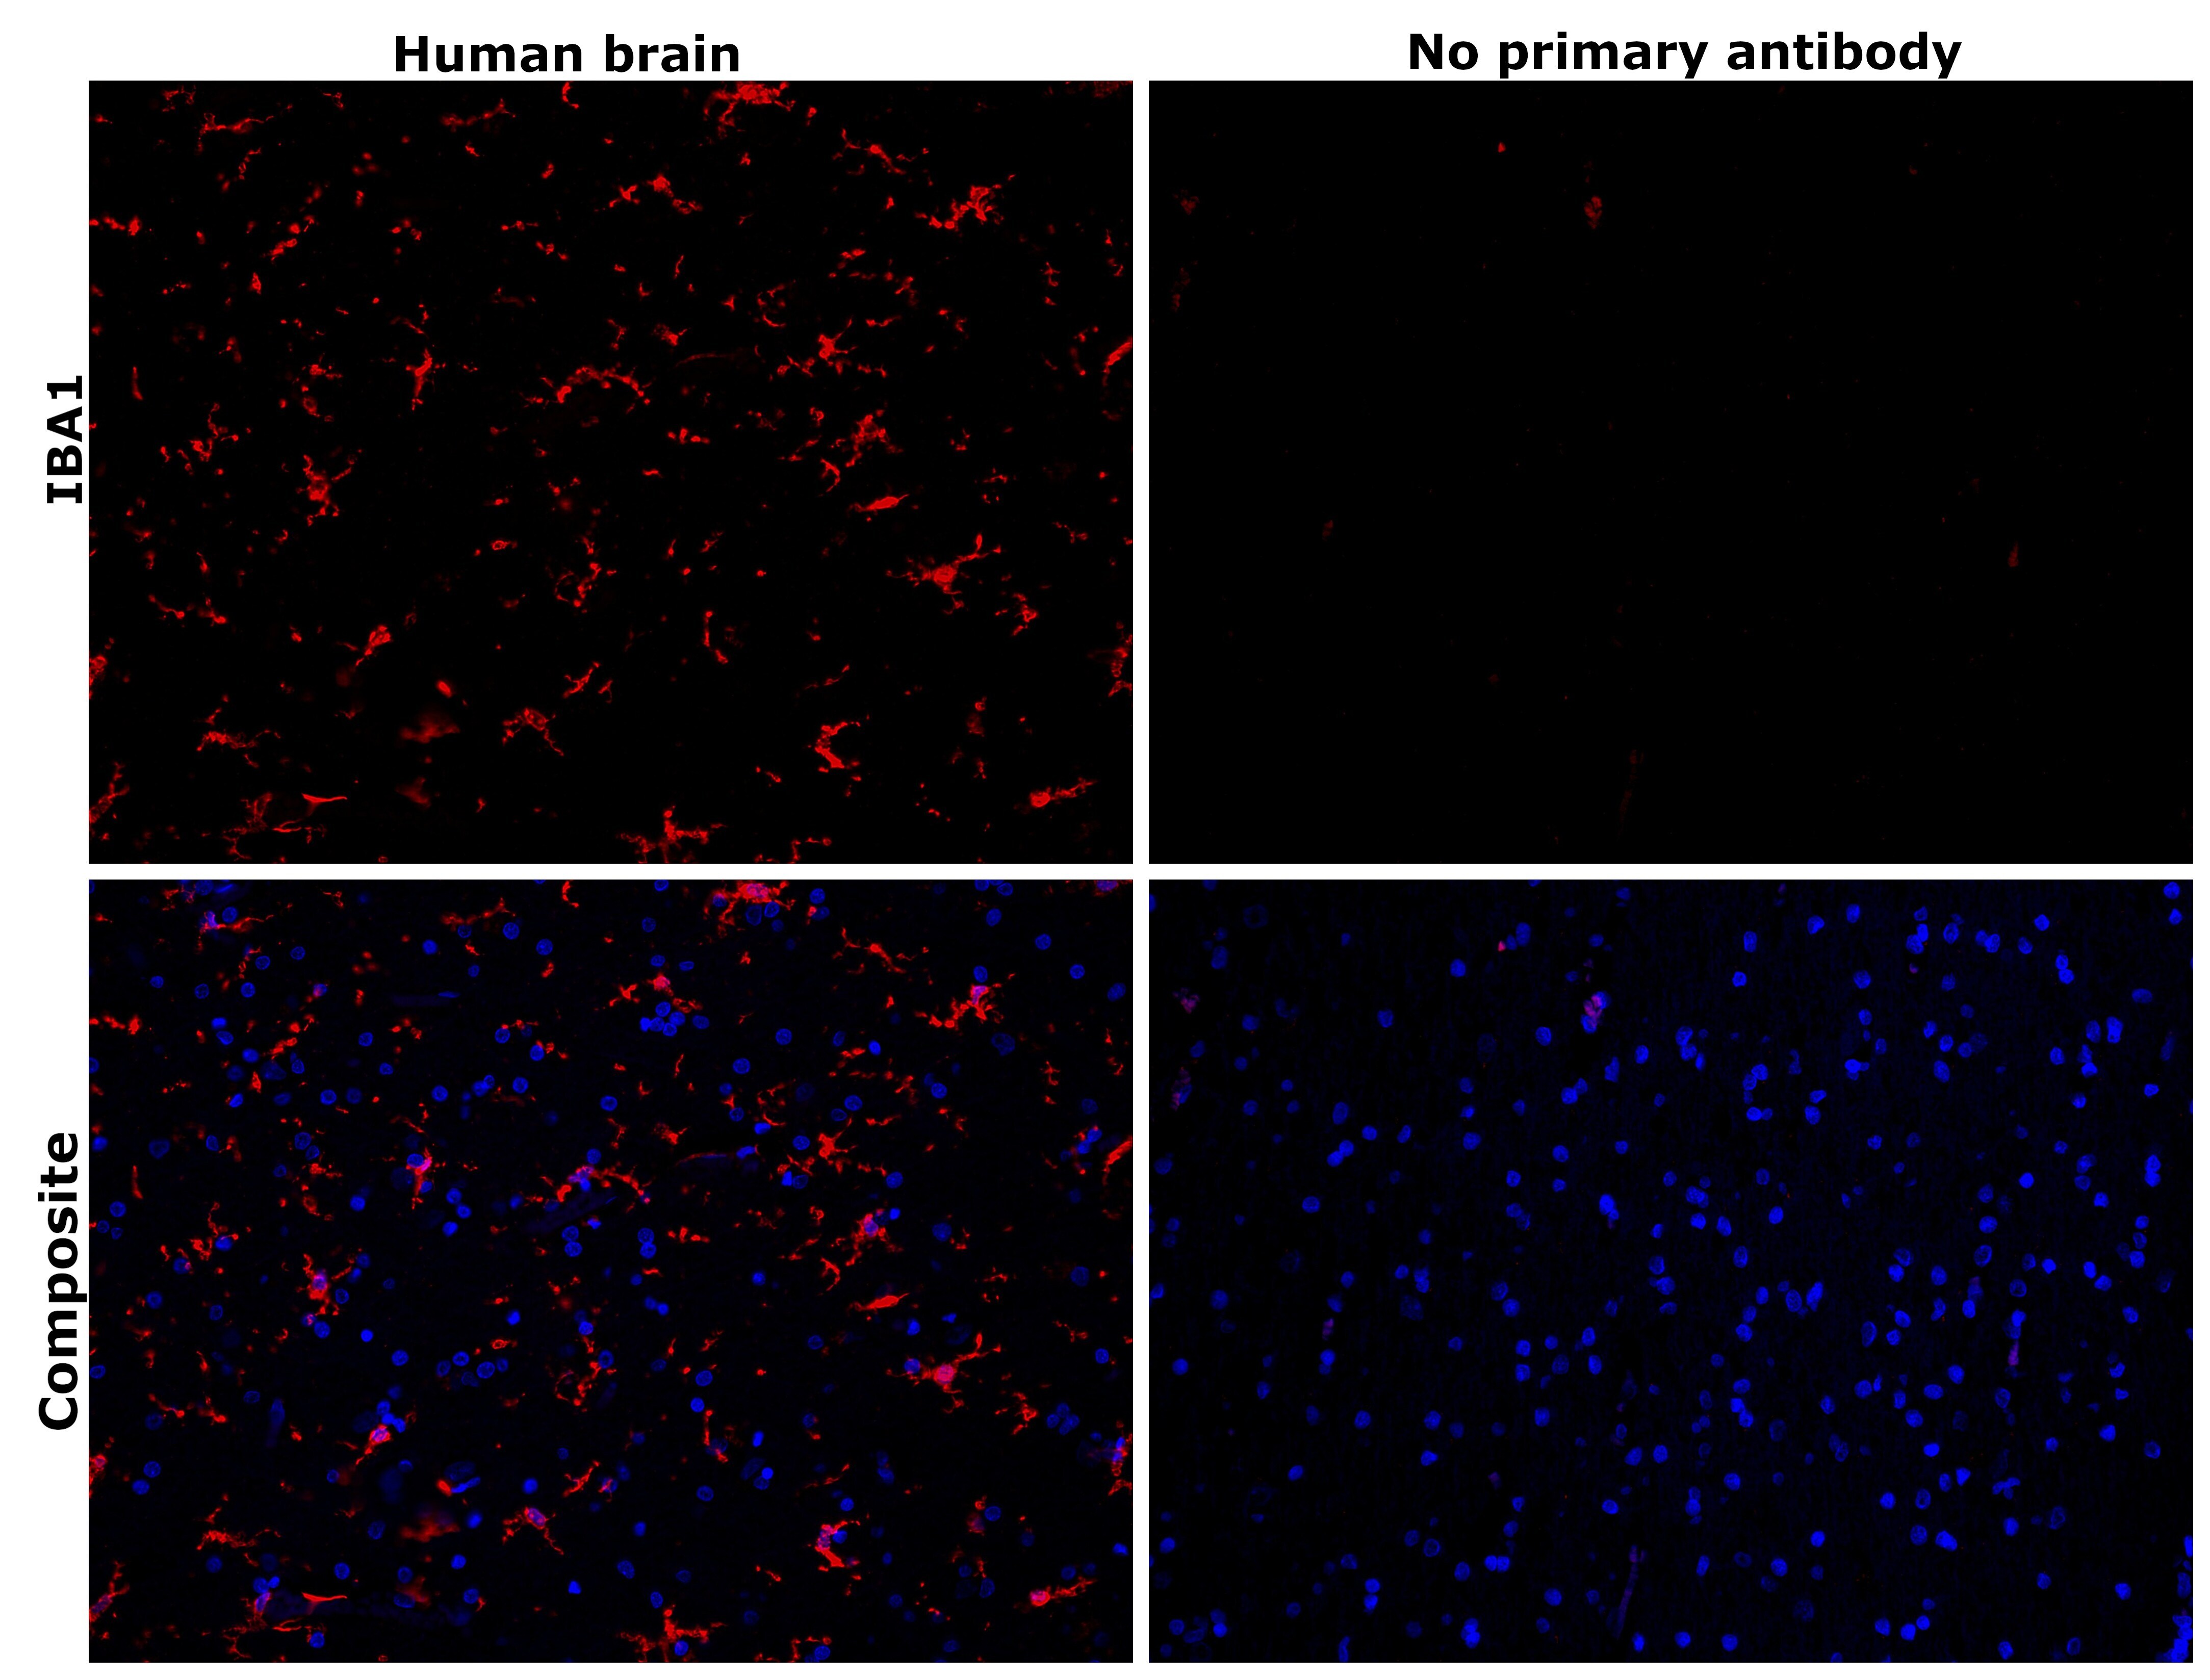
- Immunohistochemical analysis of IBA1 was performed using formalin-fixed paraffin-embedded human brain tissue sections. To expose the target protein, heat-induced epitope retrieval was performed on de-paraffinized sections using eBioscience™ IHC Antigen Retrieval Solution - Low pH (10X) (Product # 00-4955-58) diluted to 1X solution in water in a decloaking chamber at 110 degree Celsius for 15 minutes. Following antigen retrieval, the sections were blocked with 3% H2O2 for 1 hour at room temperature followed by 2% normal goat serum in 1X PBS for 45 minutes at room temperature and then probed with or without IBA1 Monoclonal Antibody (GT10312) (Product # MA5-27726) at 1:500 dilution in 0.1% normal goat serum overnight at 4 degree Celsius in a humidified chamber. Detection was performed using Alexa Fluor™ 594 Tyramide SuperBoost™ Kit, goat anti-mouse IgG (Product # B40915). Nuclei were stained with DAPI (Product # D1306) and the sections were mounted using ProLong™ Glass Antifade Mountant (Product # P36984). The images were captured on EVOS™ M7000 Imaging System (Product # AMF7000) at 20X magnification and externally deconvoluted.
- Submitted by
- Invitrogen Antibodies (provider)
- Main image
- Experimental details
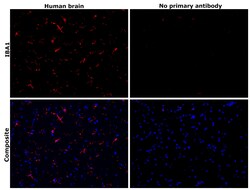
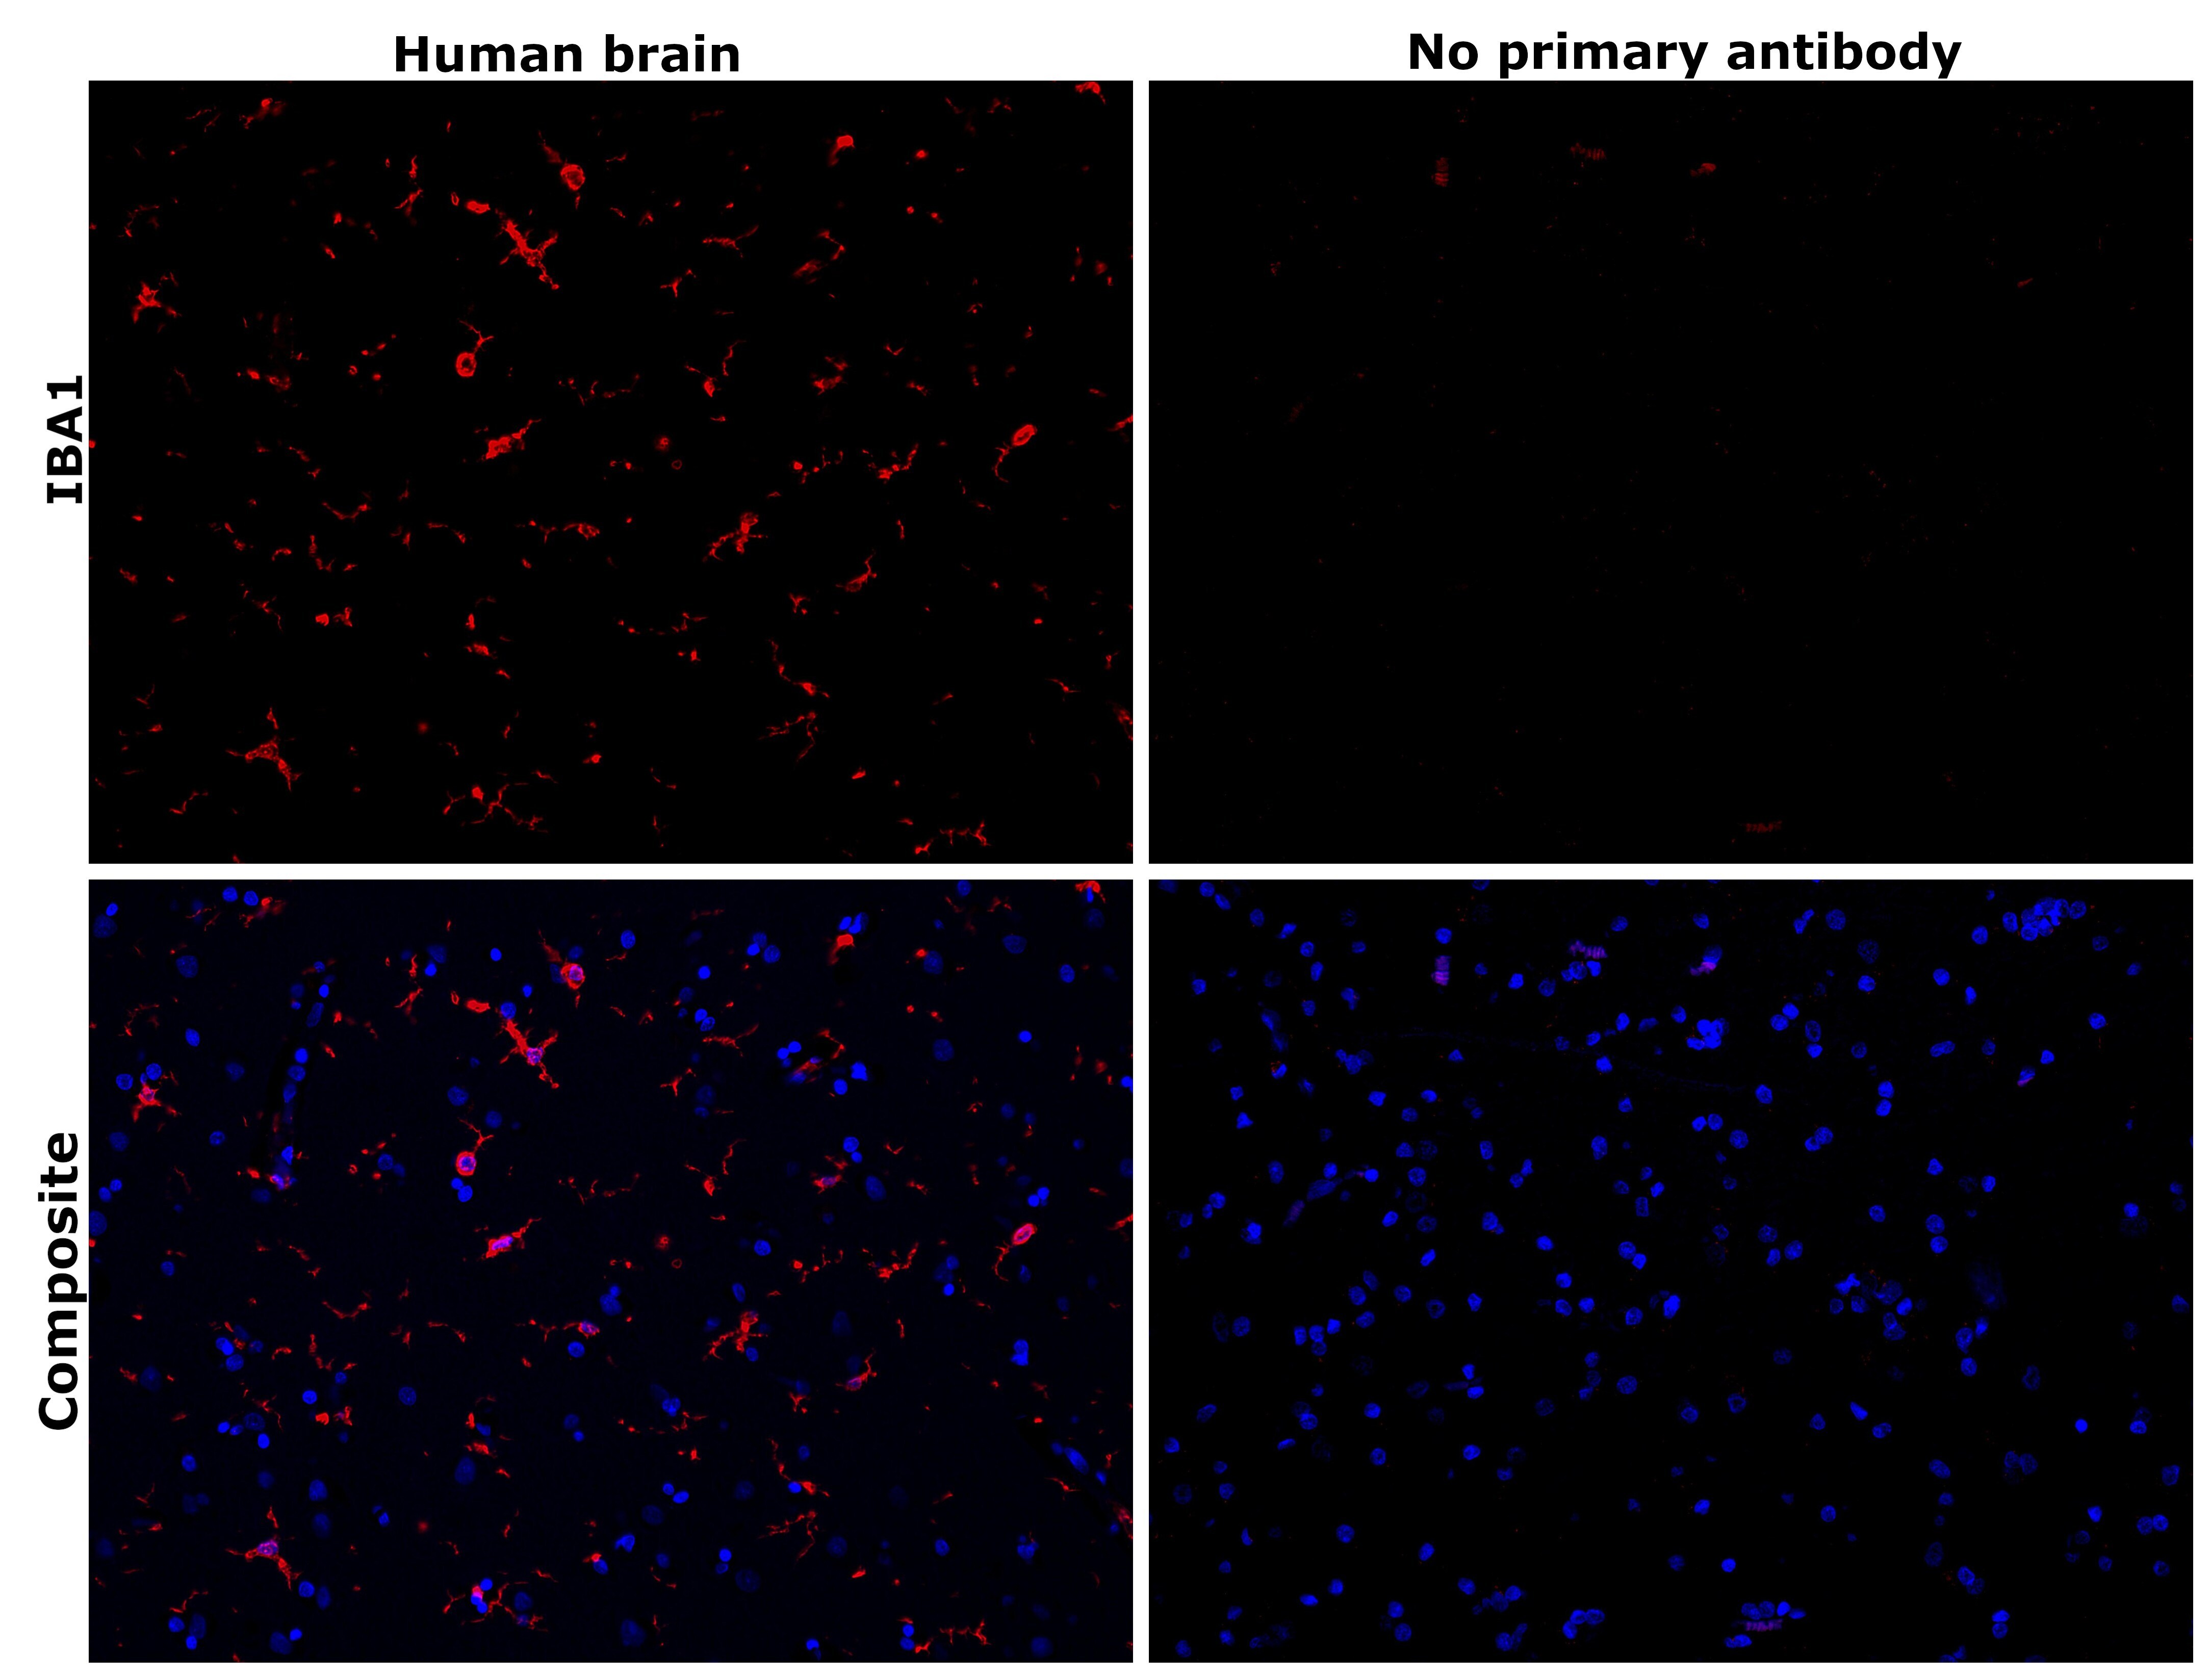
- Immunohistochemical analysis of IBA1 was performed using formalin-fixed paraffin-embedded human brain tissue sections. To expose the target protein, heat-induced epitope retrieval was performed on de-paraffinized sections using eBioscience™ IHC Antigen Retrieval Solution - High pH (10X) (Product # 00-4956-58) diluted to 1X solution in water in a decloaking chamber at 110 degree Celsius for 15 minutes. Following antigen retrieval, the sections were blocked with 3% H2O2 for 1 hour at room temperature followed by 2% normal goat serum in 1X PBS for 45 minutes at room temperature and then probed with or without IBA1 Monoclonal Antibody (GT10312) (Product # MA5-27726) at 1:500 dilution in 0.1% normal goat serum overnight at 4 degree Celsius in a humidified chamber. Detection was performed using Alexa Fluor™ 594 Tyramide SuperBoost™ Kit, goat anti-mouse IgG (Product # B40915). Nuclei were stained with DAPI (Product # D1306) and the sections were mounted using ProLong™ Glass Antifade Mountant (Product # P36984). The images were captured on EVOS™ M7000 Imaging System (Product # AMF7000) at 20X magnification and externally deconvoluted.
- Submitted by
- Invitrogen Antibodies (provider)
- Main image
- Experimental details
- IBA1 Monoclonal Antibody (GT10312) detects Iba1 protein at cytoplasm by immunohistochemical analysis. Sample: Paraffin-embedded rat cerebellum. Iba1 stained by IBA1 Monoclonal Antibody (GT10312) (Product # MA5-27726) diluted at 1:1,000. Antigen Retrieval: Citrate buffer, pH 6.0, 15 min.

- Submitted by
- Invitrogen Antibodies (provider)
- Main image
- Experimental details
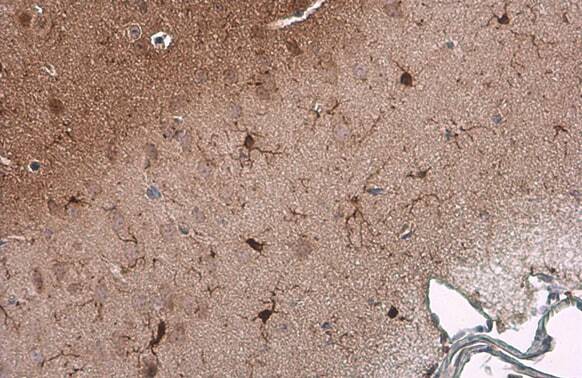
- IBA1 Monoclonal Antibody (GT10312) detects Iba1 protein at cell membrane and cytoplasm by immunohistochemical analysis. Sample: Paraffin-embedded mouse brain. Iba1 stained by IBA1 Monoclonal Antibody (GT10312) (Product # MA5-27726) diluted at 1:200. Antigen Retrieval: Citrate buffer, pH 6.0, 15 min.
- Submitted by
- Invitrogen Antibodies (provider)
- Main image
- Experimental details
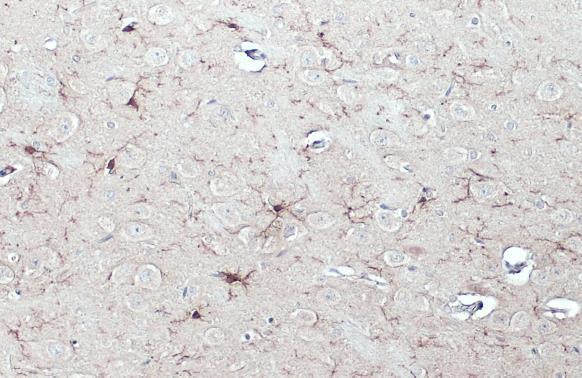
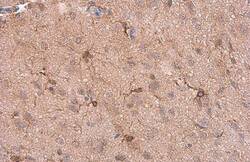
- Immunohistochemistry (Paraffin) analysis of IBA1 was performed in paraffin-embedded rat brain tissue using IBA1 Monoclonal Antibody (GT10312) (Product # MA5-27726) at a dilution of 1:200. Antigen Retrieval: Citrate buffer, pH 6.0, 15 min.
- Submitted by
- Invitrogen Antibodies (provider)
- Main image
- Experimental details
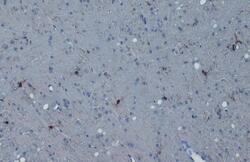
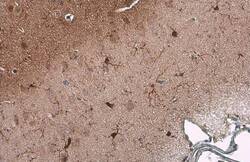
- Immunohistochemistry (Paraffin) analysis of IBA1 was performed in paraffin-embedded mouse brain tissue using IBA1 Monoclonal Antibody (GT10312) (Product # MA5-27726) at a dilution of 1:200. Antigen Retrieval: Citrate buffer, pH 6.0, 15 min.
Supportive validation
- Submitted by
- Invitrogen Antibodies (provider)
- Main image

- Experimental details
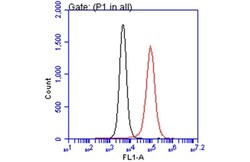
- Flow Cytometry analysis of TLR7 was performed in THP-1 cells using TLR7 Polyclonal Antibody (Product # PA1-28109) (red) at a dilution of 1:50. Black: Unlabelled sample was used as a control. Acquisition of 20,000 events were collected using a Dylight 488-conjugated secondary antibody for FACS analysis.

- Submitted by
- Invitrogen Antibodies (provider)
- Main image
- Experimental details
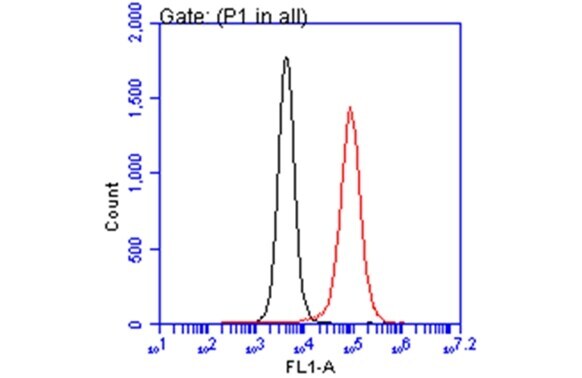
- Flow Cytometry analysis of TLR7 was performed in THP-1 cells using TLR7 Polyclonal Antibody (Product # PA1-28109) (red) at a dilution of 1:50. Black: Unlabelled sample was used as a control. Acquisition of 20,000 events were collected using a Dylight 488-conjugated secondary antibody for FACS analysis.
Supportive validation
- Submitted by
- Invitrogen Antibodies (provider)
- Main image
- Experimental details
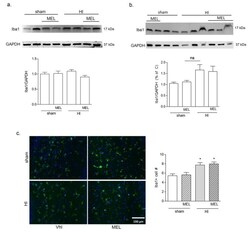
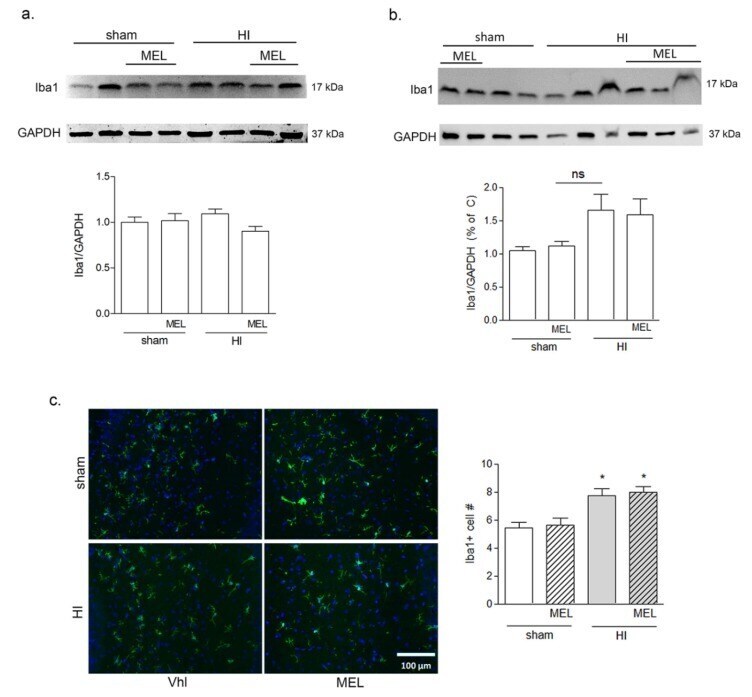
- Figure 8 Melatonin does not affect Iba1+ cell number in rats subjected to CCAO. Seven-day-old rats were subjected to sham surgery or to ligation of the right carotid artery followed by hypoxia. Melatonin-treated groups were subsequently injected with melatonin (10 mg/kg) and sacrificed after 24 h. Iba1 expression in ipsilateral cortical ( a ) and hippocampal ( b ) protein extracts was evaluated by Western blot analysis. Microglia were labeled by immunohistochemical staining of Iba1 (green, c ) with DAPI nuclear counterstaining (blue, c ). Double positive Iba1+/DAPI+ cells were counted in the CA1 area of the hippocampus (HC; graph in c ). Bars are mean +- SEM of at least three animals/group. * p < 0.05 vs. sham by one-way ANOVA followed by Newman-Keuls test for statistical significance. Representative images of blots and of ipsilateral HC are shown. Scale bar = 100 mum.
- Submitted by
- Invitrogen Antibodies (provider)
- Main image
- Experimental details
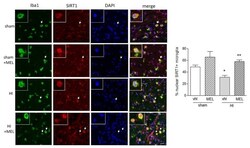
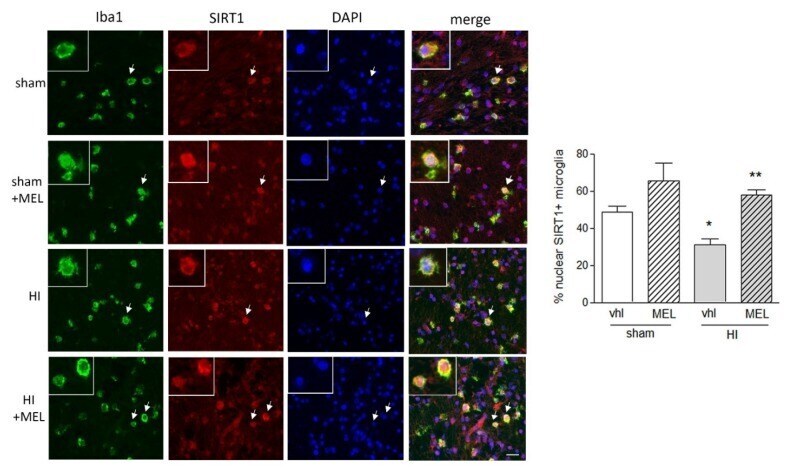
- Figure 9 Melatonin promotes nuclear SIRT1 localization in amoeboid microglia of the corpus callosum in rats subjected to CCAO. Seven-day-old rats were subjected to sham surgery or to ligation of the right carotid artery followed by hypoxia (HI). Melatonin (MEL)-treated groups were subsequently injected with melatonin (10 mg/kg) and sacrificed after 24 h. Double immunohistochemical staining of Iba1 (green) and SIRT1 (red) with DAPI nuclear counterstaining (blue) is shown. The graph reports the percentage of nuclear SIRT1+, Iba1+ microglial cells in the area. Representative images of ipsilateral CC are shown. Insets show magnification of cells indicated by the arrows. Scale bar = 50 mum. Bars are mean +- SEM of at least three animals/group. * p < 0.05 vs. sham and ** p < 0.05 vs. HI by one-way ANOVA followed by Newman-Keuls test for statistical significance.
- Submitted by
- Invitrogen Antibodies (provider)
- Main image
- Experimental details
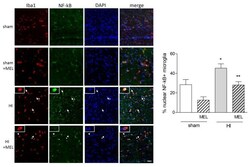
- Figure 10 Melatonin antagonises nuclear NF-kB localization in amoeboid microglia of the corpus callosum in rats subjected to CCAO. Seven-day-old rats were subjected to sham surgery or to ligation of the right carotid artery followed by hypoxia (HI) alone or with subsequent injection of melatonin (10 mg/kg; HI + melatonin (MEL). Animals were sacrificed after 24 h. Double immunohistochemical staining of Iba1 (red) and NF-kB (green) with DAPI nuclear counterstaining (blue) is shown. The graph reports the percentage of nuclear SIRT1+, Iba1+ microglial cells in the area. Representative images of ipsilateral CC are shown. Arrows indicate representative Iba+ cells with nuclear NF-kB; arrowheads indicate representative Iba1+ cells with extranuclear NF-kB staining. Asterisks indicate cells reported in the insets at higher magnification. Scale bar = 40 mum. Bars are mean +- SEM of at least three animals/group. * p < 0.05 vs. sham and ** p < 0.05 vs. HI by one-way ANOVA followed by Newman-Keuls test for statistical significance.

- Submitted by
- Invitrogen Antibodies (provider)
- Main image
- Experimental details
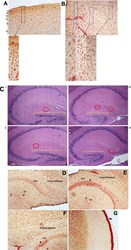
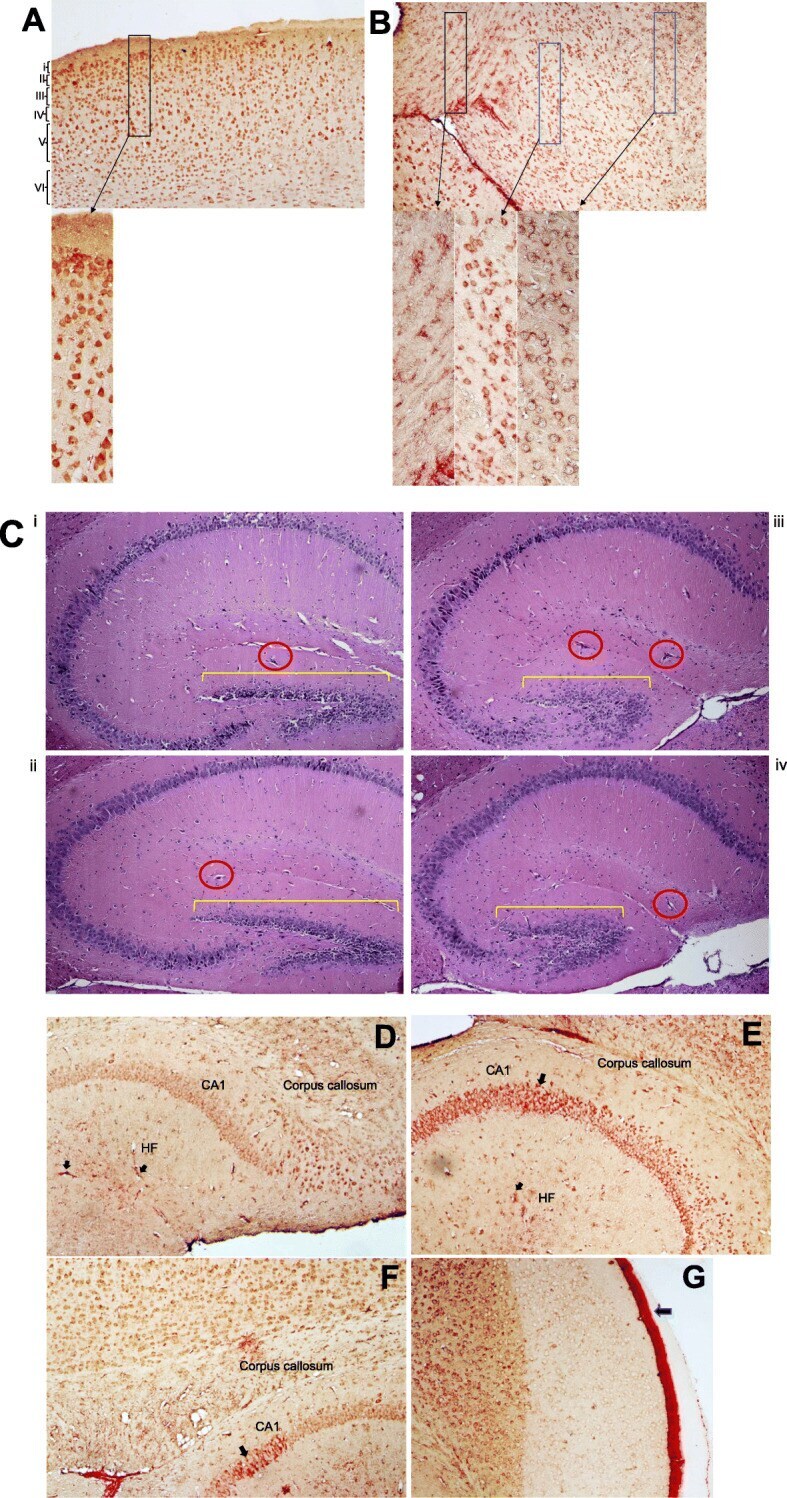
- Fig. 3 TSPO-Iba-1 double label immunoreactivity is abundant in cortical and hippocampal regions. a - f Representative samples of double-label immunostained 5 mum brain sections for TSPO (red) and Iba-1 (brown). a Multiple layers (i-vi) of the cortex can be seen from buffer-OPN + group. b Midbrain region from HIV-OPN + group, showing a diversity of microglia morphologies. c HE-stained hippocampal brain regions (i) Buffer-OPN + , (ii) Buffer-OPN - , (iii) HIV OPN + , (iv) HIV OPN - . Yellow bars, highlight the dentate gyrus and red circles indicate hippocampal fissures. d , e Hippocampus of HIV-OPN - . f Hippocampus in buffer-OPN - . g Meningeal inflammation in HIV OPN +
- Submitted by
- Invitrogen Antibodies (provider)
- Main image

- Experimental details
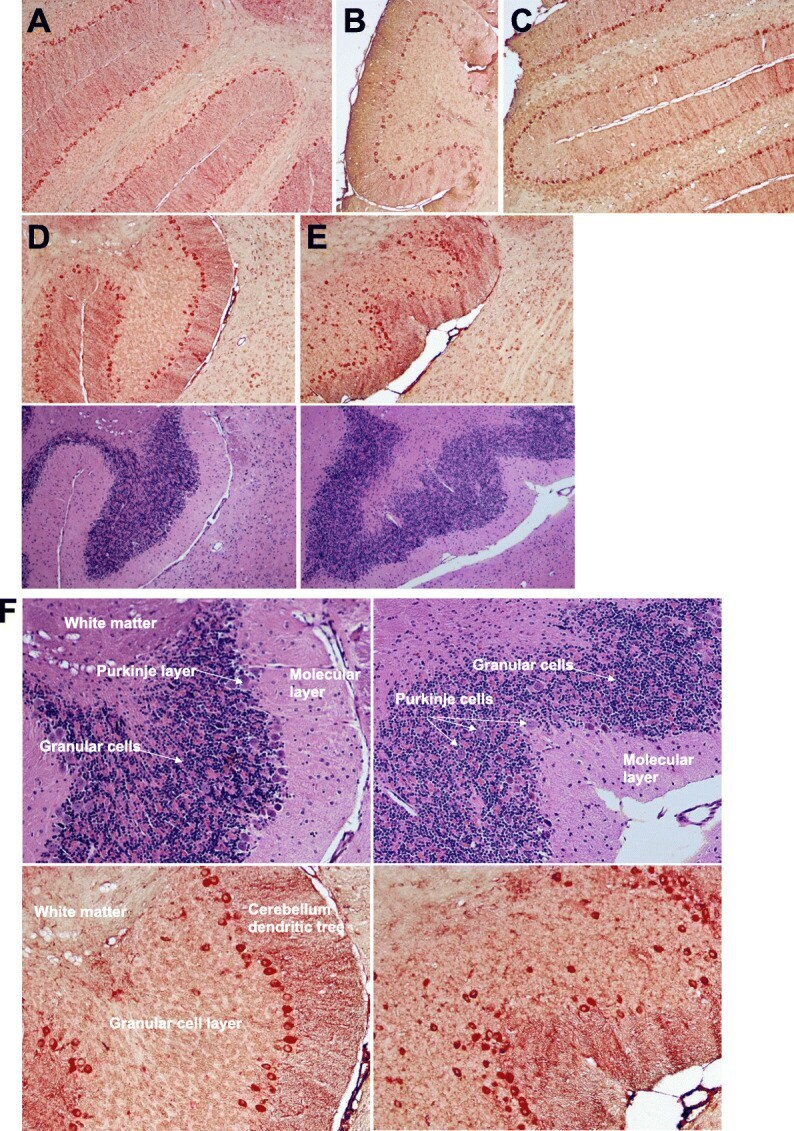
- Fig. 4 Robust TSPO immunoreactivity in a subset of neurons in the cerebellum. a-e Representative samples of double-label immunostained 5 mum brain sections for TSPO (red) and Iba-1 (brown) and their corresponding hematoxylin/eosin near adjacent section are shown a Buffer-OPN + , b HIV-OPN + , c HIV-OPN + , d Buffer-OPN - , and e HIV-OPN - . An ordered array of Purkinje neurons was not visible in HIV-infected mice lacking osteopontin ( e , HIV-OPN - ) compared to d HIV-OPN + . f Enlarged area from d , e is shown with the white matter, Purkinje, granular, and molecular layers of the cerebellum indicated by the arrows
- Submitted by
- Invitrogen Antibodies (provider)
- Main image
- Experimental details
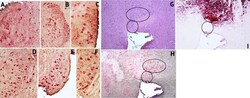
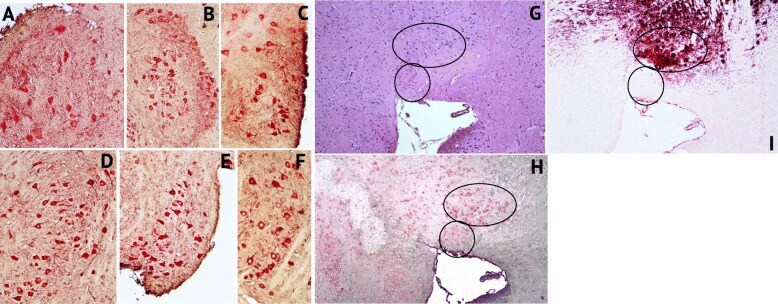
- Fig. 5 Strong TSPO immunoreactivity in a subset of tyrosine hydroxylase+ neurons in the striatum. a-f Representative samples of double-label immunostained 5 mum brain sections for TSPO (red) and Iba-1 (brown). a Buffer OPN+, b HIV OPN+, c HIV OPN+, d Buffer OPN-, e HIV OPN-, f Buffer OPN-. g hematoxylin/eosin stained section, and serial adjacent sections stained with h TSPO and i tyrosine hydroxylase. The black ovals demarcate the region of interest in each section
- Submitted by
- Invitrogen Antibodies (provider)
- Main image

- Experimental details
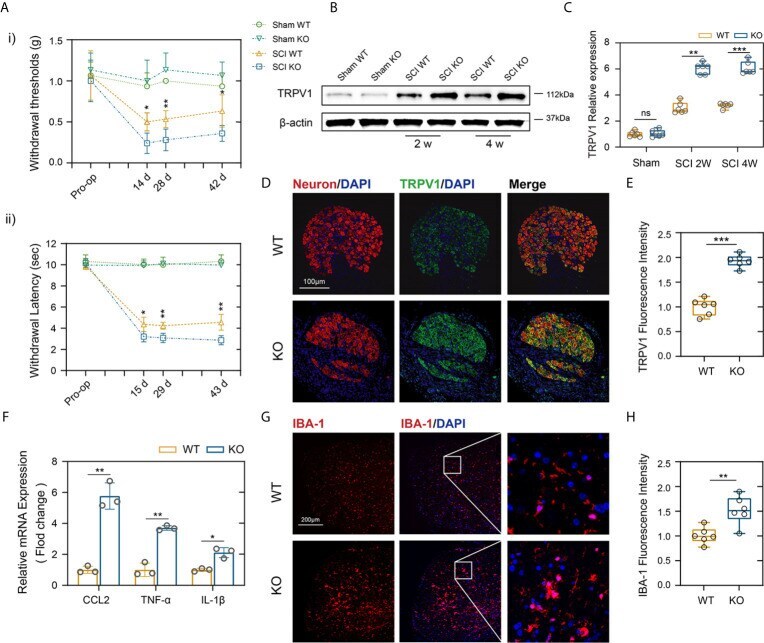
- Figure 3 PD-L1 ablation promoted Nep after SCI. (Ai, ii) Statistical analysis of the mechanical and thermal threshold in PD-LI WT and KO mice. (n = 5 mice per group at each time point, values are the mean +- SD, *p < 0.05, **p < 0.01, repeated measurement analysis of variance). (B, C) Western blot analysis of TRPV1 proteins in DRG (L4 and L5) of PD-L1 WT and KO mice post-SCI, and each lane corresponds to protein from an individual mouse (n = 6 mice per group at each time point, values are the mean +- SD, ns indicates no significance, **p < 0.01, ***p < 0.001, one-way ANOVA). (D, E) IF staining of the Neuron (red) and TRPV1 (green) in the DRG of the PD-L1 WT and KO mice at day 14 post-SCI. Nuclei were counterstained with DAPI (blue). (n = 6 mice per group, values are the mean +- SD, ***p < 0.001, two-tailed Student's t tests, scale bar = 100 mum). (F) Quantitative PCR of CCL2, TNF-alpha and IL-1beta in DRG of the PD-L1 WT and KO mice at day 14 post-SCI (n = 3 mice per group, values are the mean +- SD, *p < 0.05, **p < 0.01, two-tailed Student's t tests). (G, H) IF staining of the IBA-1 in the dorsal horn of PD-L1 WT and KO mice at day 14 post-SCI. Nuclei were counterstained with DAPI (blue) (n = 6 mice per group, values are the mean +- SD, **p < 0.01, two-tailed Student's t tests, scale bar = 100 mum).
- Submitted by
- Invitrogen Antibodies (provider)
- Main image
- Experimental details
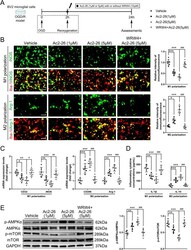
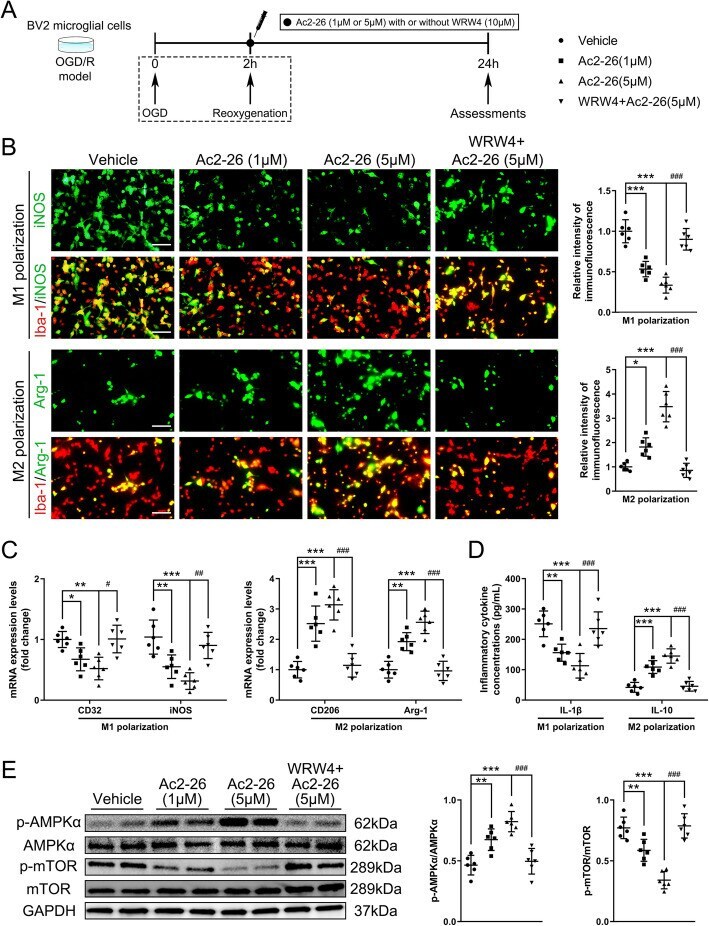
- Fig. 6 Effect of FPR2/ALX-dependent AMPK-mTOR pathway on Ac2-26-mediated in vitro BV2 microglial polarization. a Schematic diagram of the experimental design. b Representative photographs of double immunostaining and quantitative analyses of BV2 microglial polarization. M1-phenotype: iNOS + (green) and Iba-1 + (red); M2-phenotype: Arg-1 + (green) and Iba-1 + (red). Scale bar = 100 mum. c qRT-PCR analyses of mRNA expressions of M1-phenotype markers (CD32 and iNOS) and M2-phenotype markers (CD206 and Arg-1). d ELISA analyses of the expressions of a pro-inflammatory cytokine IL-1beta (M1-phenotype) and an anti-inflammatory cytokine IL-10 (M2-phenotype). e Representative western blotting bands and densitometric quantifications of phosphorylation of AMPKalpha and mTOR. Data were presented as the mean +- SD ( n = 6/group) and were analyzed by one-way ANOVA followed by Bonferroni's multiple comparison test. * p < 0.05, ** p < 0.01, and *** p < 0.001, # p < 0.05, ## p < 0.01, and ### p < 0.001
- Submitted by
- Invitrogen Antibodies (provider)
- Main image
- Experimental details
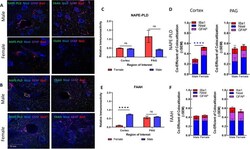
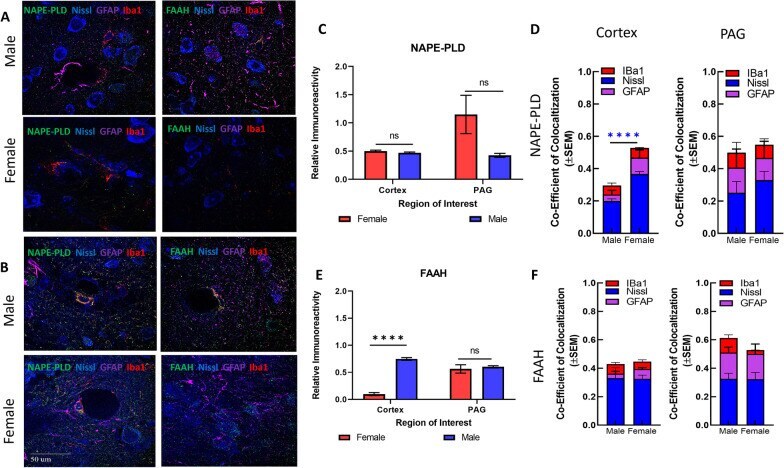
- Fig. 3 Immunohistochemical analysis of the AEA system. A Immunohistochemistry of naive male and female cortex. Staining for NAPE-PLD, FAAH, Iba1, GFAP, and Nissl was performed. Original magnification x63. B Immunohistochemistry of naive male and female PAG. Staining for NAPE-PLD, FAAH, Iba1, GFAP, and Nissl was performed. Original magnification x63. Scale on lower left image applies to all frames. C Measurement of relative area of IHC field occupied by NAPE-PLD staining pixels for each sex and region. No significant differences were observed between region or sex. D Measurement of co-efficient of colocalization for NAPE-PLD with IBa1, Nissl, and GFAP. NAPE-PLD colocalized with Nissl at significantly higher rates in female cortex vs male cortex (**** p = 0.004). No significant differences observed in PAG. E Measurement of relative area of IHC field occupied by FAAH staining pixels for each sex and region. FAAH immunoreactivity was significantly higher in male cortex vs female cortex (**** p = 0.003). F Measurement of co-efficient of colocalization for FAAH with IBa1, Nissl, and GFAP. No significant differences observed between region or sex. All calculations for co-efficient of colocalization were performed with respect to the relevant enzyme. n = 3/sex for each analysis
- Submitted by
- Invitrogen Antibodies (provider)
- Main image
- Experimental details
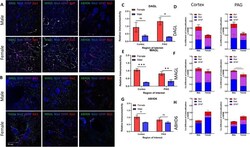
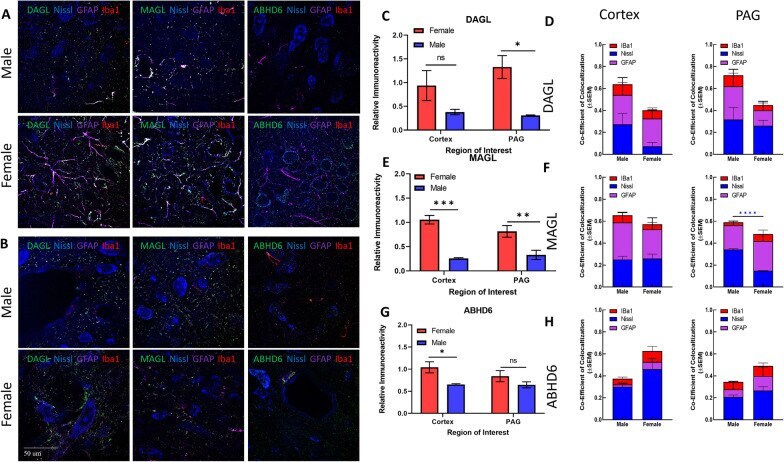
- Fig. 4 Immunohistochemical analysis of the AEA system. A Immunohistochemistry of naive male and female V1M cortex. Staining for NAPE-PLD, FAAH, Iba1, GFAP, and Nissl was performed. Original magnification x63. B Immunohistochemistry of naive male and female PAG. Staining for NAPE-PLD, FAAH, Iba1, GFAP, and Nissl was performed. Original magnification x63. C Measurement of relative area of IHC field occupied by NAPE-PLD staining pixels for each sex and region. Female NAPE-PLD immunoreactivity was significantly higher in PAG vs male PAG (* p = 0.02). D Measurement of co-efficient of colocalization for NAPE-PLD with IBa1, Nissl, and GFAP. NAPE-PLD colocalized with Nissl at significantly higher rates in female V1M cortex vs male V1M cortex (**** p = 0.001). No significant differences observed in PAG. E Measurement of relative area of IHC field occupied by FAAH staining pixels for each sex and region. FAAH immunoreactivity was significantly higher in female PAG vs male PAG (*** p = 0.0042) as well as female PAG vs female V1M cortex ( ### p = 0.002). F Measurement of co-efficient of colocalization for FAAH with IBa1, Nissl, and GFAP. No significant differences observed between region or sex. All calculations for co-efficient of colocalization were performed with respect to the relevant enzyme. n = 3/sex for each analysis
- Submitted by
- Invitrogen Antibodies (provider)
- Main image
- Experimental details
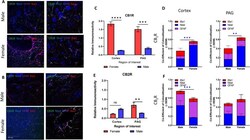
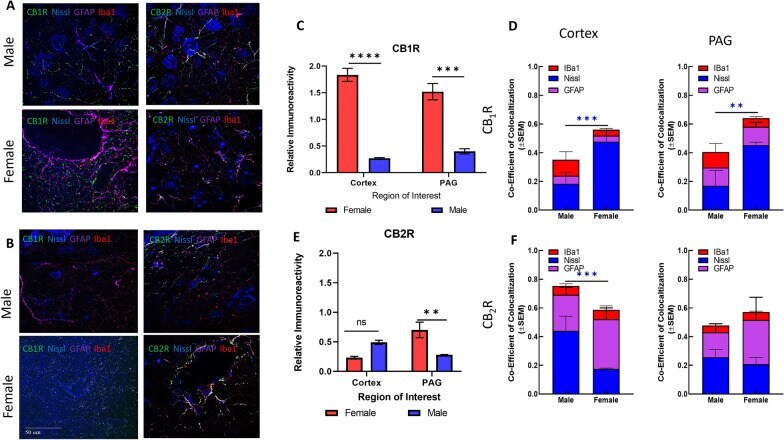
- Fig. 5 Immunohistochemical analysis of CB1R and CB2R. A Immunohistochemistry of naive male and female cortex. Staining for CB1R, CB2R, Iba1, GFAP, and Nissl was performed. Original magnification x63. B Immunohistochemistry of naive male and female PAG. Staining for CB1R, CB2R, Iba1, GFAP, and Nissl was performed. Original magnification x63. Scale on lower left image applies to all frames. C Relative immunoreactivity of CB1R staining revealed significantly greater staining for CB1R in female cortex and lPAG vs males for both regions (**** p < 0.0001 female cortex vs male cortex, *** p = 0.001 female lPAG vs male lPAG). D Measurement of co-efficient of colocalization for CB1R with Iba1, Nissl, and GFAP. CB1R colocalization with Nissl was significantly higher in female cortex vs male cortex (*** p = 0.008) and female PAG vs male PAG (** p = 0.01). E CB2R immunoreactivity was significantly higher in female lPAG vs male lPAG (** p = 0.0053). F Measurement of co-efficient of colocalization for CB2R with IBa1, Nissl, and GFAP. CB2R colocalization with Nissl in the male cortex was significantly greater than in female cortex (*** p = 0.0178). All calculations for co-efficient of colocalization were performed with respect to the relevant enzyme. n = 3/sex for each analysis
- Submitted by
- Invitrogen Antibodies (provider)
- Main image
- Experimental details
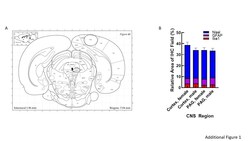
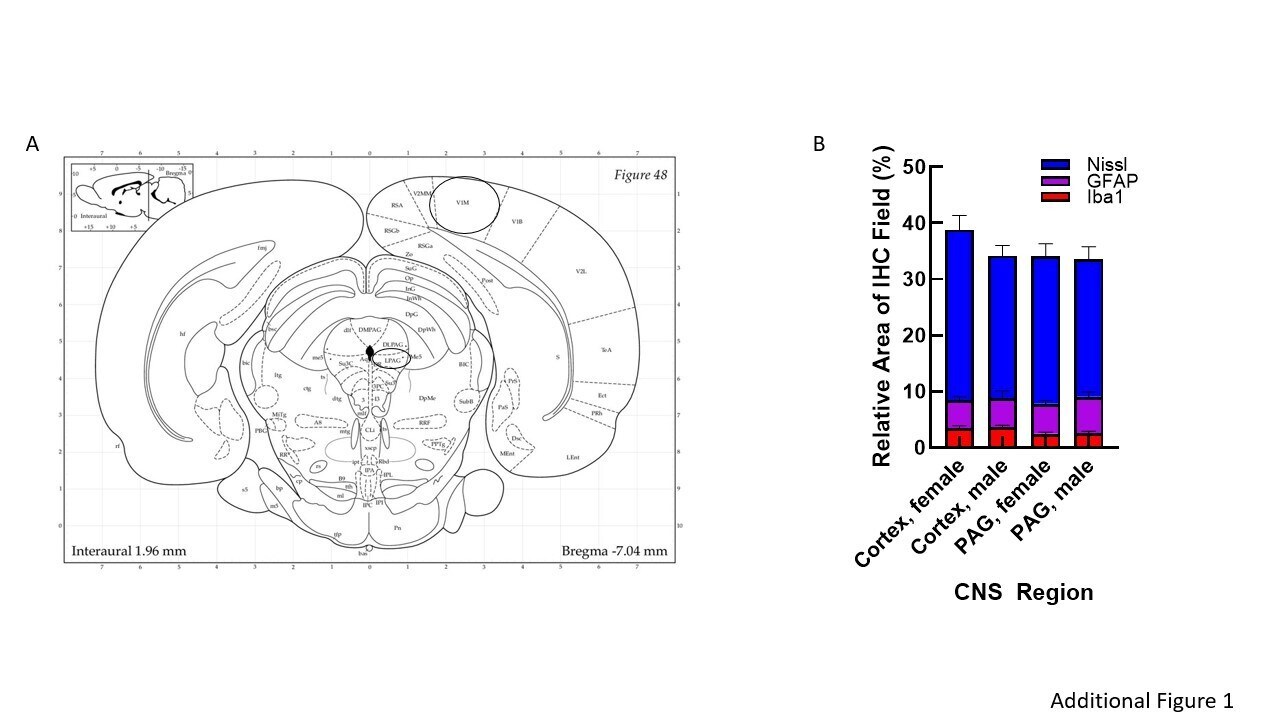
- Additional file 1: Figure 1. Regional analysis. A Serial sections from rats' brains were obtained at a thickness of 30um, moving posteriorly from approximately Bregma -7mm with PAG imaging in the lateral PAG. B Quantification of the relative area immunoreactive in each field for Nissl (neuronal soma), GFAP (astrocytes), and Iba1 (microglia) was statistically similar between regions and sex.
- Submitted by
- Invitrogen Antibodies (provider)
- Main image
- Experimental details
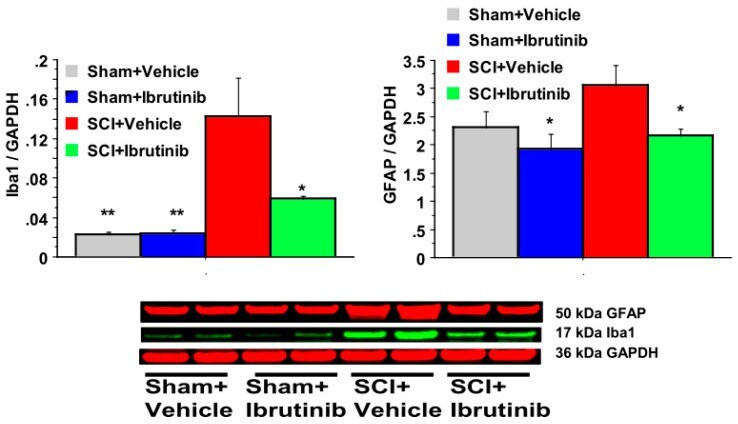
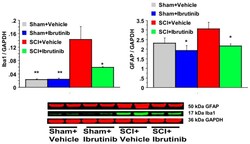
- Figure 5 Effects of Ibrutinib post-treatment on Iba1 and GFAP proteins analyzed by quantification of Western blotting data. Western blot analysis of spinal cord samples (60 mug of protein extract each sample) at lesion epicenter showed that contusion injury increased Iba1 and GFAP activity in the spinal cord seven days post-injury compared with sham-operated animals. Ibrutinib treatment (6 mg/kg/day, starting at 3 h post-injury for seven days) resulted in reduced levels of Iba1 and GFAP in the spinal cord lesion site at 7 days after contusive SCI compared with vehicle-treated animals. Quantification of Iba1/GADPH and GFAP/GADPH seven days after contusive SCI was performed by the fold of blot density. Antibody was specific for the Iba1 or GFAP. Data are presented as mean +- S.E.M., n = 4 per group, and analyzed with one-way ANOVA followed by Bonferroni post hoc analysis, * p < 0.05, ** p < 0.01 compared to vehicle treated SCI animals.