Explore
 Validate
 Learn
Learn Western blot
 Immunocytochemistry
Antibody data
- Antibody Data
- Antigen structure
- References [38]
- Comments [0]
- Validations
- Immunocytochemistry [3]
- Immunoprecipitation [1]
- Immunohistochemistry [7]
- Flow cytometry [4]
- Other assay [39]
Submit
Validation data
Reference
Comment
Report error
- Product number
- PA5-27436 - Provider product page

- Provider
- Invitrogen Antibodies
- Product name
- IBA1 Polyclonal Antibody
- Antibody type
- Polyclonal
- Antigen
- Recombinant full-length protein
- Description
- Predicted reactivity: Bovine, Pig, Rhesus Monkey (>80% identity)
- Reactivity
- Human, Mouse, Rat
- Host
- Rabbit
- Isotype
- IgG
- Vial size
- 100 μL
- Concentration
- 0.14 mg/mL
- Storage
- Store at 4°C short term. For long term storage, store at -20°C, avoiding freeze/thaw cycles.
Submitted references Establishment of the reproducible branch retinal artery occlusion mouse model and intravital longitudinal imaging of the retinal CX3CR1-GFP(+) cells after spontaneous arterial recanalization.
Upregulation of NADPH Oxidase 2 Contributes to Renal Fibrosis in pcy Mice: An Experimental Model of Nephronophthisis.
Phenotypic and Transcriptional Changes of Pulmonary Immune Responses in Dogs Following Canine Distemper Virus Infection.
Helicobacter pylori Urease: Potential Contributions to Alzheimer's Disease.
Bim Expression Promotes the Clearance of Mononuclear Phagocytes during Choroidal Neovascularization, Mitigating Scar Formation in Mice.
Food Reward Alterations during Obesity Are Associated with Inflammation in the Striatum in Mice: Beneficial Effects of Akkermansia muciniphila.
Case Report: Primary Diffuse Leptomeningeal Oligodendrogliomatosis in a Young Adult Cat.
Evidence of a Myenteric Plexus Barrier and Its Macrophage-Dependent Degradation During Murine Colitis: Implications in Enteric Neuroinflammation.
Distribution of Immune Cells Including Macrophages in the Human Cochlea.
Rats bred for low intrinsic aerobic exercise capacity link obesity with brain inflammation and reduced structural plasticity of the hippocampus.
17β-Estradiol Abrogates Oxidative Stress and Neuroinflammation after Cortical Stab Wound Injury.
Astrocytes contribute to pain gating in the spinal cord.
Human Pluripotent Stem Cell-Derived Neural Progenitor Cells Promote Retinal Ganglion Cell Survival and Axon Recovery in an Optic Nerve Compression Animal Model.
Deciphering an AgRP-serotoninergic neural circuit in distinct control of energy metabolism from feeding.
Pharmacological validation of TDO as a target for Parkinson's disease.
Photobiomodulation with a 660-Nanometer Light-Emitting Diode Promotes Cell Proliferation in Astrocyte Culture.
Dexmedetomidine attenuates sepsis-associated inflammation and encephalopathy via central α2A adrenoceptor.
α-Linolenic acid induces clearance of Tau seeds via Actin-remodeling in Microglia.
α- Linolenic acid modulates phagocytosis and endosomal pathways of extracellular Tau in microglia.
Cromolyn inhibits the secretion of inflammatory cytokines by human microglia (HMC3).
Quinovic Acid Impedes Cholesterol Dyshomeostasis, Oxidative Stress, and Neurodegeneration in an Amyloid-β-Induced Mouse Model.
Experimental Trypanosoma cruzi Infection Induces Pain in Mice Dependent on Early Spinal Cord Glial Cells and NFκB Activation and Cytokine Production.
Obesity and Age-Related Changes in the Brain of the Zucker Lepr (fa/fa) Rats.
The extracellular vesicle of gut microbial Paenalcaligenes hominis is a risk factor for vagus nerve-mediated cognitive impairment.
Phagocytosis of full-length Tau oligomers by Actin-remodeling of activated microglia.
Enhancing protective microglial activities with a dual function TREM2 antibody to the stalk region.
Axonopathy and Reduction of Membrane Resistance: Key Features in a New Murine Model of Human G(M1)-Gangliosidosis.
Human Inner Ear Immune Activity: A Super-Resolution Immunohistochemistry Study.
TSEN54 missense variant in Standard Schnauzers with leukodystrophy.
Contribution of spinal cord glial cells to L. amazonensis experimental infection-induced pain in BALB/c mice.
Involvement of the NADPH oxidase 2 pathway in renal oxidative stress in Aqp11 (-/-) mice.
Super-resolution immunohistochemistry study on CD4 and CD8 cells and the relation to macrophages in human cochlea.
Interferon-Stimulated Genes-Mediators of the Innate Immune Response during Canine Distemper Virus Infection.
The Human Endolymphatic Sac and Inner Ear Immunity: Macrophage Interaction and Molecular Expression.
Macrophages in the Human Cochlea: Saviors or Predators-A Study Using Super-Resolution Immunohistochemistry.
Reduced Serum IGF-1 Associated With Hepatic Osteodystrophy Is a Main Determinant of Low Cortical but Not Trabecular Bone Mass.
Analysis of the behavioral, cellular and molecular characteristics of pain in severe rodent spinal cord injury.
The Transient Receptor Potential Melastatin 2 (TRPM2) Channel Contributes to β-Amyloid Oligomer-Related Neurotoxicity and Memory Impairment.
Jeon J, Kim SH, Kong E, Kim SJ, Yang JM, Lee JY, Lee J, Kim YM, Kim P
Frontiers in medicine 2022;9:897800
Frontiers in medicine 2022;9:897800
Upregulation of NADPH Oxidase 2 Contributes to Renal Fibrosis in pcy Mice: An Experimental Model of Nephronophthisis.
Hoshino Y, Sonoda H, Mikoda N, Ikeda M
Nephron 2022;146(4):393-403
Nephron 2022;146(4):393-403
Phenotypic and Transcriptional Changes of Pulmonary Immune Responses in Dogs Following Canine Distemper Virus Infection.
Chludzinski E, Klemens J, Ciurkiewicz M, Geffers R, Pöpperl P, Stoff M, Shin DL, Herrler G, Beineke A
International journal of molecular sciences 2022 Sep 2;23(17)
International journal of molecular sciences 2022 Sep 2;23(17)
Helicobacter pylori Urease: Potential Contributions to Alzheimer's Disease.
Uberti AF, Callai-Silva N, Grahl MVC, Piovesan AR, Nachtigall EG, Furini CRG, Carlini CR
International journal of molecular sciences 2022 Mar 13;23(6)
International journal of molecular sciences 2022 Mar 13;23(6)
Bim Expression Promotes the Clearance of Mononuclear Phagocytes during Choroidal Neovascularization, Mitigating Scar Formation in Mice.
Wang S, Zaitoun IS, Darjatmoko SR, Sheibani N, Sorenson CM
Life (Basel, Switzerland) 2022 Jan 29;12(2)
Life (Basel, Switzerland) 2022 Jan 29;12(2)
Food Reward Alterations during Obesity Are Associated with Inflammation in the Striatum in Mice: Beneficial Effects of Akkermansia muciniphila.
Huwart SJP, de Wouters d'Oplinter A, Rastelli M, Van Hul M, de Vos WM, Luquet S, Cani PD, Everard A
Cells 2022 Aug 16;11(16)
Cells 2022 Aug 16;11(16)
Case Report: Primary Diffuse Leptomeningeal Oligodendrogliomatosis in a Young Adult Cat.
Chludzinski E, Puff C, Weber J, Hewicker-Trautwein M
Frontiers in veterinary science 2021;8:795126
Frontiers in veterinary science 2021;8:795126
Evidence of a Myenteric Plexus Barrier and Its Macrophage-Dependent Degradation During Murine Colitis: Implications in Enteric Neuroinflammation.
Dora D, Ferenczi S, Stavely R, Toth VE, Varga ZV, Kovacs T, Bodi I, Hotta R, Kovacs KJ, Goldstein AM, Nagy N
Cellular and molecular gastroenterology and hepatology 2021;12(5):1617-1641
Cellular and molecular gastroenterology and hepatology 2021;12(5):1617-1641
Distribution of Immune Cells Including Macrophages in the Human Cochlea.
Liu W, Danckwardt-Lillieström N, Schrott-Fischer A, Glueckert R, Rask-Andersen H
Frontiers in neurology 2021;12:781702
Frontiers in neurology 2021;12:781702
Rats bred for low intrinsic aerobic exercise capacity link obesity with brain inflammation and reduced structural plasticity of the hippocampus.
Mäkinen E, Lensu S, Honkanen M, Laitinen P, Wikgren J, Koch LG, Britton SL, Kainulainen H, Pekkala S, Nokia MS
Brain, behavior, and immunity 2021 Oct;97:250-259
Brain, behavior, and immunity 2021 Oct;97:250-259
17β-Estradiol Abrogates Oxidative Stress and Neuroinflammation after Cortical Stab Wound Injury.
Saeed K, Jo MH, Park JS, Alam SI, Khan I, Ahmad R, Khan A, Ullah R, Kim MO
Antioxidants (Basel, Switzerland) 2021 Oct 25;10(11)
Antioxidants (Basel, Switzerland) 2021 Oct 25;10(11)
Astrocytes contribute to pain gating in the spinal cord.
Xu Q, Ford NC, He S, Huang Q, Anderson M, Chen Z, Yang F, Crawford LK, Caterina MJ, Guan Y, Dong X
Science advances 2021 Nov 5;7(45):eabi6287
Science advances 2021 Nov 5;7(45):eabi6287
Human Pluripotent Stem Cell-Derived Neural Progenitor Cells Promote Retinal Ganglion Cell Survival and Axon Recovery in an Optic Nerve Compression Animal Model.
Park M, Kim HM, Shin HA, Lee SH, Hwang DY, Lew H
International journal of molecular sciences 2021 Nov 20;22(22)
International journal of molecular sciences 2021 Nov 20;22(22)
Deciphering an AgRP-serotoninergic neural circuit in distinct control of energy metabolism from feeding.
Han Y, Xia G, Srisai D, Meng F, He Y, Ran Y, He Y, Farias M, Hoang G, Tóth I, Dietrich MO, Chen MH, Xu Y, Wu Q
Nature communications 2021 Jun 10;12(1):3525
Nature communications 2021 Jun 10;12(1):3525
Pharmacological validation of TDO as a target for Parkinson's disease.
Perez-Pardo P, Grobben Y, Willemsen-Seegers N, Hartog M, Tutone M, Muller M, Adolfs Y, Pasterkamp RJ, Vu-Pham D, van Doornmalen AM, van Cauter F, de Wit J, Gerard Sterrenburg J, Uitdehaag JCM, de Man J, Buijsman RC, Zaman GJR, Kraneveld AD
The FEBS journal 2021 Jul;288(14):4311-4331
The FEBS journal 2021 Jul;288(14):4311-4331
Photobiomodulation with a 660-Nanometer Light-Emitting Diode Promotes Cell Proliferation in Astrocyte Culture.
Yoon SR, Hong N, Lee MY, Ahn JC
Cells 2021 Jul 2;10(7)
Cells 2021 Jul 2;10(7)
Dexmedetomidine attenuates sepsis-associated inflammation and encephalopathy via central α2A adrenoceptor.
Mei B, Li J, Zuo Z
Brain, behavior, and immunity 2021 Jan;91:296-314
Brain, behavior, and immunity 2021 Jan;91:296-314
α-Linolenic acid induces clearance of Tau seeds via Actin-remodeling in Microglia.
Desale SE, Chinnathambi S
Molecular biomedicine 2021 Feb 9;2(1):4
Molecular biomedicine 2021 Feb 9;2(1):4
α- Linolenic acid modulates phagocytosis and endosomal pathways of extracellular Tau in microglia.
Desale SE, Chinnathambi S
Cell adhesion & migration 2021 Dec;15(1):84-100
Cell adhesion & migration 2021 Dec;15(1):84-100
Cromolyn inhibits the secretion of inflammatory cytokines by human microglia (HMC3).
Wang YJ, Monteagudo A, Downey MA, Ashton-Rickardt PG, Elmaleh DR
Scientific reports 2021 Apr 13;11(1):8054
Scientific reports 2021 Apr 13;11(1):8054
Quinovic Acid Impedes Cholesterol Dyshomeostasis, Oxidative Stress, and Neurodegeneration in an Amyloid-β-Induced Mouse Model.
Saeed K, Shah SA, Ullah R, Alam SI, Park JS, Saleem S, Jo MH, Kim MW, Hahm JR, Kim MO
Oxidative medicine and cellular longevity 2020;2020:9523758
Oxidative medicine and cellular longevity 2020;2020:9523758
Experimental Trypanosoma cruzi Infection Induces Pain in Mice Dependent on Early Spinal Cord Glial Cells and NFκB Activation and Cytokine Production.
Borghi SM, Fattori V, Carvalho TT, Tatakihara VLH, Zaninelli TH, Pinho-Ribeiro FA, Ferraz CR, Staurengo-Ferrari L, Casagrande R, Pavanelli WR, Cunha FQ, Cunha TM, Pinge-Filho P, Verri WA
Frontiers in immunology 2020;11:539086
Frontiers in immunology 2020;11:539086
Obesity and Age-Related Changes in the Brain of the Zucker Lepr (fa/fa) Rats.
Tomassoni D, Martinelli I, Moruzzi M, Micioni Di Bonaventura MV, Cifani C, Amenta F, Tayebati SK
Nutrients 2020 May 9;12(5)
Nutrients 2020 May 9;12(5)
The extracellular vesicle of gut microbial Paenalcaligenes hominis is a risk factor for vagus nerve-mediated cognitive impairment.
Lee KE, Kim JK, Han SK, Lee DY, Lee HJ, Yim SV, Kim DH
Microbiome 2020 Jul 15;8(1):107
Microbiome 2020 Jul 15;8(1):107
Phagocytosis of full-length Tau oligomers by Actin-remodeling of activated microglia.
Das R, Balmik AA, Chinnathambi S
Journal of neuroinflammation 2020 Jan 8;17(1):10
Journal of neuroinflammation 2020 Jan 8;17(1):10
Enhancing protective microglial activities with a dual function TREM2 antibody to the stalk region.
Schlepckow K, Monroe KM, Kleinberger G, Cantuti-Castelvetri L, Parhizkar S, Xia D, Willem M, Werner G, Pettkus N, Brunner B, Sülzen A, Nuscher B, Hampel H, Xiang X, Feederle R, Tahirovic S, Park JI, Prorok R, Mahon C, Liang CC, Shi J, Kim DJ, Sabelström H, Huang F, Di Paolo G, Simons M, Lewcock JW, Haass C
EMBO molecular medicine 2020 Apr 7;12(4):e11227
EMBO molecular medicine 2020 Apr 7;12(4):e11227
Axonopathy and Reduction of Membrane Resistance: Key Features in a New Murine Model of Human G(M1)-Gangliosidosis.
Eikelberg D, Lehmbecker A, Brogden G, Tongtako W, Hahn K, Habierski A, Hennermann JB, Naim HY, Felmy F, Baumgärtner W, Gerhauser I
Journal of clinical medicine 2020 Apr 2;9(4)
Journal of clinical medicine 2020 Apr 2;9(4)
Human Inner Ear Immune Activity: A Super-Resolution Immunohistochemistry Study.
Liu W, Kämpfe Nordström C, Danckwardt-Lillieström N, Rask-Andersen H
Frontiers in neurology 2019;10:728
Frontiers in neurology 2019;10:728
TSEN54 missense variant in Standard Schnauzers with leukodystrophy.
Störk T, Nessler J, Anderegg L, Hünerfauth E, Schmutz I, Jagannathan V, Kyöstilä K, Lohi H, Baumgärtner W, Tipold A, Leeb T
PLoS genetics 2019 Oct;15(10):e1008411
PLoS genetics 2019 Oct;15(10):e1008411
Contribution of spinal cord glial cells to L. amazonensis experimental infection-induced pain in BALB/c mice.
Borghi SM, Fattori V, Pinho-Ribeiro FA, Domiciano TP, Miranda-Sapla MM, Zaninelli TH, Casagrande R, Pinge-Filho P, Pavanelli WR, Alves-Filho JC, Cunha FQ, Cunha TM, Verri WA Jr
Journal of neuroinflammation 2019 May 28;16(1):113
Journal of neuroinflammation 2019 May 28;16(1):113
Involvement of the NADPH oxidase 2 pathway in renal oxidative stress in Aqp11 (-/-) mice.
Hoshino Y, Sonoda H, Nishimura R, Mori K, Ishibashi K, Ikeda M
Biochemistry and biophysics reports 2019 Mar;17:169-176
Biochemistry and biophysics reports 2019 Mar;17:169-176
Super-resolution immunohistochemistry study on CD4 and CD8 cells and the relation to macrophages in human cochlea.
Liu W, Rask-Andersen H
Journal of otology 2019 Mar;14(1):1-5
Journal of otology 2019 Mar;14(1):1-5
Interferon-Stimulated Genes-Mediators of the Innate Immune Response during Canine Distemper Virus Infection.
Klotz D, Gerhauser I
International journal of molecular sciences 2019 Apr 1;20(7)
International journal of molecular sciences 2019 Apr 1;20(7)
The Human Endolymphatic Sac and Inner Ear Immunity: Macrophage Interaction and Molecular Expression.
Kämpfe Nordström C, Danckwardt-Lillieström N, Laurell G, Liu W, Rask-Andersen H
Frontiers in immunology 2018;9:3181
Frontiers in immunology 2018;9:3181
Macrophages in the Human Cochlea: Saviors or Predators-A Study Using Super-Resolution Immunohistochemistry.
Liu W, Molnar M, Garnham C, Benav H, Rask-Andersen H
Frontiers in immunology 2018;9:223
Frontiers in immunology 2018;9:223
Reduced Serum IGF-1 Associated With Hepatic Osteodystrophy Is a Main Determinant of Low Cortical but Not Trabecular Bone Mass.
Liu Z, Han T, Werner H, Rosen CJ, Schaffler MB, Yakar S
Journal of bone and mineral research : the official journal of the American Society for Bone and Mineral Research 2018 Jan;33(1):123-136
Journal of bone and mineral research : the official journal of the American Society for Bone and Mineral Research 2018 Jan;33(1):123-136
Analysis of the behavioral, cellular and molecular characteristics of pain in severe rodent spinal cord injury.
Lee-Kubli CA, Ingves M, Henry KW, Shiao R, Collyer E, Tuszynski MH, Campana WM
Experimental neurology 2016 Apr;278:91-104
Experimental neurology 2016 Apr;278:91-104
The Transient Receptor Potential Melastatin 2 (TRPM2) Channel Contributes to β-Amyloid Oligomer-Related Neurotoxicity and Memory Impairment.
Ostapchenko VG, Chen M, Guzman MS, Xie YF, Lavine N, Fan J, Beraldo FH, Martyn AC, Belrose JC, Mori Y, MacDonald JF, Prado VF, Prado MA, Jackson MF
The Journal of neuroscience : the official journal of the Society for Neuroscience 2015 Nov 11;35(45):15157-69
The Journal of neuroscience : the official journal of the Society for Neuroscience 2015 Nov 11;35(45):15157-69
No comments: Submit comment
Supportive validation
- Submitted by
- Invitrogen Antibodies (provider)
- Main image
- Experimental details
- IBA1 Polyclonal Antibody detects Iba1 protein at cell membrane by immunofluorescent analysis. Sample: THP-1 cells were fixed in 4% paraformaldehyde at RT for 15 min. Green: Iba1 stained by IBA1 Polyclonal Antibody (Product # PA5-27436) diluted at 1:500. Red: alpha Tubulin, a cytoskeleton marker, stained by alpha Tubulin antibody (Product # PA5-85158) diluted at 1:1,000. Blue: Fluoroshield with DAPI .
- Submitted by
- Invitrogen Antibodies (provider)
- Main image

- Experimental details
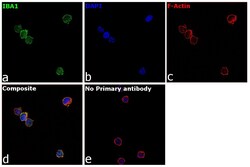
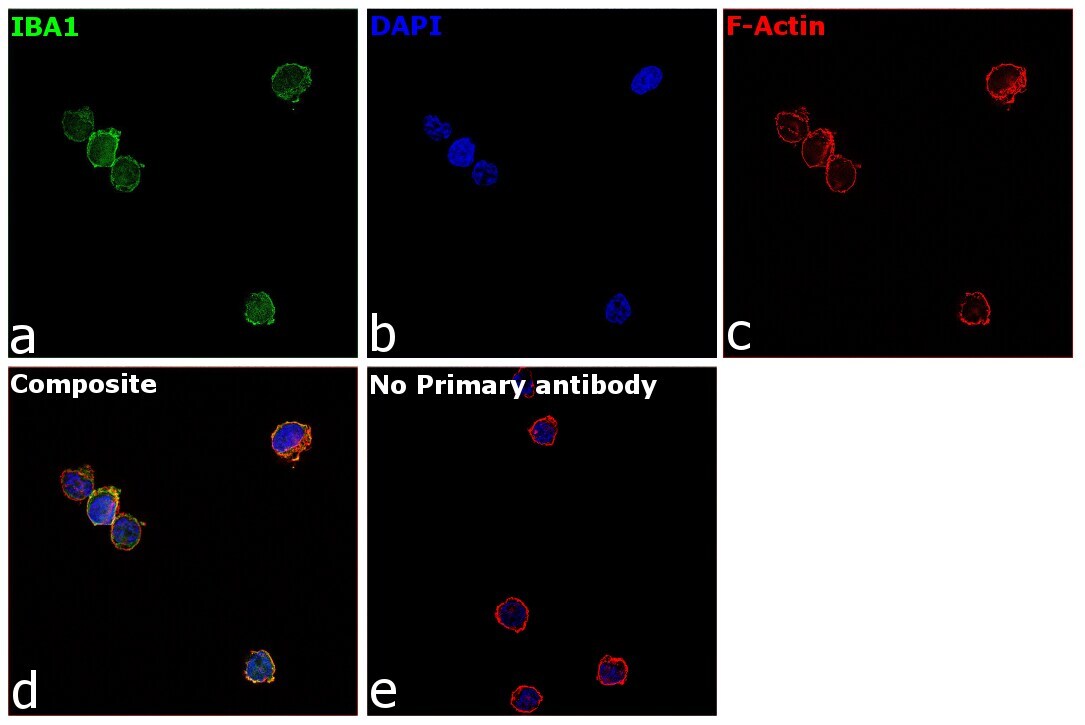
- Immunofluorescence analysis of IBA1 was performed using 70% confluent log phase THP-1 cells. The cells were fixed with 4% paraformaldehyde for 15 minutes, permeabilized with 0.1% Triton™ X-100 for 10 minutes, and blocked with 2% BSA for 1 hour at room temperature. The cells were labeled with IBA1 Polyclonal Antibody (Product # PA5-27436) at 1:500 dilution in 0.1% BSA, incubated at 4 degree celsius overnight and then labeled with Donkey anti-Rabbit IgG (H+L) Highly Cross-Adsorbed Secondary Antibody, Alexa Fluor Plus 488 (Product # A32790, 1:2000 dilution) for 45 minutes at room temperature (Panel a: Green). Nuclei (Panel b:Blue) were stained with ProLong™ Diamond Antifade Mountant with DAPI (Product # P36962). F-actin (Panel c: Red) was stained with Rhodamine Phalloidin (Product # R415, 1:300 dilution). Panel d represents the merged image showing membrane and cytoplasmic localization. Panel e represents control cells with no primary antibody to assess background. The images were captured at 60X magnification.

- Submitted by
- Invitrogen Antibodies (provider)
- Main image
- Experimental details
- Immunofluorescence analysis of IBA1 was performed using 70% confluent log phase THP-1 cells. The cells were fixed with 4% paraformaldehyde for 15 minutes, permeabilized with 0.1% Triton™ X-100 for 10 minutes, and blocked with 2% BSA for 1 hour at room temperature. The cells were labeled with IBA1 Polyclonal Antibody (Product # PA5-27436) at 1:500 dilution in 0.1% BSA, incubated at 4 degree celsius overnight and then labeled with Donkey anti-Rabbit IgG (H+L) Highly Cross-Adsorbed Secondary Antibody, Alexa Fluor Plus 488 (Product # A32790, 1:2000 dilution) for 45 minutes at room temperature (Panel a: Green). Nuclei (Panel b:Blue) were stained with ProLong™ Diamond Antifade Mountant with DAPI (Product # P36962). F-actin (Panel c: Red) was stained with Rhodamine Phalloidin (Product # R415, 1:300 dilution). Panel d represents the merged image showing membrane and cytoplasmic localization. Panel e represents control cells with no primary antibody to assess background. The images were captured at 60X magnification.
Supportive validation
- Submitted by
- Invitrogen Antibodies (provider)
- Main image
- Experimental details
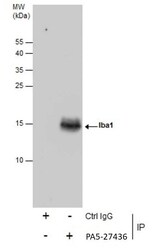
- Immunoprecipitation of Iba1 was performed in K562 whole cell extracts using 5 µg of IBA1 Polyclonal Antibody (Product # PA5-27436). Samples were transferred to a membrane and probed with IBA1 Polyclonal Antibody as a primary antibody and an HRP-conjugated anti-Rabbit IgG was used as a secondary antibody.
Supportive validation
- Submitted by
- Invitrogen Antibodies (provider)
- Main image
- Experimental details
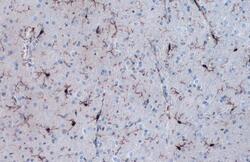
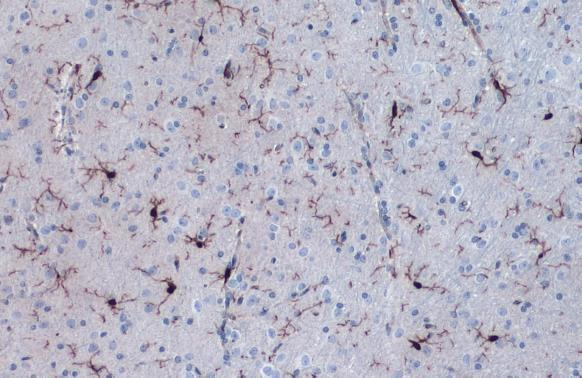
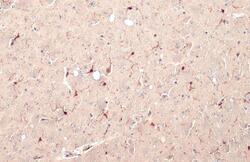
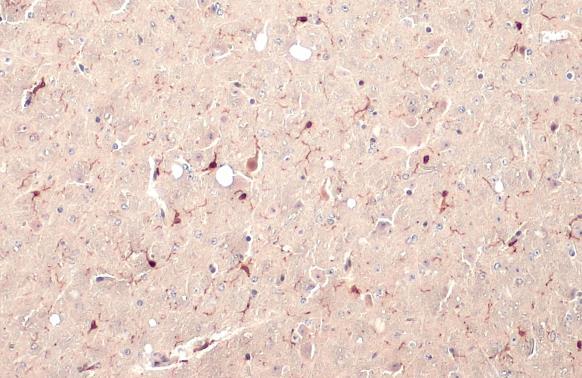
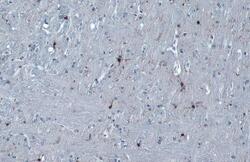
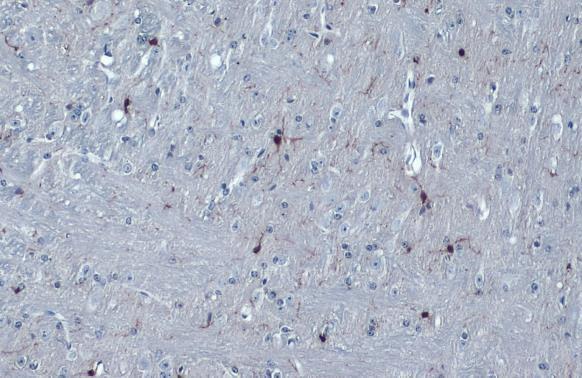
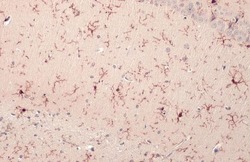
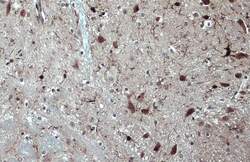
- IBA1 Polyclonal Antibody detects Iba1 protein at cell membrane and cytoplasm by immunohistochemical analysis. Sample: Paraffin-embedded rat cerebellum. Iba1 stained by IBA1 Polyclonal Antibody (Product # PA5-27436) diluted at 1:1,000. Antigen Retrieval: Citrate buffer, pH 6.0, 15 min.
- Submitted by
- Invitrogen Antibodies (provider)
- Main image
- Experimental details
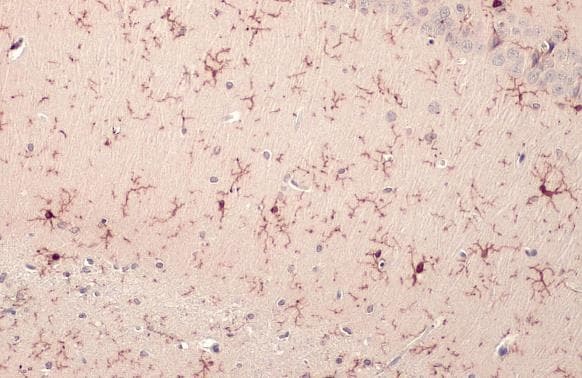
- IBA1 Polyclonal Antibody detects Iba1 protein at cell membrane and cytoplasm by immunohistochemical analysis. Sample: Paraffin-embedded mouse brain. Iba1 stained by IBA1 Polyclonal Antibody (Product # PA5-27436) diluted at 1:500. Antigen Retrieval: Citrate buffer, pH 6.0, 15 min.
- Submitted by
- Invitrogen Antibodies (provider)
- Main image
- Experimental details
- IBA1 Polyclonal Antibody detects Iba1 protein at cell membrane and cytoplasm by immunohistochemical analysis. Sample: Paraffin-embedded mouse cerebellum. Iba1 stained by IBA1 Polyclonal Antibody (Product # PA5-27436) diluted at 1:1,000. Antigen Retrieval: Citrate buffer, pH 6.0, 15 min.
- Submitted by
- Invitrogen Antibodies (provider)
- Main image
- Experimental details
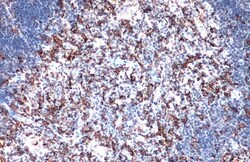
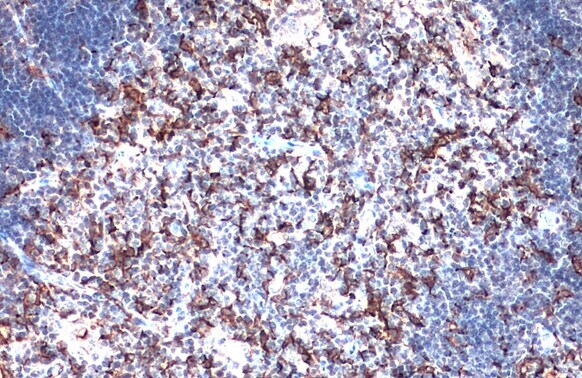
- Immunohistochemistry (Paraffin) analysis of IBA1 was performed in paraffin-embedded mouse thymus gland tissue using IBA1 Polyclonal Antibody (Product # PA5-27436) at a dilution of 1:500. Antigen Retrieval: Citrate buffer, pH 6.0, 15 min.
- Submitted by
- Invitrogen Antibodies (provider)
- Main image
- Experimental details
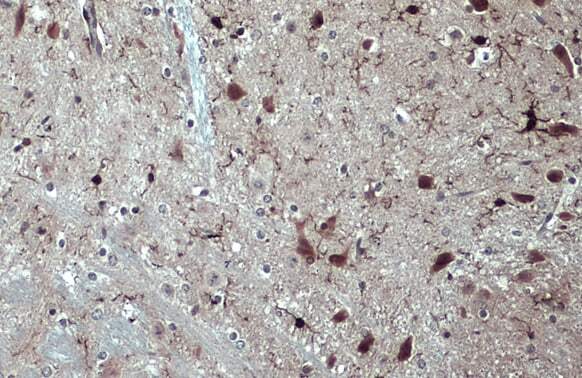
- IBA1 Polyclonal Antibody detects Iba1 protein at cell membrane and cytoplasm by immunohistochemical analysis. Sample: Paraffin-embedded rat brain. Iba1 stained by IBA1 Polyclonal Antibody (Product # PA5-27436) diluted at 1:500. Antigen Retrieval: Citrate buffer, pH 6.0, 15 min.
- Submitted by
- Invitrogen Antibodies (provider)
- Main image
- Experimental details
- Immunohistochemistry (Paraffin) analysis of IBA1 was performed in paraffin-embedded rat brain tissue using IBA1 Polyclonal Antibody (Product # PA5-27436) at a dilution of 1:500.

- Submitted by
- Invitrogen Antibodies (provider)
- Main image
- Experimental details
- Immunohistochemistry (Paraffin) analysis of IBA1 was performed in paraffin-embedded mouse brain tissue using IBA1 Polyclonal Antibody (Product # PA5-27436) at a dilution of 1:500. Antigen Retrieval: Citrate buffer, pH 6.0, 15 min.
Supportive validation
- Submitted by
- Invitrogen Antibodies (provider)
- Main image
- Experimental details
- Flow Cytometry analysis of NQO1 was performed in THP-1 cells using NQO1 Monoclonal Antibody (A180) (Product # MA1-91897) (red) at a dilution of 1:50. Black: Unlabelled sample was used as a control. Acquisition of 20,000 events were collected using a Dylight 488-conjugated secondary antibody for FACS analysis.

- Submitted by
- Invitrogen Antibodies (provider)
- Main image
- Experimental details
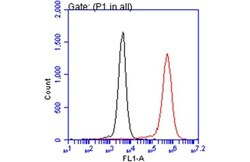
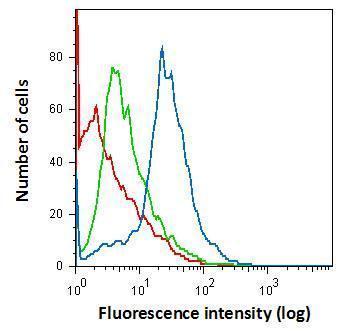
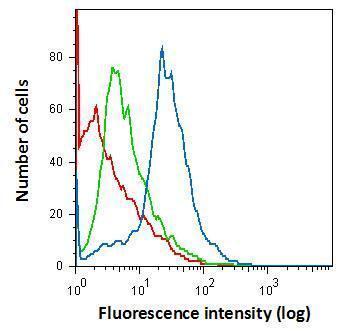
- Flow cytometry on primary murine microglia cells, staining with IBA1 Polyclonal Antibody (Product # PA5-27436) using 1.0 µg per 4x10^5 cells. (Product # PA5-27436) (blue), Rabbit IgG (green) ,Unstained (red).
- Submitted by
- Invitrogen Antibodies (provider)
- Main image
- Experimental details
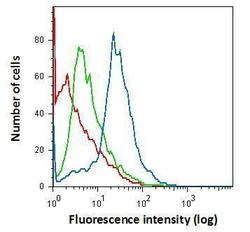
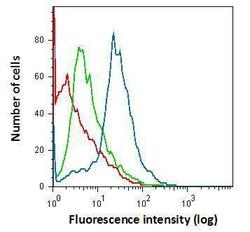
- Flow cytometry on primary murine microglia cells, staining with IBA1 Polyclonal Antibody (Product # PA5-27436) using 1.0 µg per 4x10^5 cells. (Product # PA5-27436) (blue), Rabbit IgG (green) ,Unstained (red).
- Submitted by
- Invitrogen Antibodies (provider)
- Main image

- Experimental details
- Flow Cytometry analysis of NQO1 was performed in THP-1 cells using NQO1 Monoclonal Antibody (A180) (Product # MA1-91897) (red) at a dilution of 1:50. Black: Unlabelled sample was used as a control. Acquisition of 20,000 events were collected using a Dylight 488-conjugated secondary antibody for FACS analysis.

Supportive validation
- Submitted by
- Invitrogen Antibodies (provider)
- Main image

- Experimental details
- NULL
- Submitted by
- Invitrogen Antibodies (provider)
- Main image
- Experimental details
- NULL
- Submitted by
- Invitrogen Antibodies (provider)
- Main image
- Experimental details
- NULL
- Submitted by
- Invitrogen Antibodies (provider)
- Main image
- Experimental details
- NULL
- Submitted by
- Invitrogen Antibodies (provider)
- Main image
- Experimental details
- NULL
- Submitted by
- Invitrogen Antibodies (provider)
- Main image
- Experimental details
- NULL
- Submitted by
- Invitrogen Antibodies (provider)
- Main image
- Experimental details
- NULL
- Submitted by
- Invitrogen Antibodies (provider)
- Main image
- Experimental details
- NULL
- Submitted by
- Invitrogen Antibodies (provider)
- Main image
- Experimental details
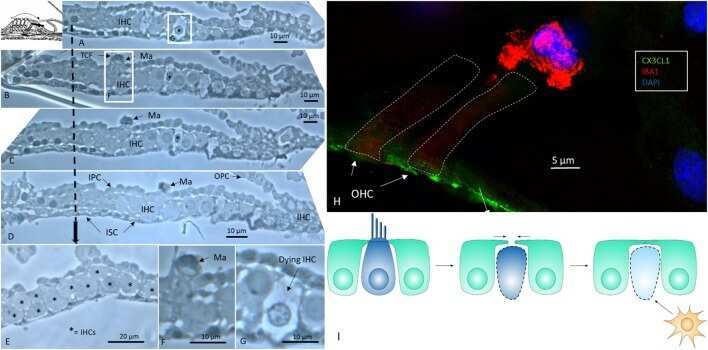
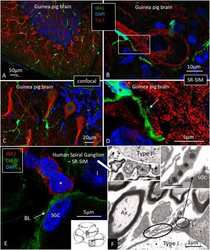
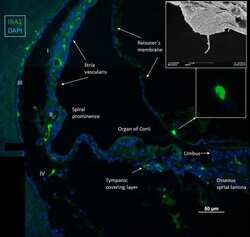
- Figure 1 Immunofluorescence of a radial section of a human cochlear duct showing the distribution of IBA1 cells. In the spiral prominence, some IBA1 cells almost reach the endolymph. Scanning electron microscopy shows a free cell transitioning a cell border in the human cochlea (upper inset). Reissner's membrane (RM) may also contain macrophages (lower inset). In the SV, IBA1 cells are mostly found in the middle layer close to the blood vessels. No IBA1 cells can be observed in the organ of Corti in this section. I-IV; fibrocytes.
- Submitted by
- Invitrogen Antibodies (provider)
- Main image

- Experimental details
- Immunoprecipitation of Iba1 was performed in K562 whole cell extracts using 5 µg of IBA1 Polyclonal Antibody (Product # PA5-27436). Samples were transferred to a membrane and probed with IBA1 Polyclonal Antibody as a primary antibody and an HRP-conjugated anti-Rabbit IgG was used as a secondary antibody.

- Submitted by
- Invitrogen Antibodies (provider)
- Main image
- Experimental details
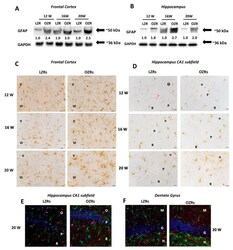
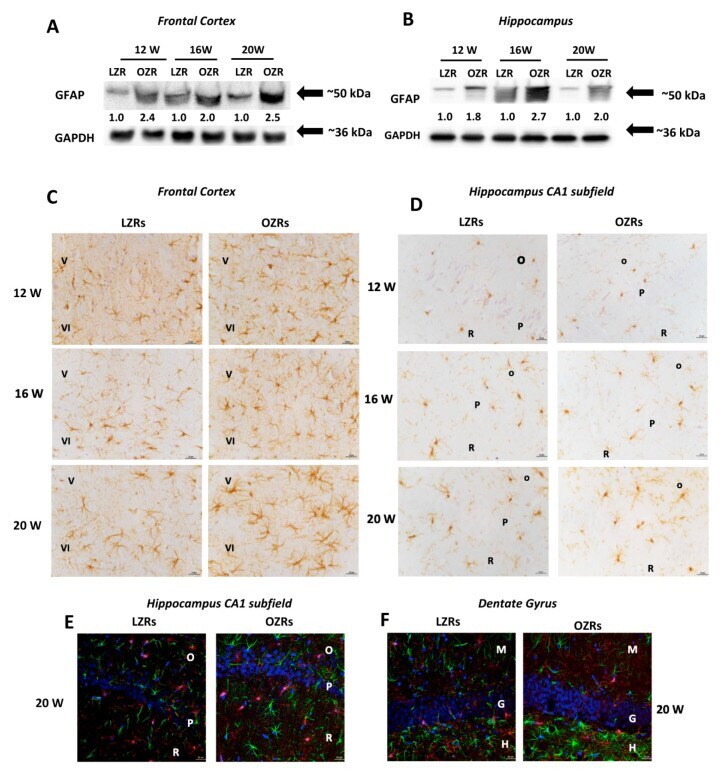
- Figure 4 Glial Markers. Immunochemical analysis of the frontal cortex ( A ) and hippocampus ( B ) processed for anti-glial fibrillary acidic protein (GFAP). To investigate more than GFAP protein on the same blot, both membranes of the frontal cortex and hippocampus were stripped and incubated with anti-GAPDH antibody (loading control). Control images are re-used for illustrative purposes. The densitometric analysis of bands is expressed as the ratio between the optical density of protein and reference protein (GADPH) where the value for LZRs of different ages is set as 1. Blots are representative of one of three separate experiments. ( C ) Sections of the frontal cortex of LZRs and OZRs of different weeks of 12-, 16-, and 20-weeks age processed for the immunohistochemistry against the GFAP. V; IV: fifth and sixth layers of the frontal cortex. Magnification 40X. Calibration bar: 25 mum. ( D ) Sections of the hippocampus (CA1 subfield) of LZRs and OZRs of different weeks of age processed for the immunohistochemistry against ionized calcium-binding adaptor molecule 1 (Iba-1) to detect microglial cells O: stratum oriens ; P: pyramidal neurons; R: stratum radiatum. Calibration bar: 25 mum. ( E ) Sections of the hippocampus (CA1 subfield) and ( F ) dentate gyrus of 20 weeks-old LZRs and OZRs processed for double immunohistochemistry against Iba-1 (Alexa Fluore 594) and GFAP (Alexa Fluore 488). DAPI was used to counterstain nuclei. O: stratum oriens ; P: pyramidal neurons; R: stratu
- Submitted by
- Invitrogen Antibodies (provider)
- Main image
- Experimental details
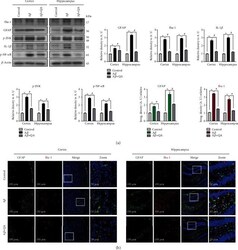
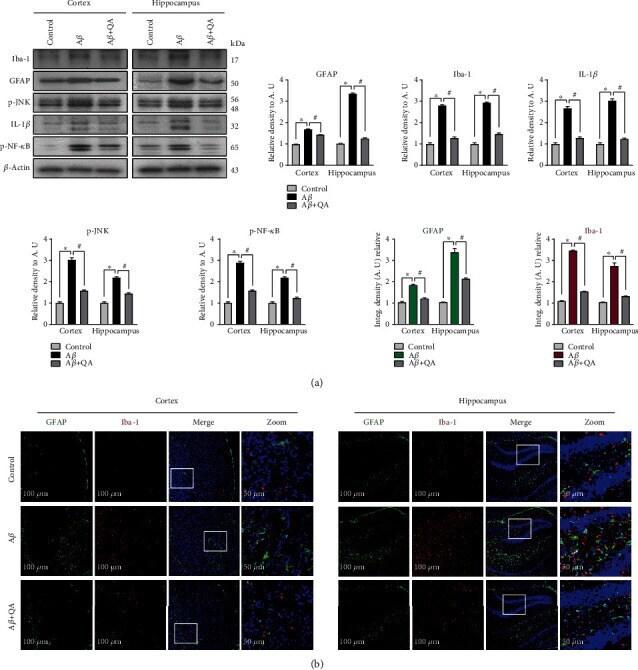
- Figure 4 Effects of quinovic acid against amyloid-beta-induced neuroinflammation. (a) Western blot results of Iba-1, GFAP, p-JNK, IL-1 beta , and p-NF- kappa B in the experimental groups, with respective bar graphs. (b) Representative immunofluorescence images of Iba-1 and GFAP in the cortex and hippocampus (DG) of the experimental groups, with respective bar graphs. Scalebar = 50 mu m. The values of western blot results were normalized to 1. beta -Actin was used as a loading control; the densities were measured in arbitrary unit (A.U.). Data are presented as mean +- SEM. * P < 0.05 compared with the control group. # P < 0.05 compared with the A beta -treated group. Abbreviations: Iba-1: ionized calcium-binding adaptor molecule 1; GFAP: glial fibrillary acidic protein; p-JNK: phosphorylated c-Jun N-terminal kinase; IL-1 beta : interleukin 1 beta; p-NF- kappa B: phospho-nuclear factor-kappa B.
- Submitted by
- Invitrogen Antibodies (provider)
- Main image
- Experimental details
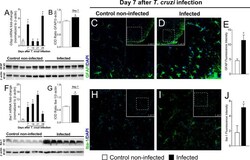
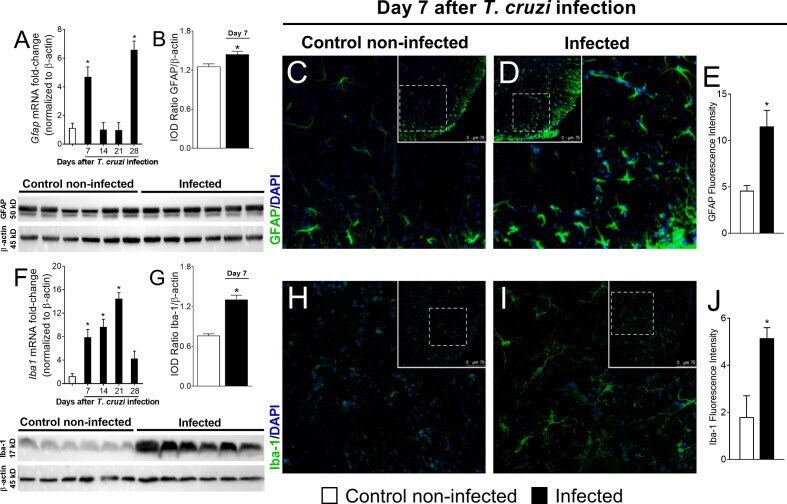
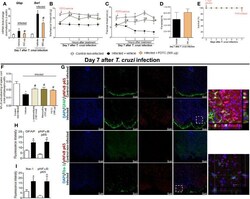
- Figure 2 Experimental T. cruzi infection induces spinal cord astrocytes (A-E) and microglial (F-J) activation. Gfap and Iba1 mRNA expression was determined in control noninfected and infected mice 7-28 days p.i. every 7 days by RT-qPCR (A, F , respectively). At day 7 p.i. (peak of Gfap and Iba1 mRNA expression), Western blot analysis of the spinal cord was performed to confirm GFAP (B) and Iba-1 (G) expression. Next, 7-day spinal cord samples were stained with antibodies for astrocytes (C-E) and microglia (H-J) (GFAP and Iba-1, respectively; green) and regular nucleus (DAPI, blue) detection. Representative immunostainings of the spinal cord of control noninfected and infected mice are shown in panels (C, D, H, I) , respectively (20x magnification, scale bar 75 mum with zoom). Panels (E, J) show the percentage of GFAP and Iba-1 fluorescence intensity in each experimental group, respectively. Results are presented as mean +- SEM of six (A, B, F, G) or four mice (E, J) per group per experiment and are representative of two separate experiments. * p < 0.05 compared to control noninfected mice (one-way ANOVA followed by Tukey's posttest).
- Submitted by
- Invitrogen Antibodies (provider)
- Main image
- Experimental details
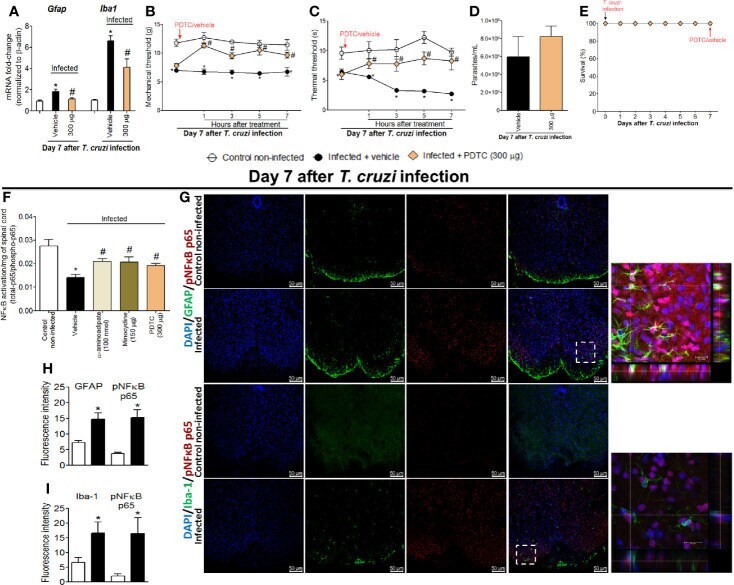
- Figure 4 Targeting spinal cord NFkappaB with PDTC intrathecal treatment inhibits T. cruzi -induced glial activation and hyperalgesia as well as targeting glial cells with alpha-aminoadipate and minocycline reduced spinal cord NFkappaB activation. Panels (A-C) show RT-qPCR data for Gfap and Iba1 mRNA expression and mechanical and thermal hyperalgesia after vehicle and PDTC treatments (300 mug) at the 7th day p.i. Panel (D) presents blood parasitemia at the 7th day p.i. 7 h after the treatments. Panel (E) presents survival rates during the experimental protocol. The effects of targeting spinal cord glial cells with alpha-aminoadipate and minocycline upon NFkappaB activation at the 7th day p.i. 7 h after the treatments are presented in panel (F) . Representative immunostainings of triple immunofluorescence (DAPI/pNFkappaB p65/GFAP and DAPI/pNFkappaB p65/Iba-1) of the spinal cord of control noninfected and infected mice are shown in (G) (20x magnification, scale bar 50 mum). 3-D images with zoom demonstrating pNFkappaB p65 staining surrounded by GFAP or Iba-1 are shown in inserts. Panels H and I demonstrate the fluorescence intensity (%) of GFAP and pNFkappaB p65, and Iba-1, and pNFkappaB p65, respectively. Results are presented as mean +- SEM of six (A-F) or four mice (G-I) per group per experiment and are representative of two separate experiments. * p < 0.05 compared to control noninfected mice; # p < 0.05 compared to infected mice treated with vehicle (one-way ANOVA followed
- Submitted by
- Invitrogen Antibodies (provider)
- Main image
- Experimental details
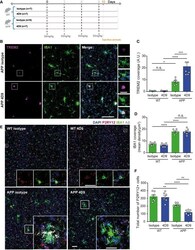
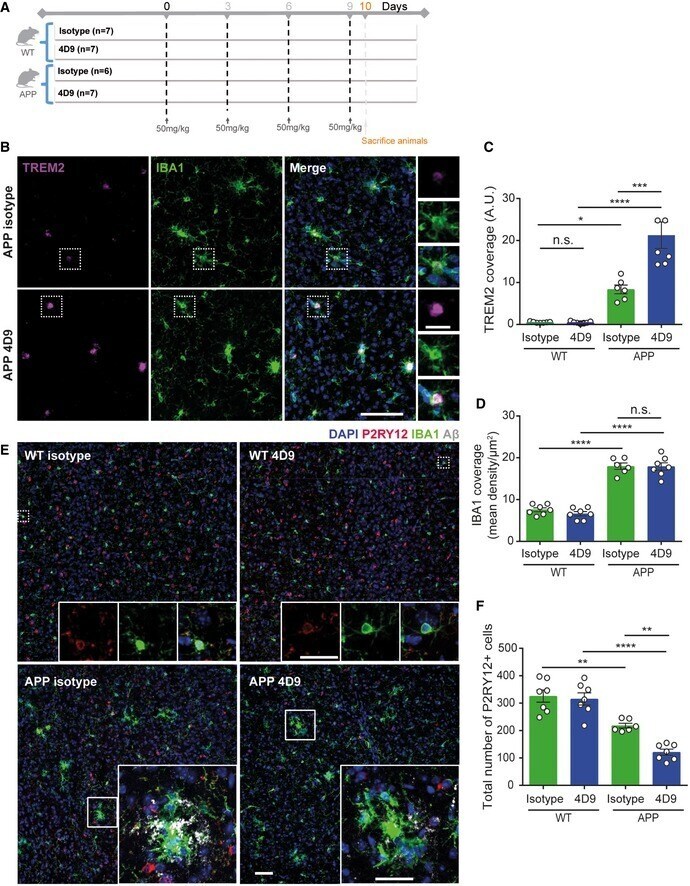
- Figure 6 4D9 antibody modulates TREM 2 functions within the brain Schematic outlining study design and timeline of intraperitoneal injections of either isotype control of 4D9 antibody in 6-month-old APP-NL-G-F and age-matched WT mice. Immunohistochemical costainings of TREM2 (magenta) and IBA1 (green) microglia in the cortex of isotype control and 4D9-injected WT and APP-NL-G-F mice. Side panel shows images from each staining at a larger magnification indicated by the dotted white boxes. Scale bar = 10 mum; scale bar (inset) = 2.5 mum. Quantification of cortical TREM2 stainings shown in (B). Two-way ANOVA, Tukey''s multiple comparison test (genotype effect: F 1,23 = 70.63, P 0.9999; P (WT isotype vs APP isotype) = 0.02; P (WT 4D9 vs APP 4D9) < 0.0001; P (APP isotype vs APP 4D9) = 0.0001; n.s., not significant. Quantification of cortical IBA1 staining shown in B. Two-way ANOVA, Tukey''s multiple comparison test (genotype effect: F 1,21 = 215.4, P
- Submitted by
- Invitrogen Antibodies (provider)
- Main image
- Experimental details
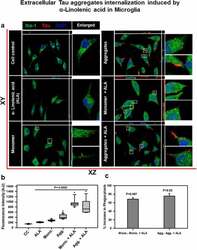
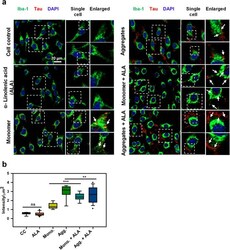
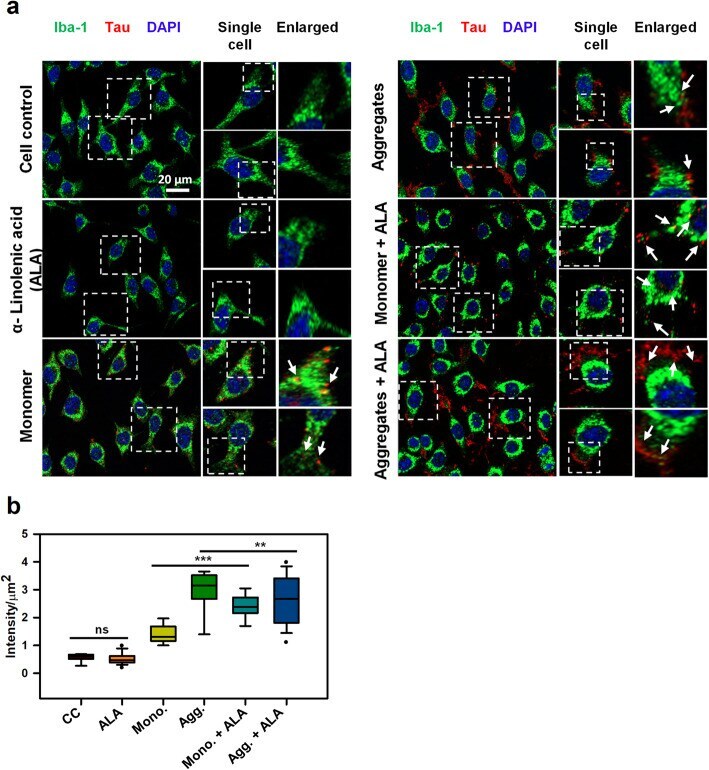
- Figure 2. Extracellular Tau aggregates internalization, induced by alpha-linolenic acid in microglia . Internalization of hTau40 recombinant Tau in Iba-1 positive microglia. (a) Cells were incubated with hTau40 aggregates species, hTau40 monomer species (1 uM) alone, and along with the alpha-linolenic acid (40 uM) for 24 h at 37degC. The cells were fixed after 24 h and stained with anti-Iba-1 antibody (green) and T46 Tau antibody (red) and observed by fluorescence microscopy; scale bar is 20 um. The orthogonal images denote the internalization of Tau, indicated at X and Y plane to visualize the intracellular position. The enlarged panel indicates internalized Tau. The images were taken with the Zeiss fluorescence microscope with Apotome 2.0. (b) Quantification of mean intensity of internalized Tau in microglia cells showing the extent of internalization Tau in microglia cells, which is highly significant ( P < 0.001) compared with cell control (no treatment) and ALA-treated cells. (c) Percentage increase in phagocytosis of hTau40 in microglia after ALA exposure to cells; percentage increase in aggregates compared to aggregates with ALA-exposed groups and in monomer compared to monomer with ALA groups calculated from the intracellular intensity of Tau among the groups; significance is P = 0.02 and 0.007, respectively
- Submitted by
- Invitrogen Antibodies (provider)
- Main image
- Experimental details
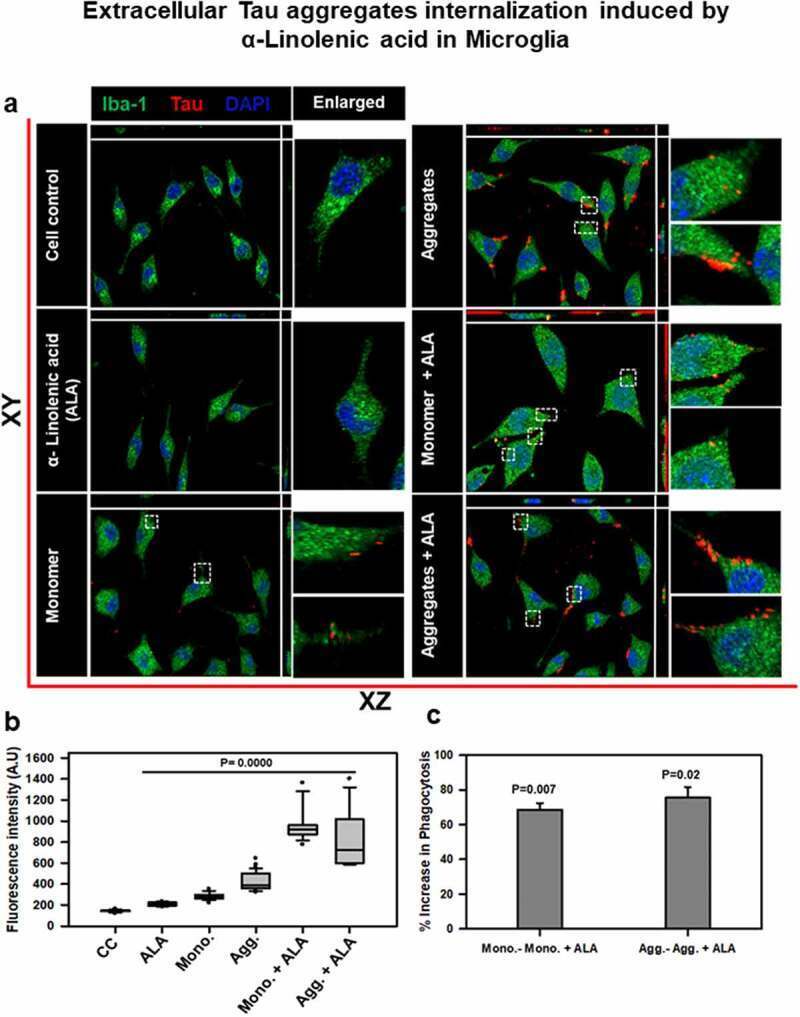
- Figure 1 Inflammatory activation of HMC3 human microglia cell line by TNF-alpha and IFN-gamma. ( a ) Flow cytometric analyses demonstrate the increased protein expression of inflammatory microglia biomarkers (IBA-1, CD40, MHC-II, CD68, CD14, and CD86) in the HMC3 cells treated with IFN-gamma (0.3 ug/mL, 24 h) (red), but no alteration in the expression of the anti-inflammatory microglia biomarkers CD163 and CD206. TNF-alpha (0.3 ug/mL, 24 h) (blue) also increases the expression of inflammatory microglia biomarkers (IBA-1, CD40, and CD14). ( b ) q-PCR analysis revealed increased CD11b and TMEM119 expression by HMC3 microglia after addition of 0.3 ug/mL TNF-alpha or 0.3 ug/mL IFN-gamma for 24 h. Fold change is normalized to untreated control. GAPDH was used as an internal control to normalize mRNA level of the gene of measurement in each sample (n = 5 independent experiments). Quantitative analysis ( c ) and representative fluorescence micrographs ( d , displayed at x10 and x4 magnification) of the cell viability assay show that both TNF-alpha and IFN-gamma induce cell death in a concentration-dependent manner (0, 0.01, 0.03, 0.1, 0.3 ug/mL) for 24 h in the HMC3 human microglial cells. Fluorescent green features are AO stains of live cells and fluorescent red features are PI stains of dying cells. * p < 0.1, ** p < 0.01, *** p < 0.001, and NS (no significant difference).

- Submitted by
- Invitrogen Antibodies (provider)
- Main image
- Experimental details
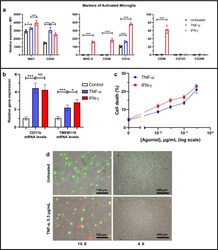
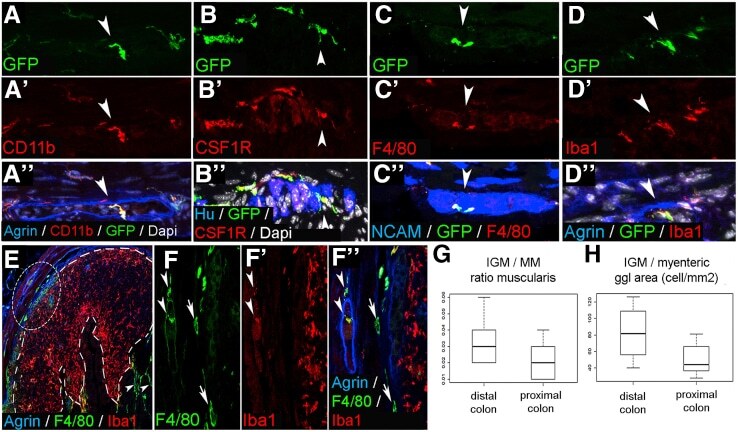
- Figure 2 Immunophenotype and spatial distribution of IGMs in CX3CR1 GFP mouse colon. GFP+ IGMs are present within the agrin-bordered enteric ganglia and co-express CD11b ( A-A"" ), CSF1R ( B-B"" ), F4/80 ( C-C"" ), and Iba1 ( D-D"" ). F4/80 and Iba1 are co-expressed by MMs and IGMs ( F-F"" , arrowheads , magnified from circled area in E ), but Iba1 is not present in submucosal macrophages ( F-F"" , arrows ). In lymphatic aggregates of the colonic mucosa ( E , area within dashed line ), macrophages express Iba1 but not F4/80. Comparison of MM and IGM cell number in the proximal and distal colon of CX3CR1 GFP mice shows no significant difference in ratio of IGMs to total MMs ( G ; 3.26 % +- 1.3 % vs 2.12 % +- 1.1 %, P = .0977, n = 8). However, the number of IGMs is significantly higher in distal colon compared with proximal colon when adjusted to myenteric ganglion area ( H ; 82.37 +- 32.98 vs 50.25 +- 19.6 cell/mm 2 , P = .0309, n = 8).
- Submitted by
- Invitrogen Antibodies (provider)
- Main image

- Experimental details
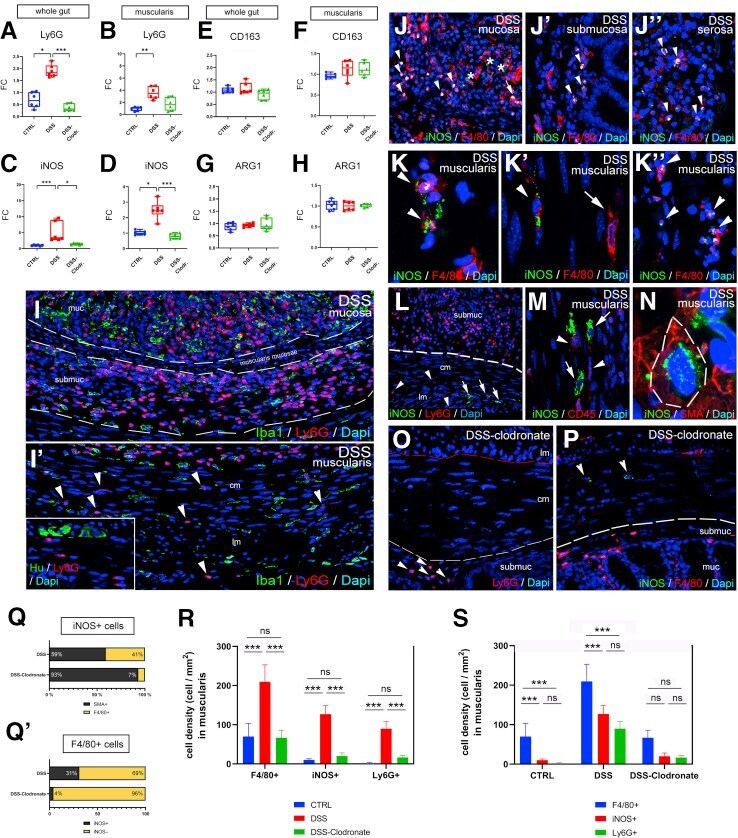
- Figure 8 DSS treatment is associated with neutrophil infiltration and increases expression of iNOS in macrophages and smooth muscle cells in a macrophage-dependent fashion. Graphs show relative RNA expression (fold change, FC) of macrophage and neutrophil markers in whole gut and isolated muscularis samples. Quantitative PCR shows significantly higher expression of neutrophil marker Ly6g in DSS-treated vs control (1.82 vs 0.66, P = .02; A ) and vs DSS+ clodronate treated (1.82 vs 0.31, P < .001; A ) mice in whole gut and DSS-treated vs control (3.47 vs 1.08, P < .001; B ) muscularis. M1-macrophage marker iNOS RNA is significantly overexpressed in DSS-treated vs control (4.24 vs 0.87, P < .001; C ) and vs DSS+ clodronate treated animals (4.24 vs 1.53, P = .045; C ) in whole gut and in muscularis (2.45 vs 0.97, P = .02, and 2.45 vs 0.78, P < .001; D ), respectively. M2-macrophage markers CD163 and ARG1 showed no significant difference ( E-H ). Immunofluorescence shows that in DSS-treated animals, Ly6G+ neutrophils are predominant in the mucosa and submucosa ( I ) but only slightly increased in the muscularis ( I', arrowheads ), where Iba1+ macrophages dominate. Ly6G expression does not co-localize with Iba1 ( I-I' ). In the mucosa, submucosa, and serosa, iNOS is expressed in F4/80+ monocytes ( J-J"", arrowheads ) and occasionally in macrophages ( J, arrow ) and F4/80- cells ( J, asterisk ). In the muscularis, F4/80+ macrophages ( K-K', arrowheads ), monocytes ( K"", arrowheads
- Submitted by
- Invitrogen Antibodies (provider)
- Main image
- Experimental details
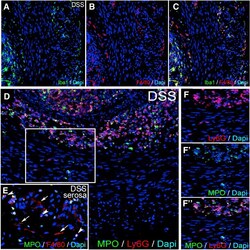
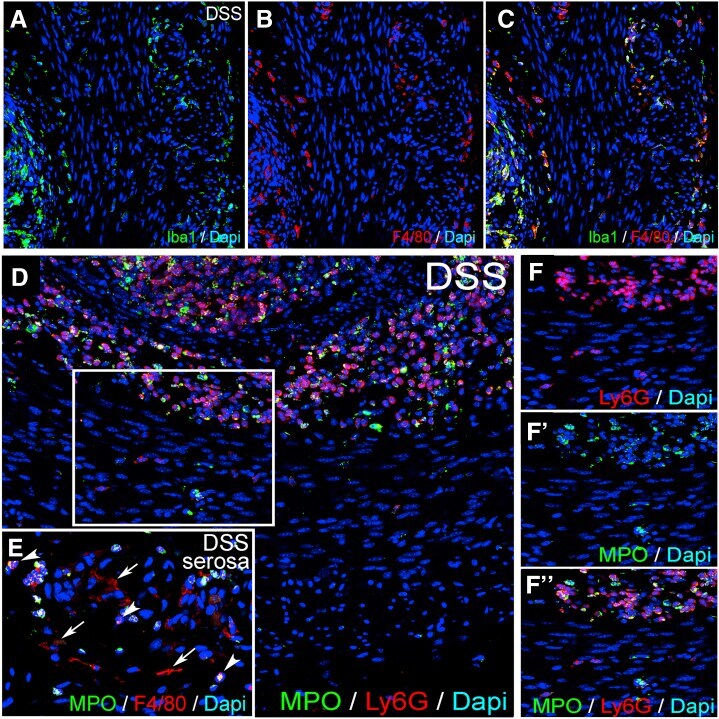
- Figure 9 Iba1 and MPO expression in DSS-treated colon. Expression of Iba1 and F4/80 is co-localized in the colon of a DSS-treated mouse ( A-C ). Expression of MPO overlaps with Ly6G in neutrophils of the mucosa and submucosa ( D ), whereas some Ly6G+ cells in the muscularis propria do not express MPO ( F-F"" ). In the serosa, ramified F4/80+ macrophages are MPO-negative ( E, arrows ), whereas round F4/80+ monocytes express MPO ( E, arrowheads ). MPO, myeloperoxidase.
- Submitted by
- Invitrogen Antibodies (provider)
- Main image
- Experimental details
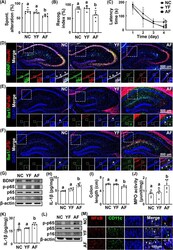
- Fig. 1 Effects of young adult and elderly feces on the occurrence of cognitive impairment and colitis in the transplanted mice. Effects on the occurrence of cognitive impairment in Y-maze ( A ), NOR ( B ), and Barnes maze tasks ( C ). Effects on the BDNF + /NeuN + ( D ), NF-kappaB + /Iba1 + ( E ), and LPS + /Iba1 + cell populations ( F ) in the hippocampus. G Effects on the BDNF expression and NF-kappaB activation in the hippocampus. H Effects on the IL-1beta expression in the hippocampus, assessed by ELISA. Effects on the colon length ( I ), myeloperoxidase (MPO) activity ( J ), IL-1beta expression ( K ), NF-kappaB activation, p16 expression ( L ), and NF-kappaB + /CD11c + cell population ( M ) in the colon. Fecal transplantations of young adults (YF) and elderly people (AF) were orally gavaged once a day for 5 days. Control mice (NC) were treated with vehicle (saline) instead of fecal suspension. Data values were indicated as mean +- SD ( n = 6). Means with the same letters are not significantly different ( p < 0.05). A , B , C , I Kruskal-Wallis test with Dunn's post hoc test for non-parametric analysis. H , J , K One-way ANOVA with post hoc Bonferroni's multiple comparisons test
- Submitted by
- Invitrogen Antibodies (provider)
- Main image
- Experimental details
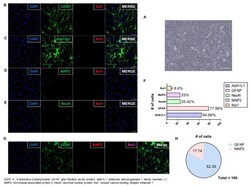
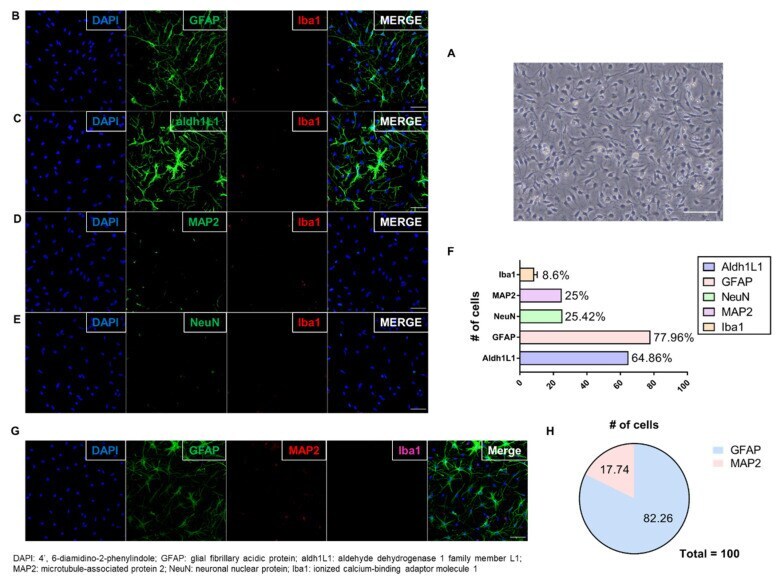
- Figure 2 Verifying the Culture of Astrocytes. ( A ) Differential Interference Contrast microscopy image showing cultured astrocytes with stellate morphology on DIV14 (scale bar: 50 mum); ( B - E ) Dual immunofluorescent image showing that most cells expressed astrocyte markers (GFAP and aldh1L1); fewer expressed Iba1 (microglia), NeuN, and MAP2 (neurons) (scale bar: 50 mum); ( F ) Among every 100 cells, 60-80 expressed astrocyte markers (aldh1L1 or GFAP), and 20 expressed neuronal cell markers (NeuN or MAP2). The remaining cells expressed a microglia marker (Iba1). (No error bar due to one cell type group each); ( G ) Triple immunofluorescent image showing that most cells expressed GFAP (astrocytes); fewer expressed MAP2 (neurons). Expression of Iba1 (microglia) was not detected (scale bar: 50 mum); ( H ) Plots analysis showing similar results to dual staining. Microglia (Iba1) was not plotted because of no detection. The graph shows that the cell culture in this study was dominated by astrocytes.
- Submitted by
- Invitrogen Antibodies (provider)
- Main image

- Experimental details
- Figure 1 Immunofluorescence of a radial section of a human cochlear duct showing the distribution of IBA1 cells. In the spiral prominence, some IBA1 cells almost reach the endolymph. Scanning electron microscopy shows a free cell transitioning a cell border in the human cochlea (upper inset). Reissner's membrane (RM) may also contain macrophages (lower inset). In the SV, IBA1 cells are mostly found in the middle layer close to the blood vessels. No IBA1 cells can be observed in the organ of Corti in this section. I-IV; fibrocytes.

- Submitted by
- Invitrogen Antibodies (provider)
- Main image
- Experimental details
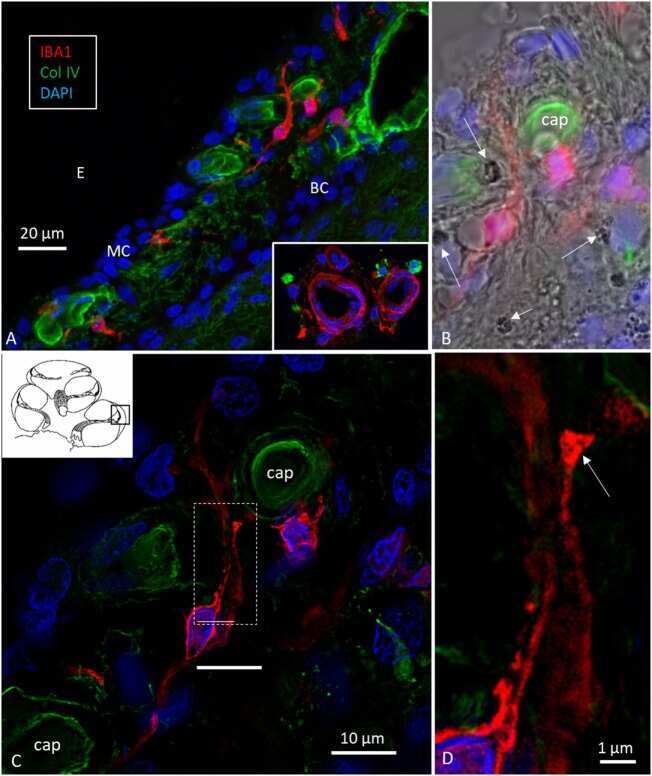
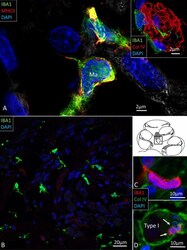
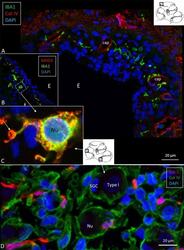
- Figure 4 (A) SR-SIM of IBA1 cells co-expressing MHCII in the human spiral ganglion. IBA1 cells mingle with Schwann cells in a peripheral axonal bundle (inset). (B) Confocal microscopy of several branched IBA1 macrophages is seen in the spiral ganglion. (C) The macrophages have nuclei expressing IBA1 protein. (D) The basal lamina surrounding the satellite cells expresses collagen IV. A macrophage (arrows) is closely related to the satellite glia cell surrounding a type I ganglion cell. The IBA1 cell is seen to cross the basal lamina.
- Submitted by
- Invitrogen Antibodies (provider)
- Main image
- Experimental details
- Fig. 2 Internalization of extracellular Tau in Microglia. a Study of internalization of extracellular Tau monomer and aggregates in the presence of ALA. The treatment was given for 24 h and studied with fluorescence microscopy to understand the internalization of Tau (red) in Iba-1 (green) positive cells. Figure showing fluorescence microscope image, single cell and enlarged panel indicates that the internalized Tau denoted with white arrow marks. The enlarged region is highlighted with white dotted square that indicates internalized area in the cells. Axio observer 7.0 Apotome 2.0 Zeiss microscope was used to the study of internalization extracellular Tau. b Quantification of internalized Tau was carried out with a total intensity of Tau (red) per mum 2 area inside the cell was analyzed by ZEN 2.3 software. The significance was analyzed with Tukey's Kramer, significant when mean difference between treatment groups (X-X') > T (Tukey's criteria). The significance of conditions of Tau monomer and aggregtes with ALA is p < 0.005. annotations used in graph are as follows- CC (Cell control), ALA (alpha-linolenic acid), Mono. (monomer), Agg. (aggregates), Mono. + ALA (monomer plus ALA), Agg. + ALA (aggregates plus ALA)
- Submitted by
- Invitrogen Antibodies (provider)
- Main image
- Experimental details
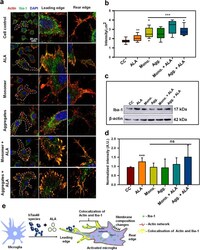
- Fig. 3 Modulation of actin network in activated microglia by ALA. Role of actin and Iba-1 in microglial migration and activation a N9 microglial cells were treated with Tau monomer, aggregates along with ALA for 24 h. After fixation cells were stained with beta-actin (red) and anti-Iba-1 antibody (green). Colocalization of actin and Iba-1 was studied by Super-resolution confocal microscopy. The single cells are marked with white dotted lines in the merged image, scale bar is 20 mum. The migratory microglia are shown with the front; leading edge and rear edge and the colocalization of actin and Iba-1 in the edges assisting the microglia for membrane ruffling and phagocytosis. b The quantification of Iba-1 in cell indicating its activation status and its levels on increased phagocytosis. The increased levels of total intensity per mum 2 area of microglia was calculated with ZEN 2.3 software, significance is ( p < 0.001). c The protein expression of Iba-1 was measured by western blot analysis in all the treated groups after 24 h of treatment and stained with anti-Iba-1 and beta-actin antibody for loading control. d Quantification of the intensity of protein bands from western blot normalized with the beta-actin loading control. The conditions of Tau monomer and aggregtes with ALA are nonsignificant, ( p > 0.05). e Schematic overview of actin remodeling at leading edge of microglia and involvement of Iba-1 in the process of phagocytosis after ALA treatment to cells. The significa

- Submitted by
- Invitrogen Antibodies (provider)
- Main image
- Experimental details
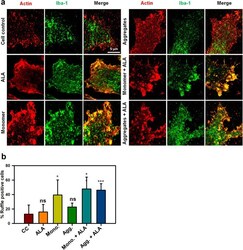
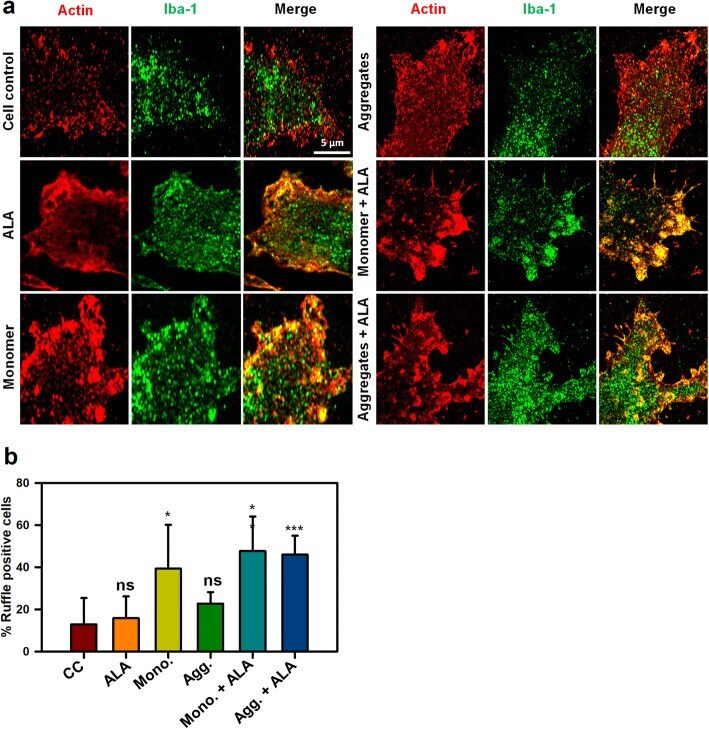
- Fig. 4 Formation of membrane ruffles induced by ALA. Role of actin and Iba-1 in the formation of membrane ruffling was studied upon exposure of ALA. The effect of ALA in membrane ruffling was observed with the super-resolution confocal microscopy. a N9 cells were treated with Tau monomer, aggregates and ALA for 24 h followed by staining with actin and Iba-1 to study the membrane ruffling. The zoom images are indicated with the colocalization of actin and Iba-1 showing membrane ruffling in images. The sacel bar is 5 mum. b The quantification of ruffle positive cells by measuring actin foci per cell were carried out for the percentage calculation. The conditions of Tau monomer and aggregtes with ALA are significant, ( p < 0.005). The significance was analyzed with Tukey's Kramer, significant when mean difference between treatment groups (X-X') > T (Tukey's criteria). The annotations used in graph are as follows- CC (Cell control), ALA (alpha-linolenic acid), Mono. (monomer), Agg. (aggregates), Mono. + ALA (monomer plus ALA), Agg. + ALA (aggregates plus ALA)
- Submitted by
- Invitrogen Antibodies (provider)
- Main image
- Experimental details
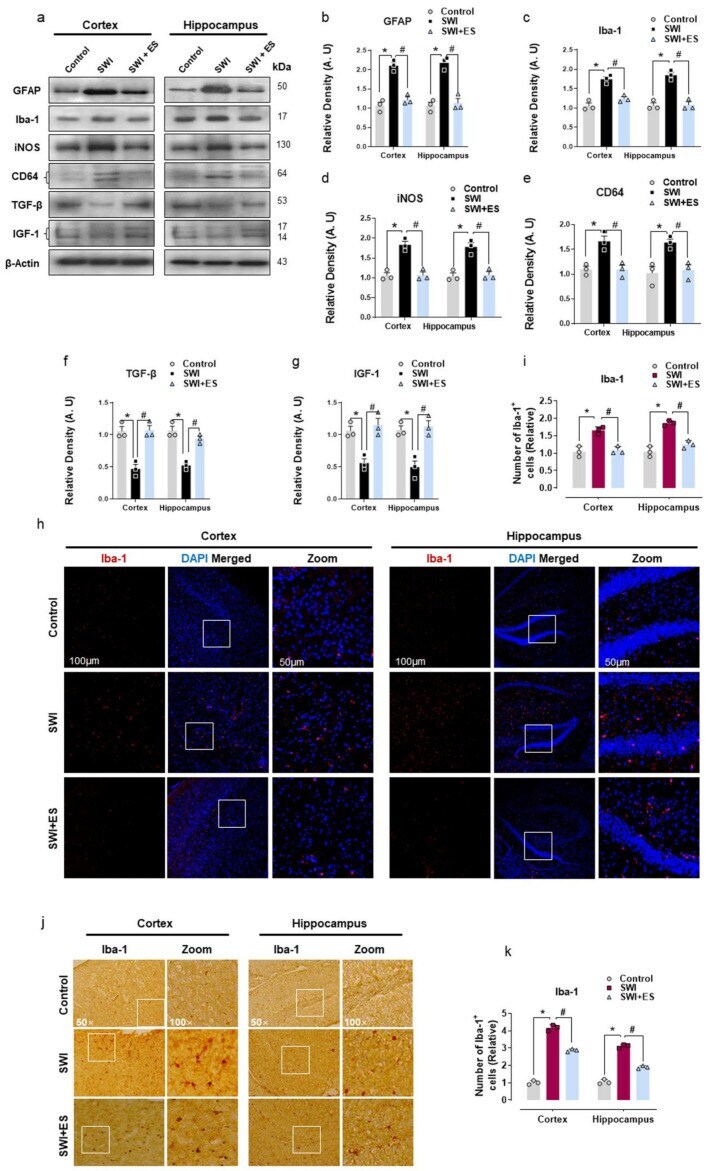
- Figure 2 17-beta estradiol (ES) impedes gliosis and brain inflammation after SWI. ( a - g ) Western blot analysis showing protein expression of GFAP, Iba-1, CD64, TGF-beta, and IGF-1 in the experimental groups. Anti-beta-actin was used as a control for the protein levels across the samples. The densities are expressed in arbitrary units (AU). ( h , i ) Brain section from the experimental animals illustrating Iba-1-positive cells (red) stained with DAPI (blue) of the cortex and DG region, with the respective histogram. ( j , k ) Iba-1 immunostained sections of the cortex and hippocampal-DG region of the experimental groups with respective histograms. Values are presented as means +- S.E.M. The data presented are relative to the control group. p -value < 0.05 was considered significant. * p < 0.05 vs. control group, # p < 0.05 vs. SWI + 17-beta estradiol group. Bar = 50 mum. Statistical significance was determined by one-way analysis of variance (ANOVA) followed by Tukey's post-hoc analysis using the GraphPad Prism (ver. 8.0.2) software.
- Submitted by
- Invitrogen Antibodies (provider)
- Main image
- Experimental details
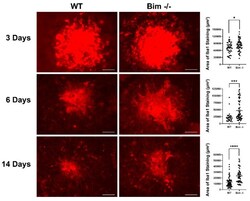
- Global lack of Bim expression increased Iba1-positive cells. Wild-type and Bim -/- mice (3-month-old) underwent laser photocoagulation, and the RPE/choroid was harvested 3, 6, and 14 days later. The RPE/choroid was wholemount stained with anti-Iba1 and the positive staining area was quantified. Each point represents one laser spot. These experiments were repeated with at least 8 mice from each genotype. Scale bar = 100 um. (* p < 0.05, *** p < 0.001, **** p < 0.0001).

- Submitted by
- Invitrogen Antibodies (provider)
- Main image

- Experimental details
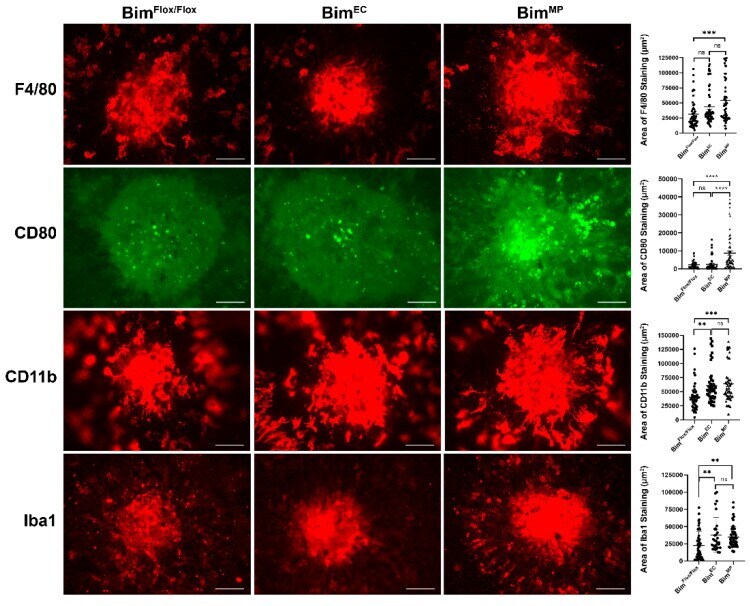
- Mice conditionally lacking Bim expression in MPs have decreased resolution of F4/80-, CD80-, CD11b-, and Iba1-positive cells. To assess the role Bim expression plays in moderating the immune response during CNV, 3-month-old Bim Flox/Flox , Bim EC , and Bim MP mice underwent laser photocoagulation. Six days later, the RPE/choroid was wholemount stained with anti-F4/80, anti-CD80, anti-CD11b, or anti-Iba1, and the area of positive staining was quantified (on the right). Each point represents one laser spot. Experiments were performed with at least 8 mice for each condition. Scale bar = 100 um. (ns; not significant; **** p < 0.0001, *** p < 0.001, ** p < 0.01).
- Submitted by
- Invitrogen Antibodies (provider)
- Main image
- Experimental details
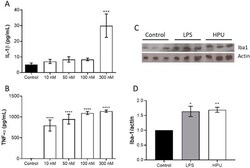
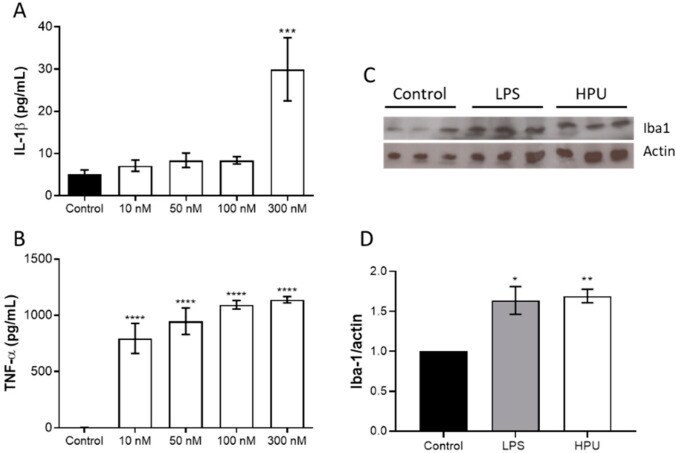
- Microglial activation by HPU. For detection of cytokine expression, BV-2 cells were incubated for 6 h with HPU, and cultures' supernatants were collected for detection of IL-1beta panel ( A ) and TNF-alpha panel ( B ) by ELISA. The data (mean +- SEM) were analyzed by one-way parametric ANOVA with a Dunnett post-test. *** p < 0.001, **** p < 0.0001 vs. control. Panels ( C , D ): Iba1 levels in brain homogenates of HPU-treated rats were analyzed by Western blots ( C ), and quantified by densitometry ( D ). The data (mean +- SEM) were analyzed by one-way ANOVA followed by Bonferroni post hoc test. * p < 0.05, ** p < 0.01 vs. controls. All data were normalized against the endogenous actin content.
- Submitted by
- Invitrogen Antibodies (provider)
- Main image
- Experimental details
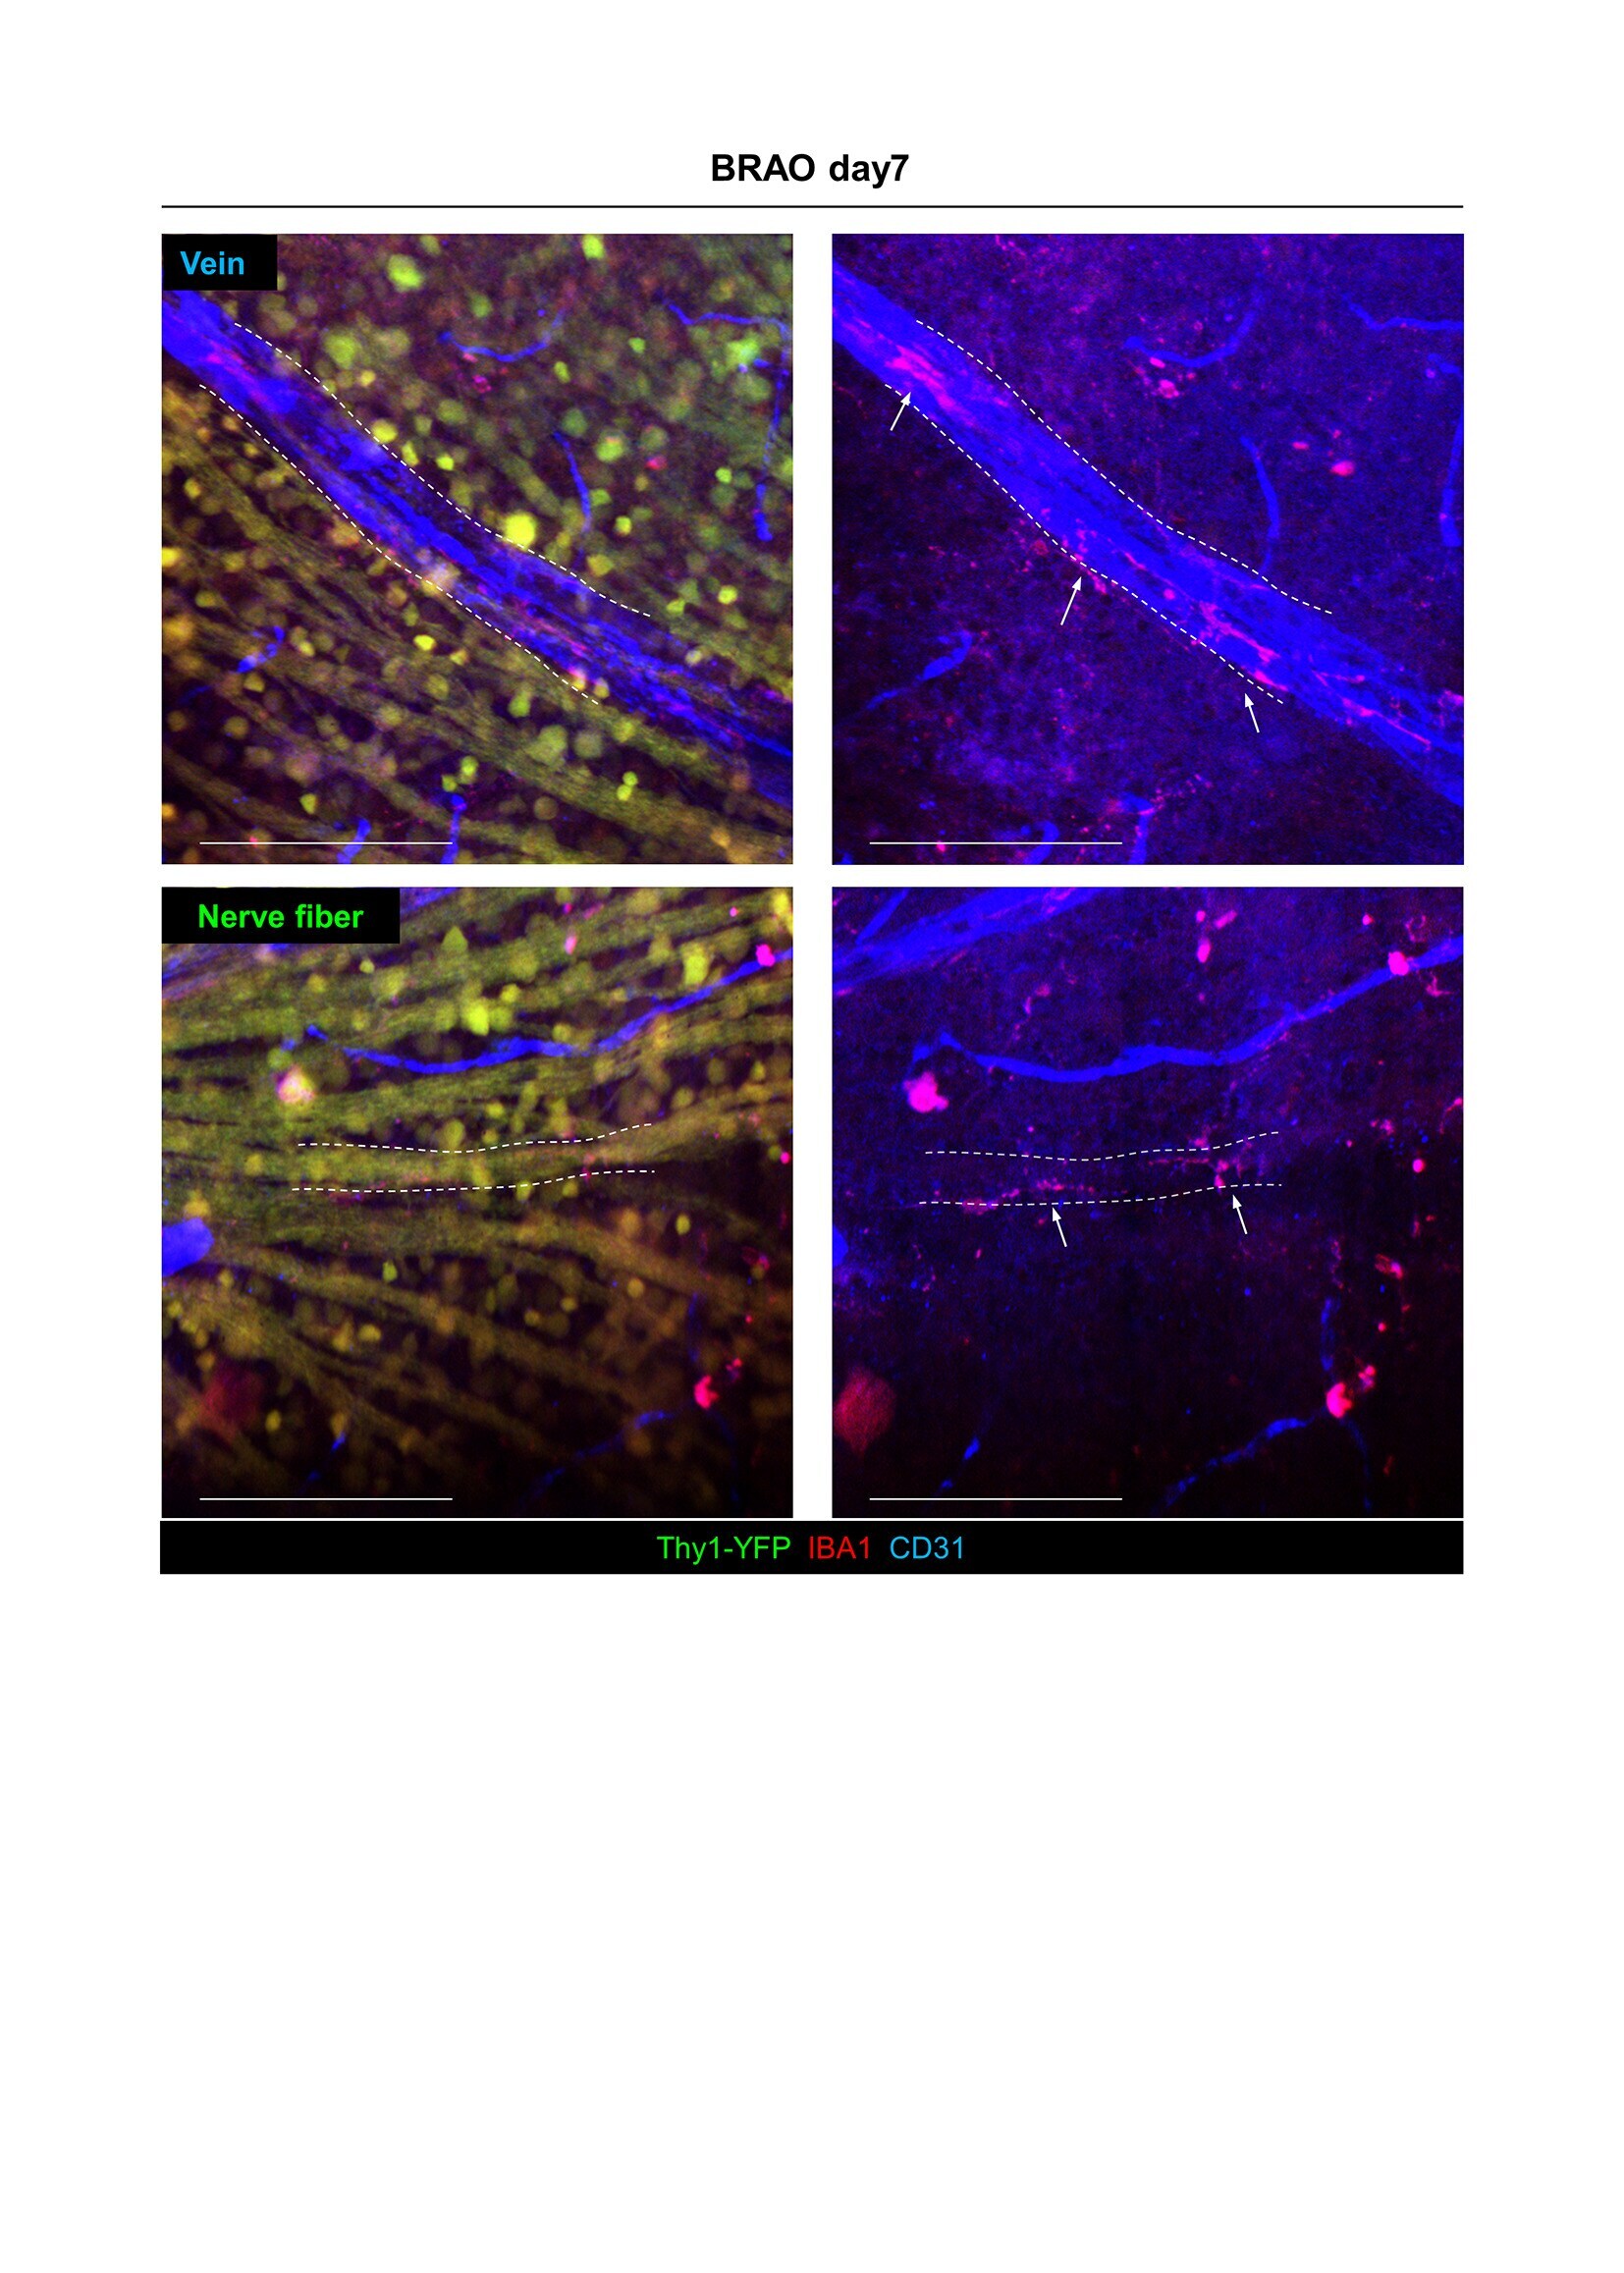
- Supplementary Figure 2 Microglial recruitment through optic nerve and vein in BRAO modeling. Arrow indicated the retinal microglia. Vascular endothelial cells were stained by CD31 antibody and microglia were stained by IBA-1 antibody. Scale bars : 100 mum. BRAO, branch retinal artery occlusion. Click here for additional data file.
- Submitted by
- Invitrogen Antibodies (provider)
- Main image
- Experimental details
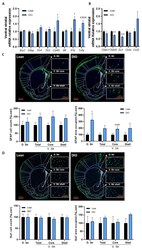
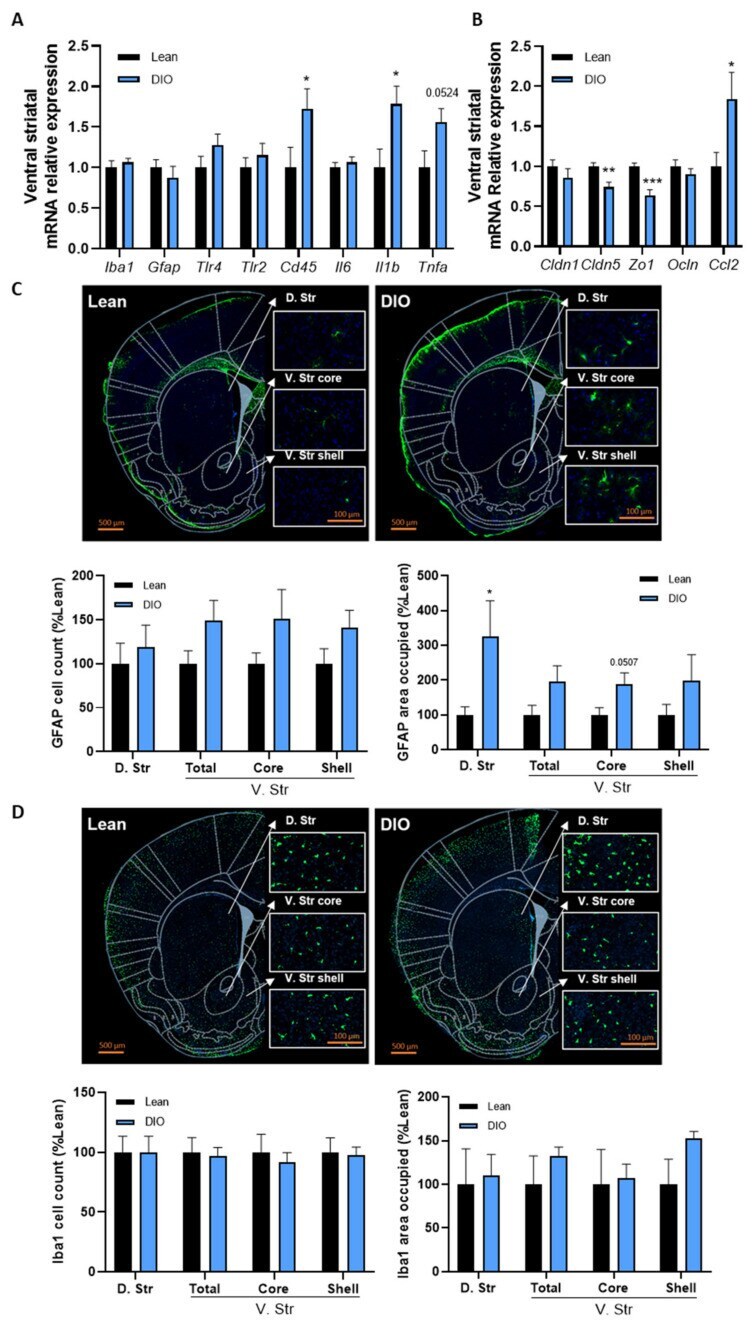
- Obesity is associated with inflammation and blood-brain barrier alterations in the striatum. ( A ) Ventral striatal mRNA relative expression of ionized calcium-binding adapter ( Iba1 ), glial fibrillary acidic protein ( Gfap ), toll-like receptor 4 ( Tlr4 ), toll-like receptor 2 ( Tlr2 ) cluster of differenciation 45 ( Cd45 ), interleukin 6 ( Il6 ), interleukin 1 beta ( Il1b ) and tumor necrosis factor alpha ( Tnfa ) and ( B ) claudin-1 ( Cldn1 ), claudin-5 ( Cldn5 ), zonula occludens 1 ( Zo1 ), occludin ( Ocln ) and C-C chemokine ligand 2 ( Ccl2 ) measured by real-time qPCR in lean and DIO mice. ( n = 9-10/group). ( C ) Representative immunofluorescence of the dorsal striatum (D. Str), the ventral striatum (V. Str) total, core and shell and quantification of both the area occupied by astrocytes cells and the GFAP+ cells in these regions of lean and DIO mice ( n = 4-5/group). ( D ) Representative immunofluorescence of the dorsal striatum (D. Str), the ventral striatum (V. Str) total, core and shell and quantification of both the area occupied by microglial cells and the Iba1+ cells in these regions of lean and DIO mice ( n = 5/group). Data are shown as mean +- SEM. p -values were obtained after unpaired Student's t -test or non-parametric Mann-Whitney test. *: p -value < 0.05; **: p -value < 0.01; ***: p -value < 0.001 between lean vs. DIO.
- Submitted by
- Invitrogen Antibodies (provider)
- Main image
- Experimental details
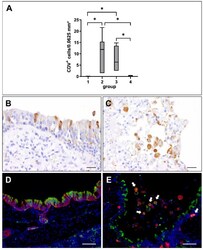
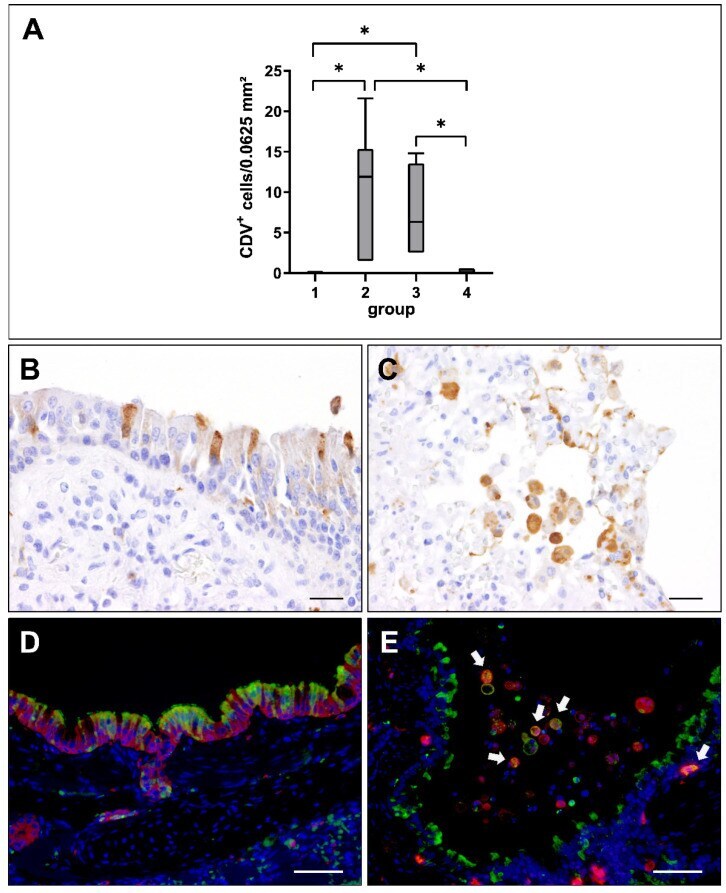
- Canine distemper virus (CDV) loads and distribution in the lung. ( A ) Quantification of CDV antigen at different phases of infection. Note significant increase of CDV loads in the acute (group 2) and subacute infection phase (group 3), followed by a decrease in the subacute-chronic phase (group 4). Groups: 1 = non-infected controls; 2 = acute CDV infection; 3 = subacute CDV infection; 4 = subacute-chronic CDV infection; box and whisker plots display median and quartiles with maximum and minimum values. Significant differences ( p
- Submitted by
- Invitrogen Antibodies (provider)
- Main image
- Experimental details
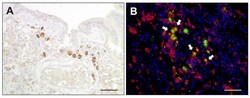
- Figure 9 TNF-alpha expression in canine distemper virus-infected lungs. ( A ) Detection of TNF-alpha in mononuclear cells by immunohistochemistry. ( B ) Double immunofluorescence labeling against TNF-alpha (green) and Iba-1 (red) confirmed histiocytic cells (arrows) as a source of TNF-alpha. Nuclei were counterstained with bisbenzimide (blue). Scale bars: 50 um.

- Submitted by
- Invitrogen Antibodies (provider)
- Main image
- Experimental details
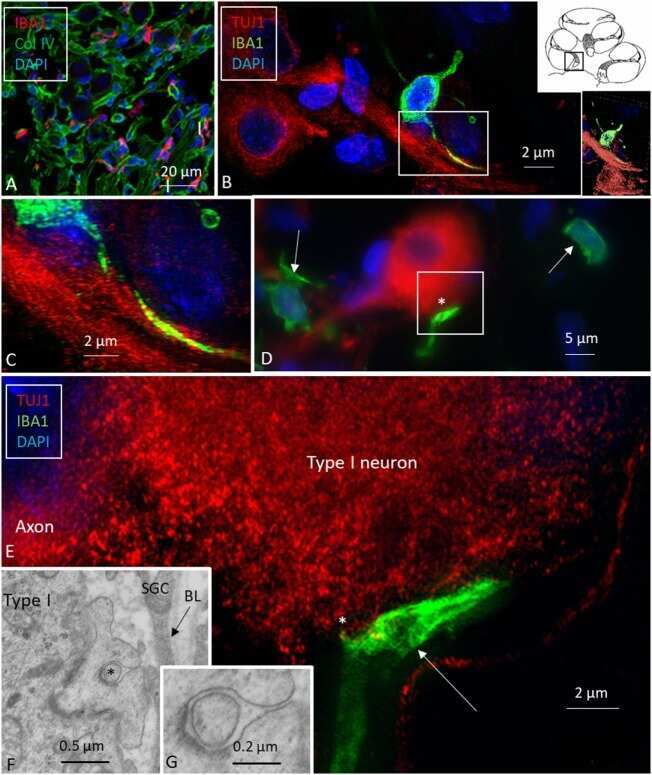
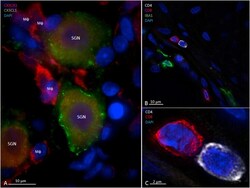
- Fig. 3 CX3CR1-and CX3CL1-immunohistochemistry of human spiral ganglion (A) and CD4 - , CD8 - and IBA1-immunohistochemistry of human cochlear modiolus (B and C). In A), spiral ganglion neurons (SGN) express CX3CL1 (Fractalkine) more intense in their perikaryon surface. The receptor CX3CR1-immunostaining appears diffuse in the cytoplasm of both cell bodies (MF) and processes that look like macrophages. B shows several immune cells located along the wall of scala tympani in the modiolus. Two cells positive for CD4 and CD8 respectively are magnified in B); super-resolution SIM microscopy reveals a close relation between these two cells. Fig. 3

- Submitted by
- Invitrogen Antibodies (provider)
- Main image
- Experimental details
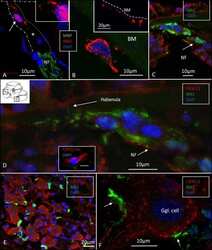
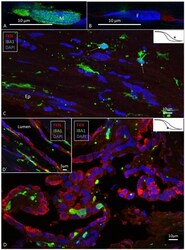
- Figure 2 SR-SIM (A,B) and confocal fluorescence microscopy (C,D) of the human ES. (A,B) show the difference in nuclear expression of IBA1 protein in macrophages (A) and fibrocytes (B) in the peri-saccular tissue. (C) The sub-epithelial tissue in the intraosseous part of the ES displays a large number of variously shaped IBA1-positive cells. In two of these cells (arrows), the typical nuclear staining can be seen. Several thin cross-sectioned ramifications of IBA1 cells are visible. (D) The epithelium also contains a large number of IBA1 cells, located both between and beneath epithelial cells (inset D' ). The epithelial cells express the chemokine fractalkine. * Shows location in the ES.
- Submitted by
- Invitrogen Antibodies (provider)
- Main image
- Experimental details
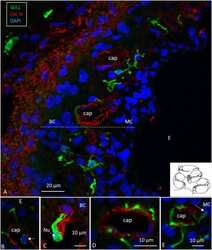
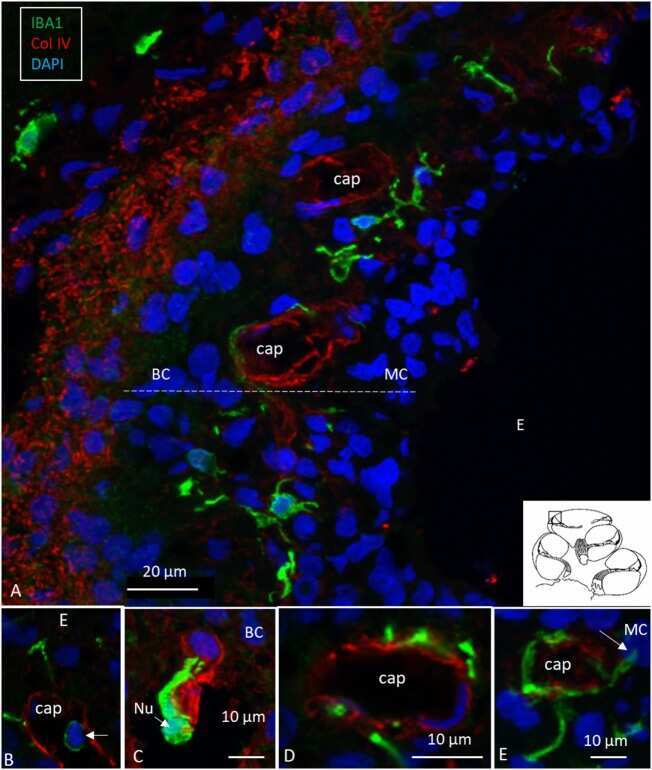
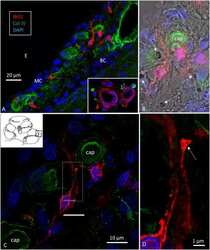
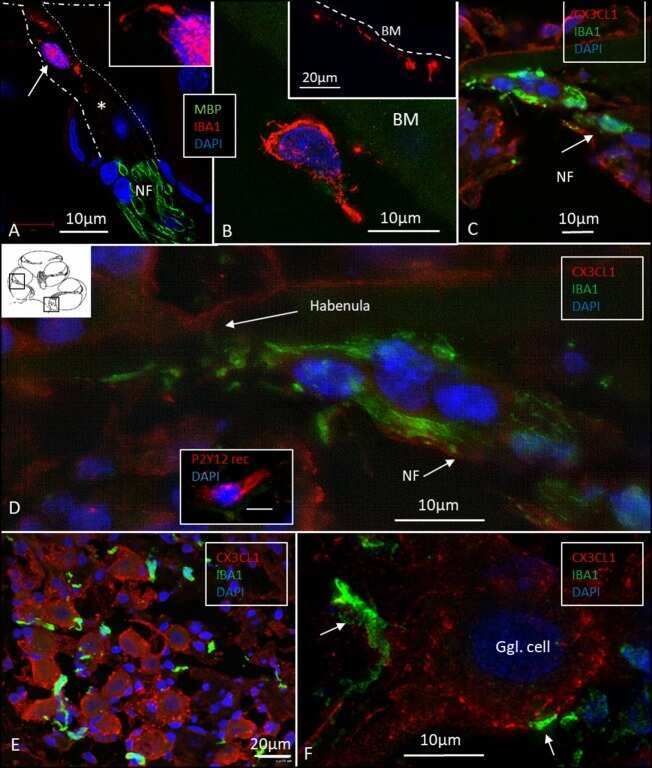
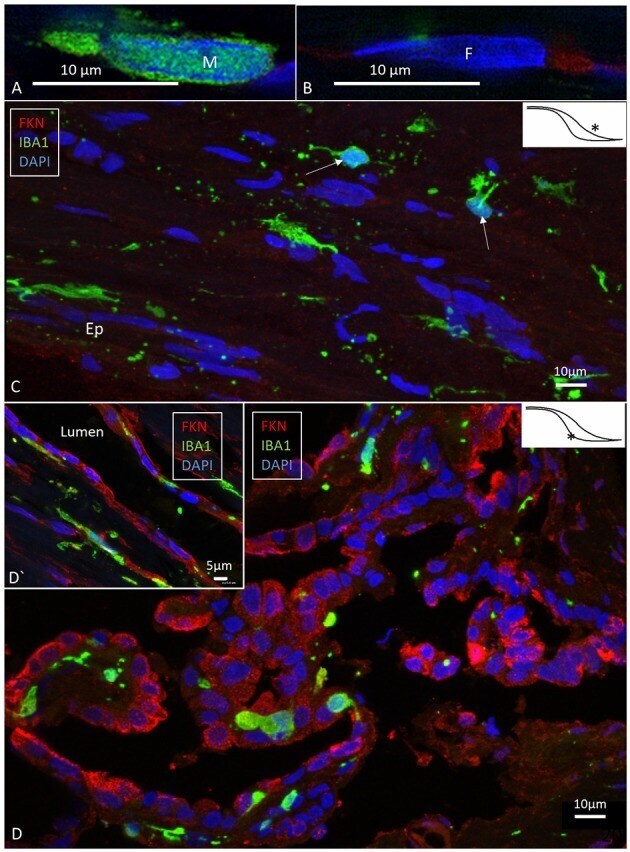
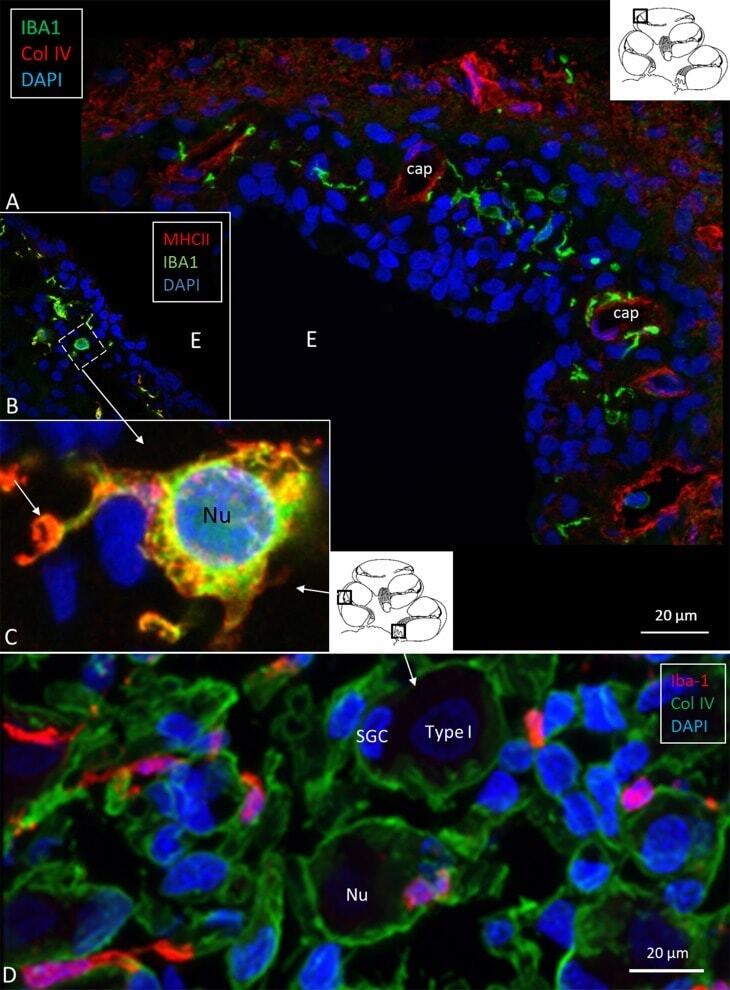
- Figure 3 (A) Immunofluorescence of IBA1 and collagen IV in the lateral wall of the apical turn of the human cochlea. Many perivascular IBA1 cells are seen in the StV and few in the spiral ligament. (B) Confocal microscopy of the human StV. Framed area is magnified in (C) . (C) SR-SIM of framed area in B. Cell co-express IBA1 and MHCII. The cell membrane expresses MHCII as well as cytoplasmic vesicles [ (B,C) from Kampfe-Nordstrom et al. ( 12 )]. (D) Confocal microscopy of spiral ganglion with several surrounding IBA1 cells. SGC, satellite glial cell; Nu, type I cell nucleus; Col. IV, collagen IV; cap, capillary; E, endolymph.
- Submitted by
- Invitrogen Antibodies (provider)
- Main image
- Experimental details
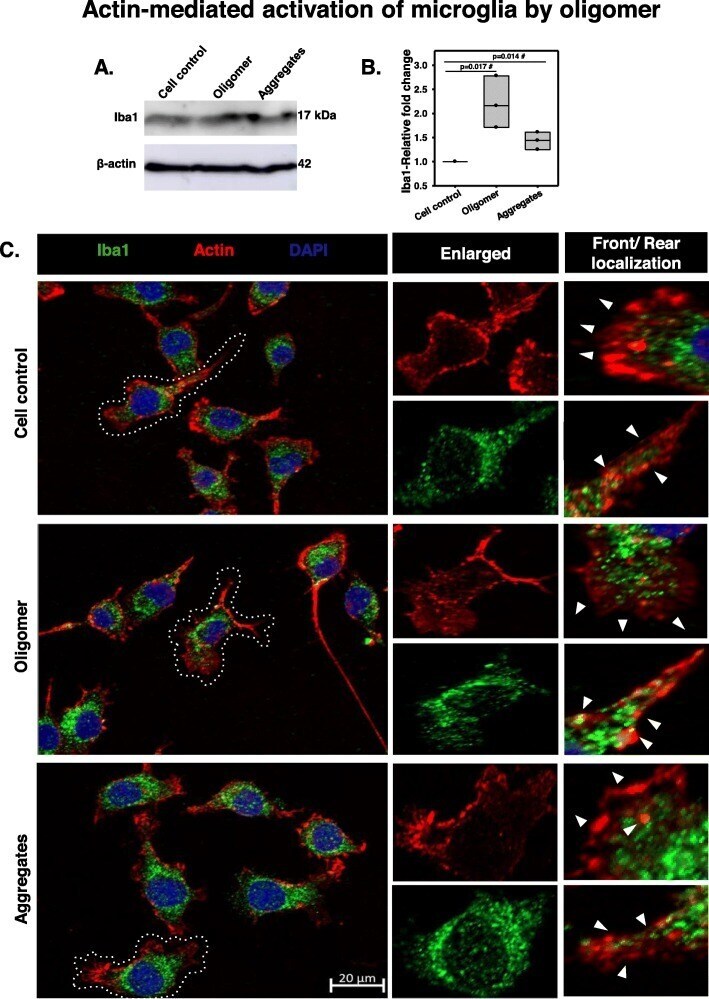
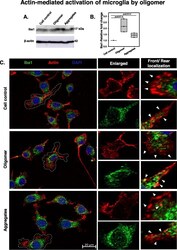
- Fig. 5 Actin-mediated activation of microglia by Tau oligomers. a , b N9 microglia showed an increased level of Iba1 in hTau40 WT oligomer-treated group as compared to aggregate exposure by western blot. Significant at the mean difference between treatment groups (X - X`) > Tukey's criterion (T). The # sign corresponds to non-significant by Tukey's test. c The immunostaining study revealed the accumulation of Iba1 with remodeled actin structures at the rear end of activated migratory microglia. The localization of Iba1 at the rear site of microglia may emphasize the contraction of the actin network for mediating forward movements during migration. The ""arrow"" has represented the migratory direction in front ends and the retraction of actin structures containing Iba1 from rear ends in N9 cells