Explore
 Validate
 Learn
Learn12-5888-42
antibody from Invitrogen Antibodies
Targeting: PDCD1LG2
B7-DC, bA574F11.2, Btdc, CD273, PD-L2, PDL2
 Flow cytometry
Antibody data
- Antibody Data
- Antigen structure
- References [21]
- Comments [0]
- Validations
- Flow cytometry [1]
- Other assay [8]
Submit
Validation data
Reference
Comment
Report error
- Product number
- 12-5888-42 - Provider product page

- Provider
- Invitrogen Antibodies
- Product name
- CD273 (B7-DC) Monoclonal Antibody (MIH18), PE, eBioscience™
- Antibody type
- Monoclonal
- Antigen
- Other
- Description
- Description: The MIH18 monoclonal antibody reacts with human B7-DC, also known as PD-L2. B7-DC, a recently identified member of the B7 family, has a predicted molecular weight of approximately 25 kDa and belongs to the Ig superfamily. B7-DC is primarily expressed by subpopulations of dendritic cells and monocytes/macrophages. Although B7-DC has structural and sequence similarities to the B7 family, it does not bind CD28/CTLA-4, rather it is a ligand for PD-1. The interactions between PD-1 and B7-DC/PD-L2 have been reported to be involved in costimulation or suppression of T cell proliferation depending on state of cellular activation. MIH18 is a useful tool for studies to elucidate the exact function of B7-DC/PD-L2 in APC/T cell interaction and to characterize the expression pattern of this molecule in humans. MIH18 is a blocking antibody. Applications Reported: The MIH18 antibody has been reported for use in flow cytometric analysis. Applications Tested: This MIH18 antibody has been pre-titrated and tested by flow cytometric analysis of mature dendritic cells and normal human peripheral blood cells. This can be used at 5 µL (0.125 µg) per test. A test is defined as the amount (µg) of antibody that will stain a cell sample in a final volume of 100 µL. Cell number should be determined empirically but can range from 10^5 to 10^8 cells/test. Excitation: 488-561 nm; Emission: 578 nm; Laser: Blue Laser, Green Laser, Yellow-Green Laser. Filtration: 0.2 µm post-manufacturing filtered.
- Reactivity
- Human
- Host
- Mouse
- Conjugate
- Yellow dye
- Isotype
- IgG
- Antibody clone number
- MIH18
- Vial size
- 100 Tests
- Concentration
- 5 µL/Test
- Storage
- 4° C, store in dark, DO NOT FREEZE!
Submitted references Inhibition of PI3Kδ Differentially Regulates Poly I:C- and Human Metapneumovirus-Induced PD-L1 and PD-L2 Expression in Human Bronchial Epithelial Cells.
T cells drive negative feedback mechanisms in cancer associated fibroblasts, promoting expression of co-inhibitory ligands, CD73 and IL-27 in non-small cell lung cancer.
TLR9 Mediated Tumor-Stroma Interactions in Human Papilloma Virus (HPV)-Positive Head and Neck Squamous Cell Carcinoma Up-Regulate PD-L1 and PD-L2.
EWS-FLI1 low Ewing sarcoma cells demonstrate decreased susceptibility to T-cell-mediated tumor cell apoptosis.
Osteosarcoma cell intrinsic PD-L2 signals promote invasion and metastasis via the RhoA-ROCK-LIMK2 and autophagy pathways.
PD-1 axis expression in musculoskeletal tumors and antitumor effect of nivolumab in osteosarcoma model of humanized mouse.
PD-L1 expression in medulloblastoma: an evaluation by subgroup.
Butyrate Conditions Human Dendritic Cells to Prime Type 1 Regulatory T Cells via both Histone Deacetylase Inhibition and G Protein-Coupled Receptor 109A Signaling.
CD64-directed microtubule associated protein tau kills leukemic blasts ex vivo.
Cervical (pre)neoplastic microenvironment promotes the emergence of tolerogenic dendritic cells via RANKL secretion.
Paucity of PD-L1 expression in prostate cancer: innate and adaptive immune resistance.
Brugia malayi microfilariae induce a regulatory monocyte/macrophage phenotype that suppresses innate and adaptive immune responses.
HIV-1 Tat protein induces PD-L1 (B7-H1) expression on dendritic cells through tumor necrosis factor alpha- and toll-like receptor 4-mediated mechanisms.
Phagocytosis, a potential mechanism for myeloid-derived suppressor cell regulation of CD8+ T cell function mediated through programmed cell death-1 and programmed cell death-1 ligand interaction.
Programmed death ligand 1 is expressed by non-hodgkin lymphomas and inhibits the activity of tumor-associated T cells.
Transfer of regulatory properties from tolerogenic to proinflammatory dendritic cells via induced autoreactive regulatory T cells.
Increase of programmed death-1-expressing intratumoral CD8 T cells predicts a poor prognosis for nasopharyngeal carcinoma.
Major depletion of plasmacytoid dendritic cells in HIV-2 infection, an attenuated form of HIV disease.
PD-1 is a regulator of NY-ESO-1-specific CD8+ T cell expansion in melanoma patients.
TLR-mediated induction of negative regulatory ligands on dendritic cells.
No evidence for dualism in function and receptors: PD-L2/B7-DC is an inhibitory regulator of human T cell activation.
Ogawa T, Kan-O K, Shiota A, Fujita A, Ishii Y, Fukuyama S, Matsumoto K
Frontiers in immunology 2021;12:767666
Frontiers in immunology 2021;12:767666
T cells drive negative feedback mechanisms in cancer associated fibroblasts, promoting expression of co-inhibitory ligands, CD73 and IL-27 in non-small cell lung cancer.
O'Connor RA, Chauhan V, Mathieson L, Titmarsh H, Koppensteiner L, Young I, Tagliavini G, Dorward DA, Prost S, Dhaliwal K, Wallace WA, Akram AR
Oncoimmunology 2021;10(1):1940675
Oncoimmunology 2021;10(1):1940675
TLR9 Mediated Tumor-Stroma Interactions in Human Papilloma Virus (HPV)-Positive Head and Neck Squamous Cell Carcinoma Up-Regulate PD-L1 and PD-L2.
Baruah P, Bullenkamp J, Wilson POG, Lee M, Kaski JC, Dumitriu IE
Frontiers in immunology 2019;10:1644
Frontiers in immunology 2019;10:1644
EWS-FLI1 low Ewing sarcoma cells demonstrate decreased susceptibility to T-cell-mediated tumor cell apoptosis.
Bailey KM, Julian CM, Klinghoffer AN, Bernard H, Lucas PC, McAllister-Lucas LM
Oncotarget 2019 May 21;10(36):3385-3399
Oncotarget 2019 May 21;10(36):3385-3399
Osteosarcoma cell intrinsic PD-L2 signals promote invasion and metastasis via the RhoA-ROCK-LIMK2 and autophagy pathways.
Ren T, Zheng B, Huang Y, Wang S, Bao X, Liu K, Guo W
Cell death & disease 2019 Mar 18;10(4):261
Cell death & disease 2019 Mar 18;10(4):261
PD-1 axis expression in musculoskeletal tumors and antitumor effect of nivolumab in osteosarcoma model of humanized mouse.
Zheng B, Ren T, Huang Y, Sun K, Wang S, Bao X, Liu K, Guo W
Journal of hematology & oncology 2018 Feb 6;11(1):16
Journal of hematology & oncology 2018 Feb 6;11(1):16
PD-L1 expression in medulloblastoma: an evaluation by subgroup.
Martin AM, Nirschl CJ, Polanczyk MJ, Bell WR, Nirschl TR, Harris-Bookman S, Phallen J, Hicks J, Martinez D, Ogurtsova A, Xu H, Sullivan LM, Meeker AK, Raabe EH, Cohen KJ, Eberhart CG, Burger PC, Santi M, Taube JM, Pardoll DM, Drake CG, Lim M
Oncotarget 2018 Apr 10;9(27):19177-19191
Oncotarget 2018 Apr 10;9(27):19177-19191
Butyrate Conditions Human Dendritic Cells to Prime Type 1 Regulatory T Cells via both Histone Deacetylase Inhibition and G Protein-Coupled Receptor 109A Signaling.
Kaisar MMM, Pelgrom LR, van der Ham AJ, Yazdanbakhsh M, Everts B
Frontiers in immunology 2017;8:1429
Frontiers in immunology 2017;8:1429
CD64-directed microtubule associated protein tau kills leukemic blasts ex vivo.
Mladenov R, Hristodorov D, Cremer C, Gresch G, Grieger E, Schenke L, Klose D, Amoury M, Woitok M, Jost E, Brümmendorf TH, Fendel R, Fischer R, Stein C, Thepen T, Barth S
Oncotarget 2016 Oct 11;7(41):67166-67174
Oncotarget 2016 Oct 11;7(41):67166-67174
Cervical (pre)neoplastic microenvironment promotes the emergence of tolerogenic dendritic cells via RANKL secretion.
Demoulin SA, Somja J, Duray A, Guénin S, Roncarati P, Delvenne PO, Herfs MF, Hubert PM
Oncoimmunology 2015 Jun;4(6):e1008334
Oncoimmunology 2015 Jun;4(6):e1008334
Paucity of PD-L1 expression in prostate cancer: innate and adaptive immune resistance.
Martin AM, Nirschl TR, Nirschl CJ, Francica BJ, Kochel CM, van Bokhoven A, Meeker AK, Lucia MS, Anders RA, DeMarzo AM, Drake CG
Prostate cancer and prostatic diseases 2015 Dec;18(4):325-32
Prostate cancer and prostatic diseases 2015 Dec;18(4):325-32
Brugia malayi microfilariae induce a regulatory monocyte/macrophage phenotype that suppresses innate and adaptive immune responses.
O'Regan NL, Steinfelder S, Venugopal G, Rao GB, Lucius R, Srikantam A, Hartmann S
PLoS neglected tropical diseases 2014 Oct;8(10):e3206
PLoS neglected tropical diseases 2014 Oct;8(10):e3206
HIV-1 Tat protein induces PD-L1 (B7-H1) expression on dendritic cells through tumor necrosis factor alpha- and toll-like receptor 4-mediated mechanisms.
Planès R, BenMohamed L, Leghmari K, Delobel P, Izopet J, Bahraoui E
Journal of virology 2014 Jun;88(12):6672-89
Journal of virology 2014 Jun;88(12):6672-89
Phagocytosis, a potential mechanism for myeloid-derived suppressor cell regulation of CD8+ T cell function mediated through programmed cell death-1 and programmed cell death-1 ligand interaction.
Kim YJ, Park SJ, Broxmeyer HE
Journal of immunology (Baltimore, Md. : 1950) 2011 Sep 1;187(5):2291-301
Journal of immunology (Baltimore, Md. : 1950) 2011 Sep 1;187(5):2291-301
Programmed death ligand 1 is expressed by non-hodgkin lymphomas and inhibits the activity of tumor-associated T cells.
Andorsky DJ, Yamada RE, Said J, Pinkus GS, Betting DJ, Timmerman JM
Clinical cancer research : an official journal of the American Association for Cancer Research 2011 Jul 1;17(13):4232-44
Clinical cancer research : an official journal of the American Association for Cancer Research 2011 Jul 1;17(13):4232-44
Transfer of regulatory properties from tolerogenic to proinflammatory dendritic cells via induced autoreactive regulatory T cells.
Kleijwegt FS, Laban S, Duinkerken G, Joosten AM, Koeleman BP, Nikolic T, Roep BO
Journal of immunology (Baltimore, Md. : 1950) 2011 Dec 15;187(12):6357-64
Journal of immunology (Baltimore, Md. : 1950) 2011 Dec 15;187(12):6357-64
Increase of programmed death-1-expressing intratumoral CD8 T cells predicts a poor prognosis for nasopharyngeal carcinoma.
Hsu MC, Hsiao JR, Chang KC, Wu YH, Su IJ, Jin YT, Chang Y
Modern pathology : an official journal of the United States and Canadian Academy of Pathology, Inc 2010 Oct;23(10):1393-403
Modern pathology : an official journal of the United States and Canadian Academy of Pathology, Inc 2010 Oct;23(10):1393-403
Major depletion of plasmacytoid dendritic cells in HIV-2 infection, an attenuated form of HIV disease.
Cavaleiro R, Baptista AP, Soares RS, Tendeiro R, Foxall RB, Gomes P, Victorino RM, Sousa AE
PLoS pathogens 2009 Nov;5(11):e1000667
PLoS pathogens 2009 Nov;5(11):e1000667
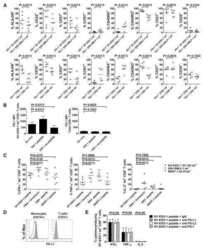
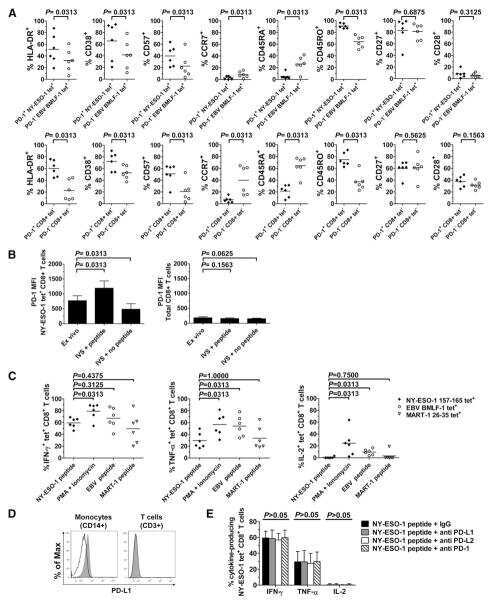
PD-1 is a regulator of NY-ESO-1-specific CD8+ T cell expansion in melanoma patients.
Fourcade J, Kudela P, Sun Z, Shen H, Land SR, Lenzner D, Guillaume P, Luescher IF, Sander C, Ferrone S, Kirkwood JM, Zarour HM
Journal of immunology (Baltimore, Md. : 1950) 2009 May 1;182(9):5240-9
Journal of immunology (Baltimore, Md. : 1950) 2009 May 1;182(9):5240-9
TLR-mediated induction of negative regulatory ligands on dendritic cells.
Gröschel S, Piggott KD, Vaglio A, Ma-Krupa W, Singh K, Goronzy JJ, Weyand CM
Journal of molecular medicine (Berlin, Germany) 2008 Apr;86(4):443-55
Journal of molecular medicine (Berlin, Germany) 2008 Apr;86(4):443-55
No evidence for dualism in function and receptors: PD-L2/B7-DC is an inhibitory regulator of human T cell activation.
Pfistershammer K, Klauser C, Pickl WF, Stöckl J, Leitner J, Zlabinger G, Majdic O, Steinberger P
European journal of immunology 2006 May;36(5):1104-13
European journal of immunology 2006 May;36(5):1104-13
No comments: Submit comment
Supportive validation
- Submitted by
- Invitrogen Antibodies (provider)
- Main image
- Experimental details
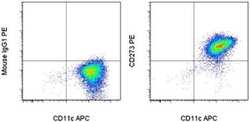
- Staining of human monocyte-derived dendritic cells with Anti-Human CD11c APC (Product # 17-0116-42) and Mouse IgG1 K Isotype Control PE (Product # 12-4714-81) (left) or Anti-Human CD273 (B7-DC) PE (right). Cells in the large scatter population were used for analysis.
- Conjugate
- Yellow dye

Supportive validation
- Submitted by
- Invitrogen Antibodies (provider)
- Main image
- Experimental details
- NULL
- Conjugate
- Yellow dye
- Submitted by
- Invitrogen Antibodies (provider)
- Main image
- Experimental details
- NULL
- Conjugate
- Yellow dye
- Submitted by
- Invitrogen Antibodies (provider)
- Main image
- Experimental details
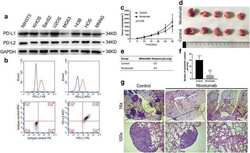
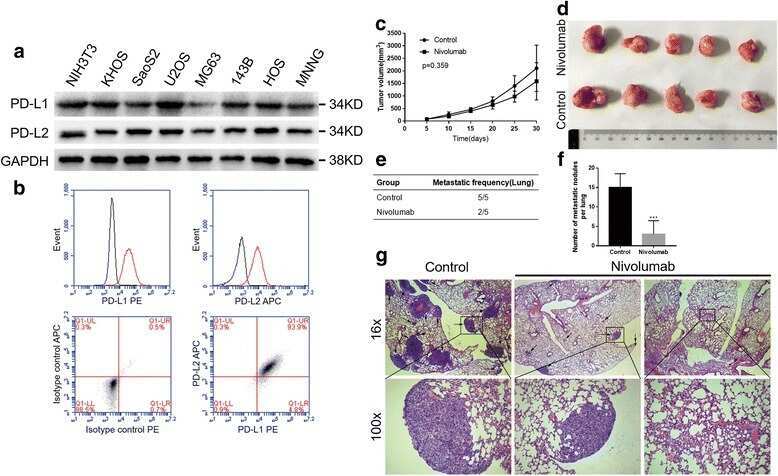
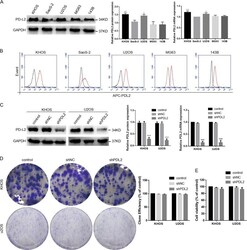
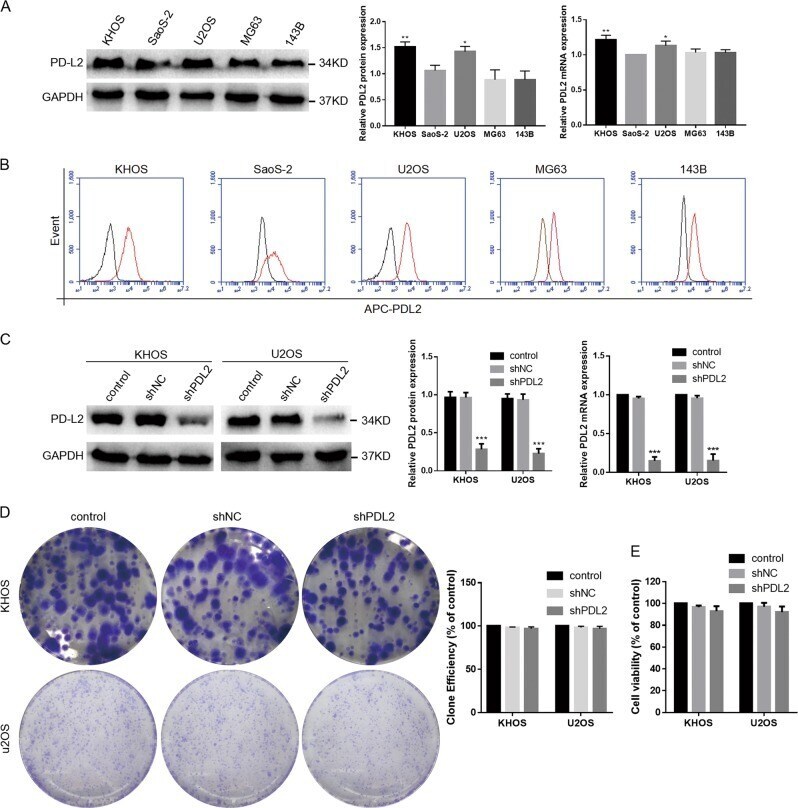
- Fig. 2 Effect of PD-L2 expression on the proliferation of osteosarcoma cells. a PD-L2 expression in osteosarcoma cell lines was evaluated by western blotting and real-time PCR. b The osteosarcoma cell lines (red) exhibited differing degrees of PD-L2 expression compared with the isotype control (black) by flow cytometry. c KHOS and U2OS cells were stably transfected with shPD-L2 or shNC lentivirus, following evaluation of PD-L2 expression by western blotting and real-time PCR. d Cell proliferation of KHOS and U2OS cells in response to PD-L2 knockdown determined by cell colony formation assay. e Cell viability of KHOS and U2OS cells after PD-L2 knockdown assayed by CCK-8. All experiments were repeated three times. Data are presented as the mean +- SD. * P < 0.05, ** P < 0.01, *** P < 0.001
- Conjugate
- Yellow dye
- Submitted by
- Invitrogen Antibodies (provider)
- Main image
- Experimental details
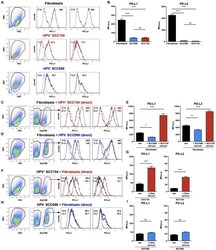
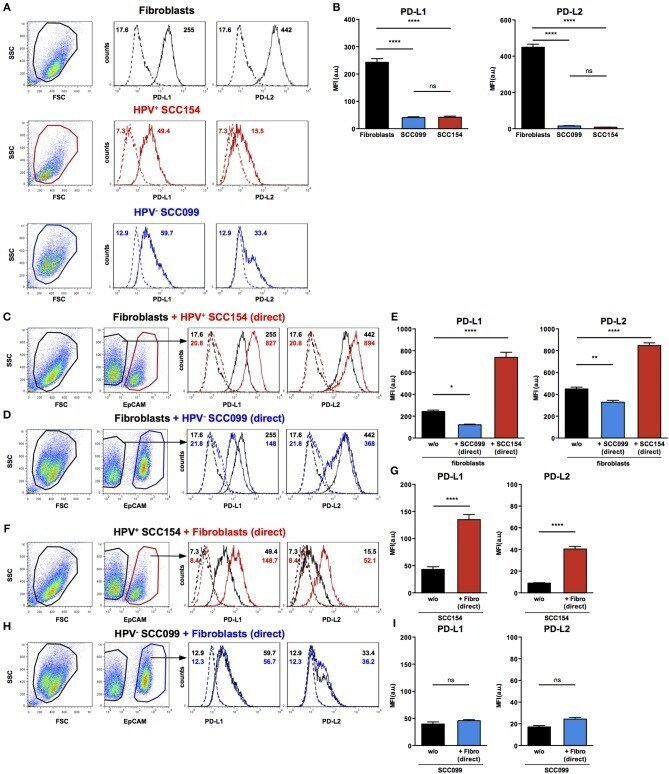
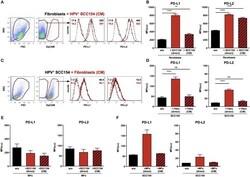
- Figure 3 HPV-positive HNSCCs increase PD-L1 and PD-L2 on fibroblasts. PD-L1 and PD-L2 expression on primary BJ human fibroblasts, HPV-positive (SCC154), and HPV-negative (SCC099) HNSCC cell lines (HNSCCs) was detected by flow cytometry. Illustrative histograms show PD-L1 and PD-L2 expression on fibroblasts (black histograms), HPV-positive (red histograms), or HPV-negative (blue histograms) HNSCCs (A) . Graphs show PD-L1 and PD-L2 expression (mean +- SEM; n = 5) in fibroblasts, HPV-positive, and HPV-negative HNSCCs (B) . Fibroblasts were cultured alone or co-cultured in direct contact (direct) with HPV-positive (SCC154) or HPV-negative (SCC099) HNSCCs. Fibroblasts were identified in co-cultures by lack of EpCAM expression. Illustrative histograms show PD-L1 and PD-L2 expression on fibroblasts cultured alone (black histograms) or co-cultured directly with HPV-positive SCC154 ( C ; red histograms) or HPV-negative SCC099 ( D ; blue histograms). Graphs show PD-L1 and PD-L2 expression (mean +- SEM; n = 5) on fibroblasts cultured alone (w/o) or co-cultured directly with HNSCC cells (E) . HPV-positive (SCC154) or HPV-negative (SCC099) HNSCCs were cultured alone or co-cultured in direct contact (direct) with fibroblasts. HNSCCs were identified in co-cultures by EpCAM expression. Illustrative histograms show PD-L1 and PD-L2 expression on HPV-positive SCC154 cultured alone (black histograms) or co-cultured directly with fibroblasts ( F ; red histograms). Graphs show PD-L1 and PD-
- Conjugate
- Yellow dye
- Submitted by
- Invitrogen Antibodies (provider)
- Main image
- Experimental details
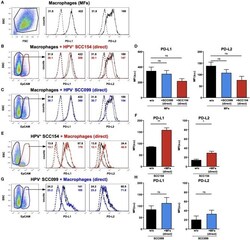
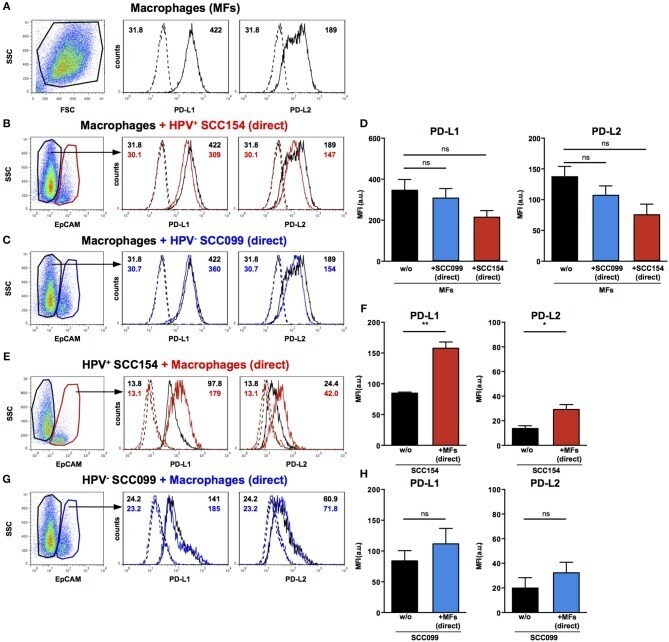
- Figure 4 PD-L1 and PD-L2 expression in co-cultures of macrophages and HPV-positive or HPV-negative HNSCCs. Macrophages were cultured alone (w/o) or co-cultured in direct contact (direct) with HPV-positive (SCC154) or HPV-negative (SCC099) HNSCC cell lines (HNSCCs). Illustrative histograms show PD-L1 and PD-L2 expression on macrophages cultured alone ( A ; black histograms). Macrophages were identified in co-cultures by lack of EpCAM expression. Illustrative histograms show PD-L1 and PD-L2 expression on macrophages cultured alone (black histograms) or co-cultured directly with HPV-positive SCC154 ( B ; red histograms) or HPV-negative SCC099 ( C ; blue histograms). Graphs show PD-L1 and PD-L2 expression (mean +- SEM; n = 4) on macrophages cultured alone (w/o) or co-cultured directly with HNSCCs (D) . HPV-positive (SCC154) or HPV-negative (SCC099) HNSCCs were cultured alone or co-cultured in direct contact (direct) with macrophages. HNSCCs were identified in co-cultures by EpCAM expression. Illustrative histograms show PD-L1 and PD-L2 expression on HPV-positive SCC154 cultured alone (black histograms) or co-cultured directly with macrophages ( E ; red histograms). Graphs show PD-L1 and PD-L2 expression (mean +- SEM; n = 3) on HPV-positive SCC154 cultured alone or co-cultured directly with macrophages (F) . Illustrative histograms show PD-L1 and PD-L2 expression on HPV-negative SCC099 cultured alone (black histograms) or co-cultured directly with macrophages ( G ; blue hist
- Conjugate
- Yellow dye
- Submitted by
- Invitrogen Antibodies (provider)
- Main image
- Experimental details
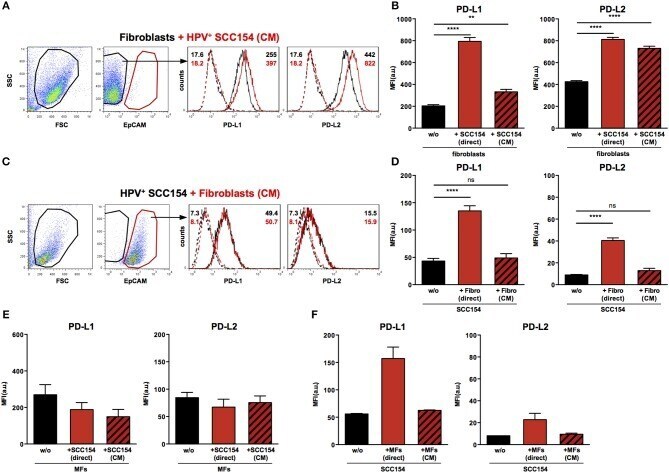
- Figure 5 Conditioned medium from HPV-positive HNSCCs up-regulates PD-L1 and PD-L2 on fibroblasts. Fibroblasts were cultured alone or co-cultured in direct contact with HPV-positive SCC154 (direct) or with conditioned medium from HPV-positive SCC154 (CM). Illustrative histograms show PD-L1 and PD-L2 expression on fibroblasts cultured alone (black histograms) or co-cultured with conditioned medium from HPV-positive SCC154 ( A ; red histograms). Graphs show PD-L1 and PD-L2 expression (mean +- SEM; n = 13) on fibroblasts cultured alone (w/o), co-cultured directly with HPV-positive SCC154 (direct) or with conditioned medium from HPV-positive SCC154 (CM) (B) . HPV-positive (SCC154) HNSCCs were cultured alone or co-cultured in direct contact with fibroblasts (Fibro direct) or with conditioned medium from fibroblasts (Fibro CM). Illustrative histograms show PD-L1 and PD-L2 expression on HPV-positive SCC154 cultured alone (black histograms) or co-cultured with conditioned medium from fibroblasts ( C ; red histograms). Graphs show PD-L1 and PD-L2 expression (mean +- SEM; n = 4) on HPV-positive SCC154 cultured alone (w/o), co-cultured directly with fibroblasts (Fibro direct) or with conditioned medium from fibroblasts (Fibro CM) (D) . Macrophages were cultured alone (w/o) or co-cultured in direct contact with HPV-positive SCC154 (direct) or with conditioned medium from HPV-positive SCC154 (CM). Graphs show PD-L1 and PD-L2 expression (mean +- SEM; n = 3) on macrophages for the in
- Conjugate
- Yellow dye
- Submitted by
- Invitrogen Antibodies (provider)
- Main image
- Experimental details
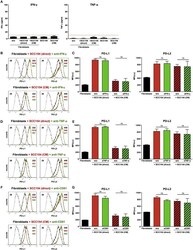
- Figure 6 Blockade of IFN-gamma, TNF-alpha, or CD81 does not affect PD-L1 and PD-L2 up-regulation by HPV-positive HNSCCs. Fibroblasts were cultured alone (w/o) or co-cultured in direct contact with HPV-positive SCC154 (SCC154 direct) or with conditioned medium from HPV-positive SCC154 (SCC154 CM) as indicated. Graphs (A) show IFN-gamma and TNF-alpha levels in culture supernatants (mean +- SEM; n = 4). The dashed red line indicates the lowest value (15.6 pg/ml) of the dynamic range for the ELISA assays used. Neutralizing antibodies anti-IFN-gamma (B,C) , anti-TNF-alpha (D,E) , or anti-CD81 (F,G) were added to the cultures as indicated. Illustrative histograms show PD-L1 and PD-L2 expression on fibroblasts cultured alone (black histograms), co-cultured directly with HPV-positive SCC154 or with conditioned medium from HPV-positive SCC154 alone (red histograms) or in the presence of blocking antibodies (green histograms). Graphs show PD-L1 and PD-L2 expression (mean +- SEM; n = 3) on fibroblasts for the indicated treatments. ns, not significant (one-way ANOVA with Bonferroni correction for multiple comparisons) Numbers adjacent to plots represent MFI values; dashed histograms show control staining with isotype-matched antibodies. MFI, mean fluorescence intensity.
- Conjugate
- Yellow dye

- Submitted by
- Invitrogen Antibodies (provider)
- Main image

- Experimental details
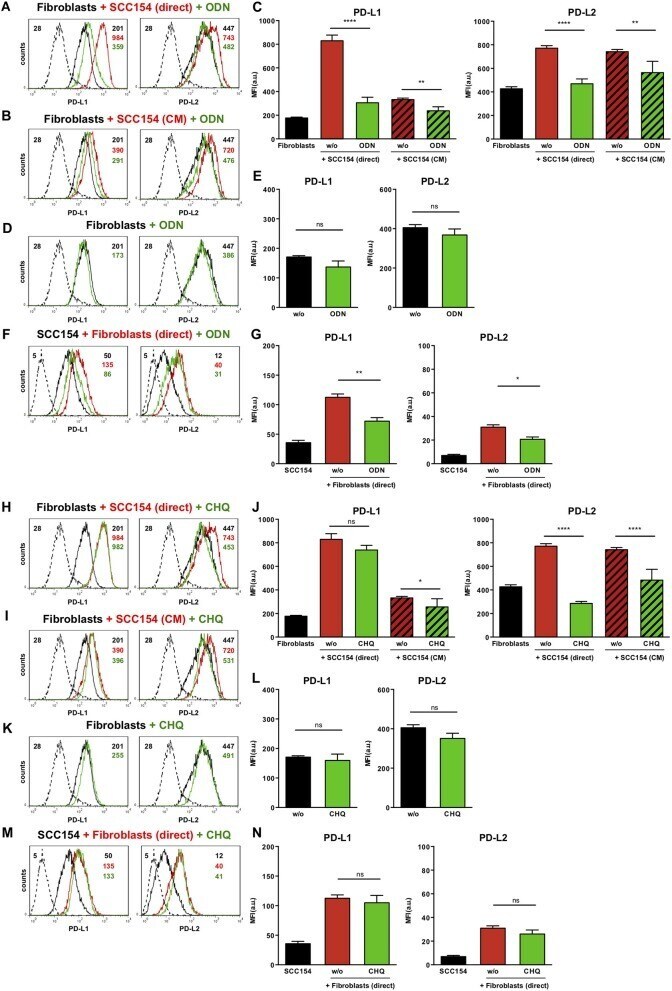
- Figure 7 The TLR9 antagonists ODN TTAGGG and chloroquine inhibit PD-1 ligands up-regulation on fibroblasts co-cultured with HPV-positive HNSCCs. Fibroblasts were cultured alone (w/o) or co-cultured in direct contact with HPV-positive SCC154 (SCC154 direct) or with conditioned medium from HPV-positive SCC154 (SCC154 CM) in the presence or absence of the TLR9 antagonists ODN TTAGGG (ODN) or chloroquine (CHQ). Illustrative histograms show PD-L1 and PD-L2 expression on fibroblasts cultured alone (black histograms), co-cultured directly with HPV-positive SCC154 (red histograms) or co-cultured directly with HPV-positive SCC154 in the presence of ODN (A) or CHQ (H) (green histograms). Illustrative histograms show PD-L1 and PD-L2 expression on fibroblasts cultured alone (black histograms), cultured with conditioned medium from HPV-positive SCC154 (red histograms) or with conditioned medium from HPV-positive SCC154 in the presence of ODN (B) or CHQ (I) (green histograms). Graphs show PD-L1 and PD-L2 expression (mean +- SEM; n = 6) on fibroblasts for the indicated treatments (C,J) . Illustrative histograms show PD-L1 and PD-L2 expression on fibroblasts cultured alone (black histograms) or in the presence of ODN (D) or CHQ (K) (green histograms). Graphs show PD-L1 and PD-L2 expression (mean +- SEM; n = 4) on fibroblasts for the indicated treatments (E,L) . HPV-positive SCC154 were cultured alone or co-cultured in direct contact (direct) with fibroblasts in the presence
- Conjugate
- Yellow dye