Explore
 Validate
 Learn
Learn17-5888-42
antibody from Invitrogen Antibodies
Targeting: PDCD1LG2
B7-DC, bA574F11.2, Btdc, CD273, PD-L2, PDL2
 Flow cytometry
Antibody data
- Antibody Data
- Antigen structure
- References [11]
- Comments [0]
- Validations
- Flow cytometry [2]
- Other assay [9]
Submit
Validation data
Reference
Comment
Report error
- Product number
- 17-5888-42 - Provider product page

- Provider
- Invitrogen Antibodies
- Product name
- CD273 (B7-DC) Monoclonal Antibody (MIH18), APC, eBioscience™
- Antibody type
- Monoclonal
- Antigen
- Other
- Description
- Description: The MIH18 monoclonal antibody reacts with human CD273, also known as PD-L2 or B7-DC, a member of the B7 family that has a predicted molecular weight of approximately 25 kDa, and belongs to the Ig superfamily. B7-DC is primarily expressed by subpopulations of dendritic cells and monocytes/macrophages. Although B7-DC has structural and sequence similarities to the B7 family, it does not bind CD28/CTLA-4, rather it is a ligand for PD-1. The interactions between PD-1 and B7-DC/PD-L2 have been reported to be involved in costimulation or suppression of T cell proliferation depending on state of cellular activation. MIH18 is a useful tool for studies to elucidate the exact function of B7-DC/PD-L2 in APC/T cell interaction, and to characterize the expression pattern of this molecule in humans. MIH18 is a blocking antibody. Applications Reported: This MIH18 antibody has been reported for use in flow cytometric analysis. Applications Tested: This MIH18 antibody has been pre-titrated and tested by flow cytometric analysis of human monocyte-derived dendritic cells. This can be used at 5 µL (0.125 µg) per test. A test is defined as the amount (µg) of antibody that will stain a cell sample in a final volume of 100 µL. Cell number should be determined empirically but can range from 10^5 to 10^8 cells/test. Excitation: 633-647 nm; Emission: 660 nm; Laser: Red Laser. Filtration: 0.2 µm post-manufacturing filtered.
- Reactivity
- Human
- Host
- Mouse
- Isotype
- IgG
- Antibody clone number
- MIH18
- Vial size
- 100 Tests
- Concentration
- 5 μL/Test
- Storage
- 4°C, store in dark, DO NOT FREEZE!
Submitted references EGCG Inhibits Tumor Growth in Melanoma by Targeting JAK-STAT Signaling and Its Downstream PD-L1/PD-L2-PD1 Axis in Tumors and Enhancing Cytotoxic T-Cell Responses.
TLR9 Mediated Tumor-Stroma Interactions in Human Papilloma Virus (HPV)-Positive Head and Neck Squamous Cell Carcinoma Up-Regulate PD-L1 and PD-L2.
Osteosarcoma cell intrinsic PD-L2 signals promote invasion and metastasis via the RhoA-ROCK-LIMK2 and autophagy pathways.
PD-1 axis expression in musculoskeletal tumors and antitumor effect of nivolumab in osteosarcoma model of humanized mouse.
Similarities and differences between helminth parasites and cancer cell lines in shaping human monocytes: Insights into parallel mechanisms of immune evasion.
Mesenchymal Stromal Cell Secretion of Programmed Death-1 Ligands Regulates T Cell Mediated Immunosuppression.
Human CAR T cells with cell-intrinsic PD-1 checkpoint blockade resist tumor-mediated inhibition.
Mesenchymal Stem Cells Reduce Murine Atherosclerosis Development.
PD-1 is a regulator of NY-ESO-1-specific CD8+ T cell expansion in melanoma patients.
No evidence for dualism in function and receptors: PD-L2/B7-DC is an inhibitory regulator of human T cell activation.
The expression of B7-H1 on keratinocytes in chronic inflammatory mucocutaneous disease and its regulatory role.
Ravindran Menon D, Li Y, Yamauchi T, Osborne DG, Vaddi PK, Wempe MF, Zhai Z, Fujita M
Pharmaceuticals (Basel, Switzerland) 2021 Oct 26;14(11)
Pharmaceuticals (Basel, Switzerland) 2021 Oct 26;14(11)
TLR9 Mediated Tumor-Stroma Interactions in Human Papilloma Virus (HPV)-Positive Head and Neck Squamous Cell Carcinoma Up-Regulate PD-L1 and PD-L2.
Baruah P, Bullenkamp J, Wilson POG, Lee M, Kaski JC, Dumitriu IE
Frontiers in immunology 2019;10:1644
Frontiers in immunology 2019;10:1644
Osteosarcoma cell intrinsic PD-L2 signals promote invasion and metastasis via the RhoA-ROCK-LIMK2 and autophagy pathways.
Ren T, Zheng B, Huang Y, Wang S, Bao X, Liu K, Guo W
Cell death & disease 2019 Mar 18;10(4):261
Cell death & disease 2019 Mar 18;10(4):261
PD-1 axis expression in musculoskeletal tumors and antitumor effect of nivolumab in osteosarcoma model of humanized mouse.
Zheng B, Ren T, Huang Y, Sun K, Wang S, Bao X, Liu K, Guo W
Journal of hematology & oncology 2018 Feb 6;11(1):16
Journal of hematology & oncology 2018 Feb 6;11(1):16
Similarities and differences between helminth parasites and cancer cell lines in shaping human monocytes: Insights into parallel mechanisms of immune evasion.
Narasimhan PB, Akabas L, Tariq S, Huda N, Bennuru S, Sabzevari H, Hofmeister R, Nutman TB, Tolouei Semnani R
PLoS neglected tropical diseases 2018 Apr;12(4):e0006404
PLoS neglected tropical diseases 2018 Apr;12(4):e0006404
Mesenchymal Stromal Cell Secretion of Programmed Death-1 Ligands Regulates T Cell Mediated Immunosuppression.
Davies LC, Heldring N, Kadri N, Le Blanc K
Stem cells (Dayton, Ohio) 2017 Mar;35(3):766-776
Stem cells (Dayton, Ohio) 2017 Mar;35(3):766-776
Human CAR T cells with cell-intrinsic PD-1 checkpoint blockade resist tumor-mediated inhibition.
Cherkassky L, Morello A, Villena-Vargas J, Feng Y, Dimitrov DS, Jones DR, Sadelain M, Adusumilli PS
The Journal of clinical investigation 2016 Aug 1;126(8):3130-44
The Journal of clinical investigation 2016 Aug 1;126(8):3130-44
Mesenchymal Stem Cells Reduce Murine Atherosclerosis Development.
Frodermann V, van Duijn J, van Pel M, van Santbrink PJ, Bot I, Kuiper J, de Jager SC
Scientific reports 2015 Oct 22;5:15559
Scientific reports 2015 Oct 22;5:15559
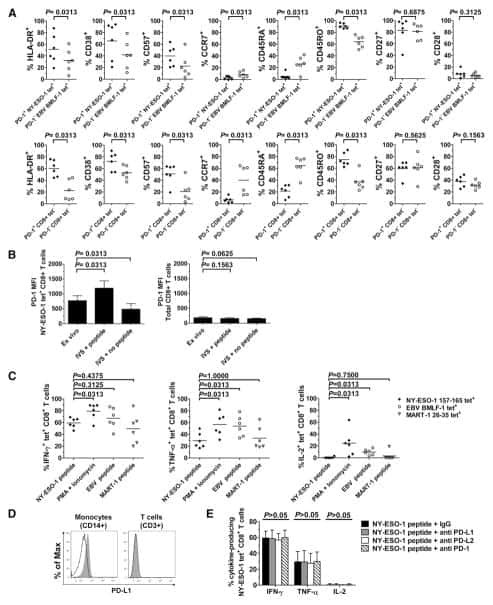
PD-1 is a regulator of NY-ESO-1-specific CD8+ T cell expansion in melanoma patients.
Fourcade J, Kudela P, Sun Z, Shen H, Land SR, Lenzner D, Guillaume P, Luescher IF, Sander C, Ferrone S, Kirkwood JM, Zarour HM
Journal of immunology (Baltimore, Md. : 1950) 2009 May 1;182(9):5240-9
Journal of immunology (Baltimore, Md. : 1950) 2009 May 1;182(9):5240-9
No evidence for dualism in function and receptors: PD-L2/B7-DC is an inhibitory regulator of human T cell activation.
Pfistershammer K, Klauser C, Pickl WF, Stöckl J, Leitner J, Zlabinger G, Majdic O, Steinberger P
European journal of immunology 2006 May;36(5):1104-13
European journal of immunology 2006 May;36(5):1104-13
The expression of B7-H1 on keratinocytes in chronic inflammatory mucocutaneous disease and its regulatory role.
Youngnak-Piboonratanakit P, Tsushima F, Otsuki N, Igarashi H, Machida U, Iwai H, Takahashi Y, Omura K, Yokozeki H, Azuma M
Immunology letters 2004 Jul 15;94(3):215-22
Immunology letters 2004 Jul 15;94(3):215-22
No comments: Submit comment
Supportive validation
- Submitted by
- Invitrogen Antibodies (provider)
- Main image
- Experimental details
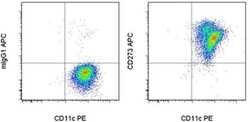
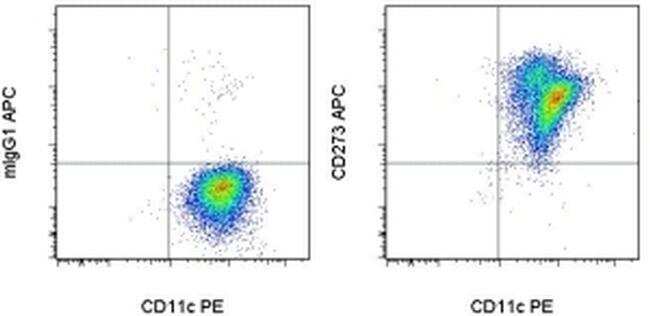
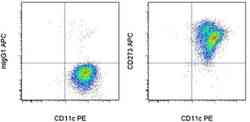
- Staining of human monocyte-derived dendritic cells with Anti-Human CD11c PE (Product # 12-0116-42) and Anti-Mouse IgG1 APC (Product # 17-4015-82) (left) or Anti-Human CD273 (B7-DC) APC (right). Cells in the large scatter population were used for analysis.
- Submitted by
- Invitrogen Antibodies (provider)
- Main image
- Experimental details
- Staining of human monocyte-derived dendritic cells with Anti-Human CD11c PE (Product # 12-0116-42) and Anti-Mouse IgG1 APC (Product # 17-4015-82) (left) or Anti-Human CD273 (B7-DC) APC (right). Cells in the large scatter population were used for analysis.

Supportive validation
- Submitted by
- Invitrogen Antibodies (provider)
- Main image
- Experimental details
- NULL

- Submitted by
- Invitrogen Antibodies (provider)
- Main image

- Experimental details
- NULL
- Submitted by
- Invitrogen Antibodies (provider)
- Main image
- Experimental details
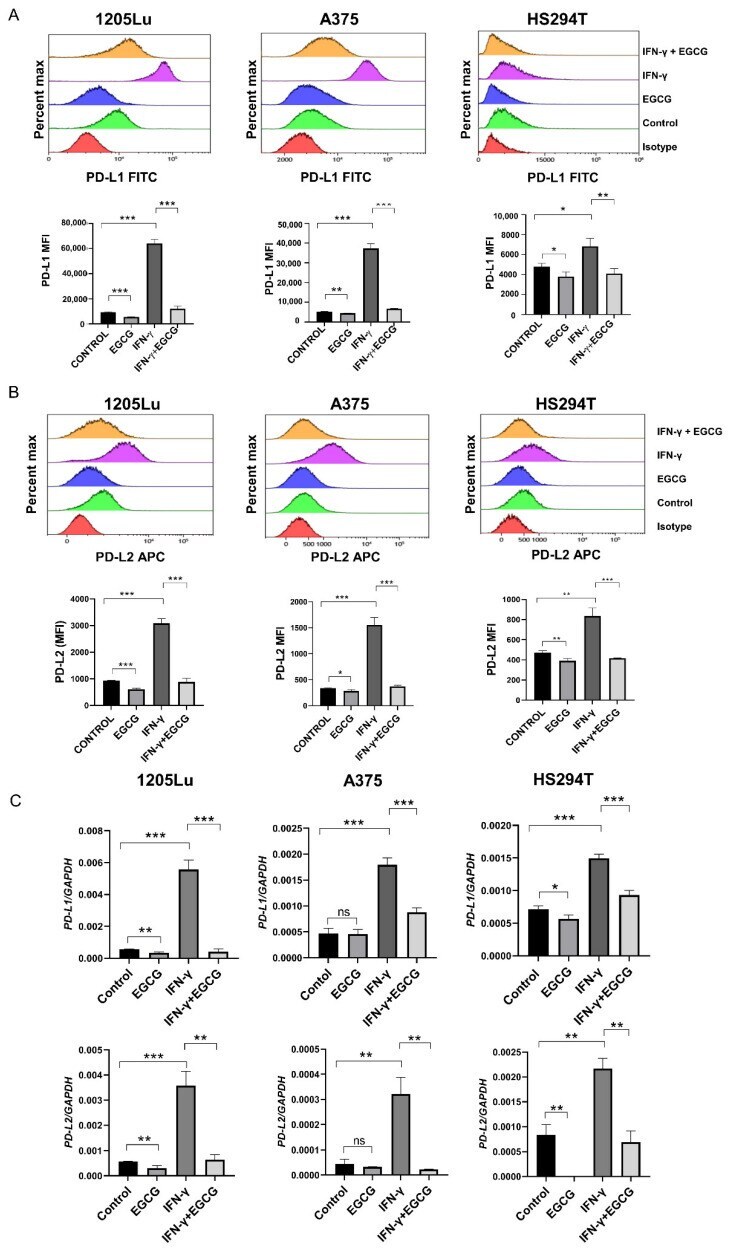
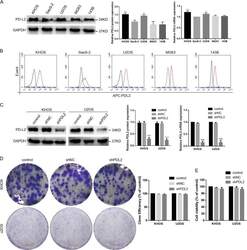
- Figure 1 EGCG downregulated IFN-gamma induced PD-L1/PD-L2 expression. ( A , B ) Flow cytometry data depicting the cell surface expression of PD-L1 ( A ) and PD-L2 ( B ) in 1205Lu, A375 and HS294T cells. Histogram (upper panel) and quantification of mean fluorescent intensity (MFI) (lower panel) of cells with 0.1% DMSO (control), 10 uM EGCG (EGCG), 10 ng/mL IFN-gamma (IFN-gamma) or a combination of IFN-gamma and EGCG (IFN-gamma + EGCG). ( C ) qRT-PCR analysis of PD-L1 (upper panel) and PD-L2 (lower panel) after treatment with 0.1% DMSO (control), 10 uM EGCG (EGCG), 10 ng/mL IFN-gamma (IFN-gamma) or a combination of IFN-gamma and EGCG (IFN-gamma + EGCG). GAPDH served as a control. Data are representative of 2 independent experiments and expressed as the mean +- S.D., n = 3 ns, p > 0.05; * p < 0.05; ** p < 0.01; *** p < 0.001.
- Submitted by
- Invitrogen Antibodies (provider)
- Main image
- Experimental details
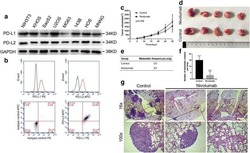
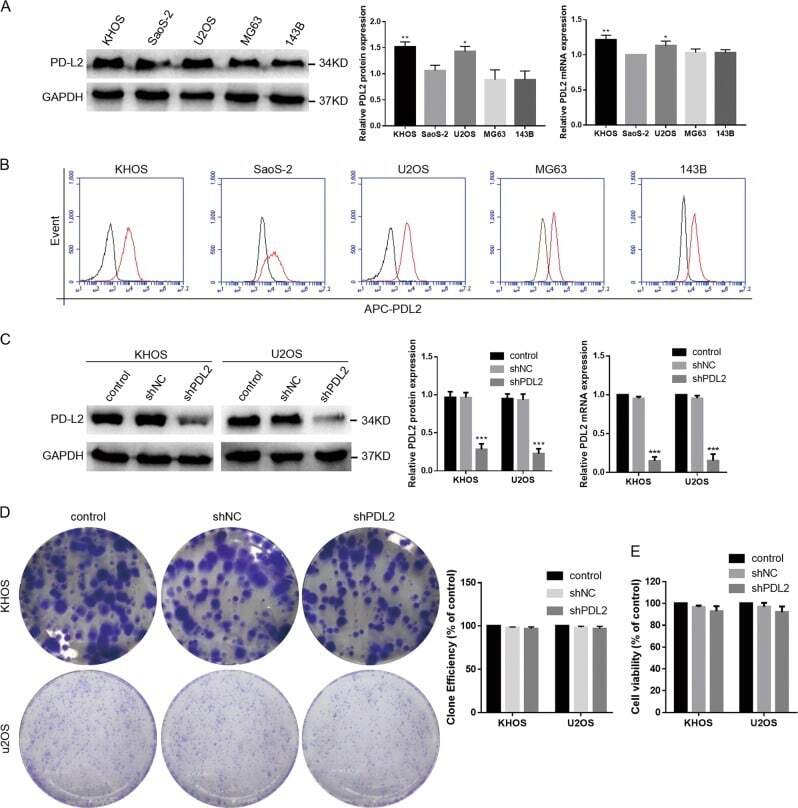
- Fig. 2 Effect of PD-L2 expression on the proliferation of osteosarcoma cells. a PD-L2 expression in osteosarcoma cell lines was evaluated by western blotting and real-time PCR. b The osteosarcoma cell lines (red) exhibited differing degrees of PD-L2 expression compared with the isotype control (black) by flow cytometry. c KHOS and U2OS cells were stably transfected with shPD-L2 or shNC lentivirus, following evaluation of PD-L2 expression by western blotting and real-time PCR. d Cell proliferation of KHOS and U2OS cells in response to PD-L2 knockdown determined by cell colony formation assay. e Cell viability of KHOS and U2OS cells after PD-L2 knockdown assayed by CCK-8. All experiments were repeated three times. Data are presented as the mean +- SD. * P < 0.05, ** P < 0.01, *** P < 0.001
- Submitted by
- Invitrogen Antibodies (provider)
- Main image
- Experimental details
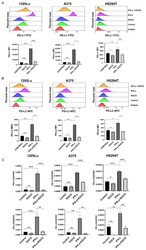
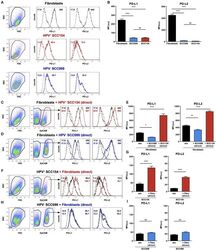
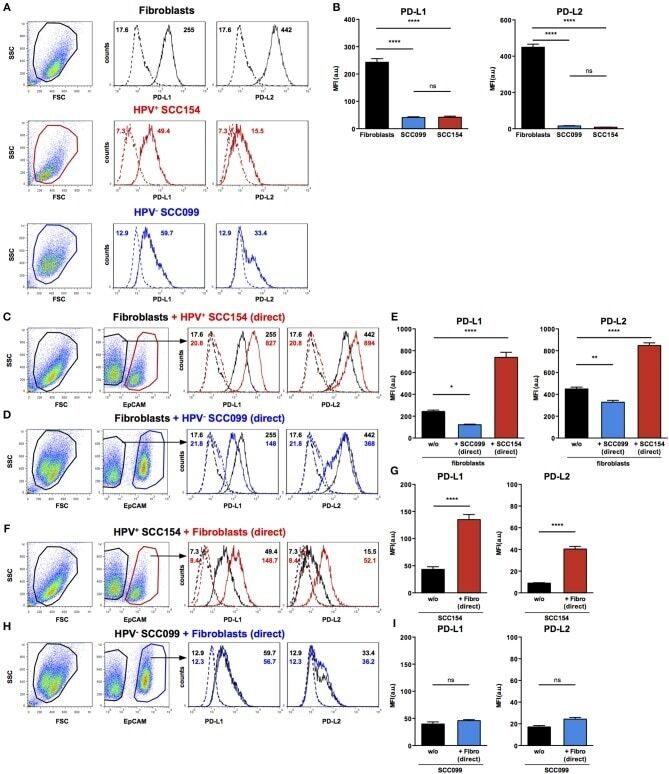
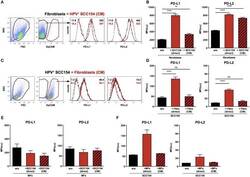
- Figure 3 HPV-positive HNSCCs increase PD-L1 and PD-L2 on fibroblasts. PD-L1 and PD-L2 expression on primary BJ human fibroblasts, HPV-positive (SCC154), and HPV-negative (SCC099) HNSCC cell lines (HNSCCs) was detected by flow cytometry. Illustrative histograms show PD-L1 and PD-L2 expression on fibroblasts (black histograms), HPV-positive (red histograms), or HPV-negative (blue histograms) HNSCCs (A) . Graphs show PD-L1 and PD-L2 expression (mean +- SEM; n = 5) in fibroblasts, HPV-positive, and HPV-negative HNSCCs (B) . Fibroblasts were cultured alone or co-cultured in direct contact (direct) with HPV-positive (SCC154) or HPV-negative (SCC099) HNSCCs. Fibroblasts were identified in co-cultures by lack of EpCAM expression. Illustrative histograms show PD-L1 and PD-L2 expression on fibroblasts cultured alone (black histograms) or co-cultured directly with HPV-positive SCC154 ( C ; red histograms) or HPV-negative SCC099 ( D ; blue histograms). Graphs show PD-L1 and PD-L2 expression (mean +- SEM; n = 5) on fibroblasts cultured alone (w/o) or co-cultured directly with HNSCC cells (E) . HPV-positive (SCC154) or HPV-negative (SCC099) HNSCCs were cultured alone or co-cultured in direct contact (direct) with fibroblasts. HNSCCs were identified in co-cultures by EpCAM expression. Illustrative histograms show PD-L1 and PD-L2 expression on HPV-positive SCC154 cultured alone (black histograms) or co-cultured directly with fibroblasts ( F ; red histograms). Graphs show PD-L1 and PD-
- Submitted by
- Invitrogen Antibodies (provider)
- Main image
- Experimental details
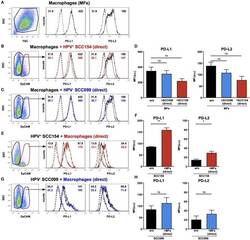
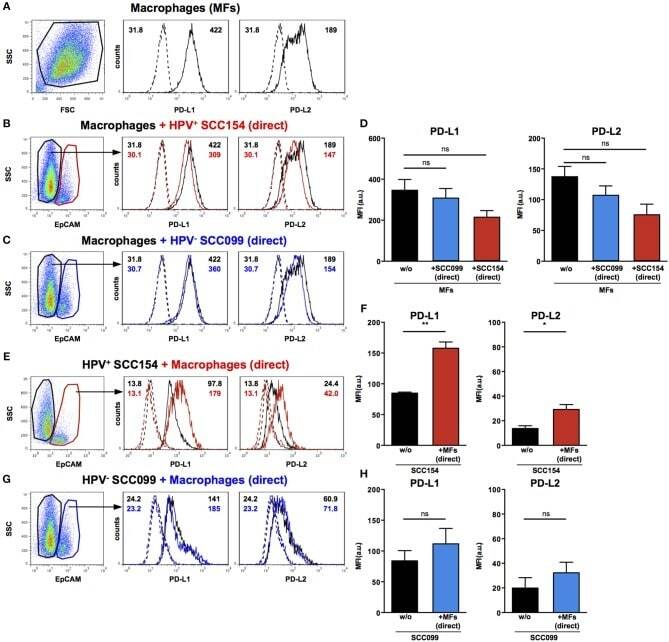
- Figure 4 PD-L1 and PD-L2 expression in co-cultures of macrophages and HPV-positive or HPV-negative HNSCCs. Macrophages were cultured alone (w/o) or co-cultured in direct contact (direct) with HPV-positive (SCC154) or HPV-negative (SCC099) HNSCC cell lines (HNSCCs). Illustrative histograms show PD-L1 and PD-L2 expression on macrophages cultured alone ( A ; black histograms). Macrophages were identified in co-cultures by lack of EpCAM expression. Illustrative histograms show PD-L1 and PD-L2 expression on macrophages cultured alone (black histograms) or co-cultured directly with HPV-positive SCC154 ( B ; red histograms) or HPV-negative SCC099 ( C ; blue histograms). Graphs show PD-L1 and PD-L2 expression (mean +- SEM; n = 4) on macrophages cultured alone (w/o) or co-cultured directly with HNSCCs (D) . HPV-positive (SCC154) or HPV-negative (SCC099) HNSCCs were cultured alone or co-cultured in direct contact (direct) with macrophages. HNSCCs were identified in co-cultures by EpCAM expression. Illustrative histograms show PD-L1 and PD-L2 expression on HPV-positive SCC154 cultured alone (black histograms) or co-cultured directly with macrophages ( E ; red histograms). Graphs show PD-L1 and PD-L2 expression (mean +- SEM; n = 3) on HPV-positive SCC154 cultured alone or co-cultured directly with macrophages (F) . Illustrative histograms show PD-L1 and PD-L2 expression on HPV-negative SCC099 cultured alone (black histograms) or co-cultured directly with macrophages ( G ; blue hist
- Submitted by
- Invitrogen Antibodies (provider)
- Main image
- Experimental details
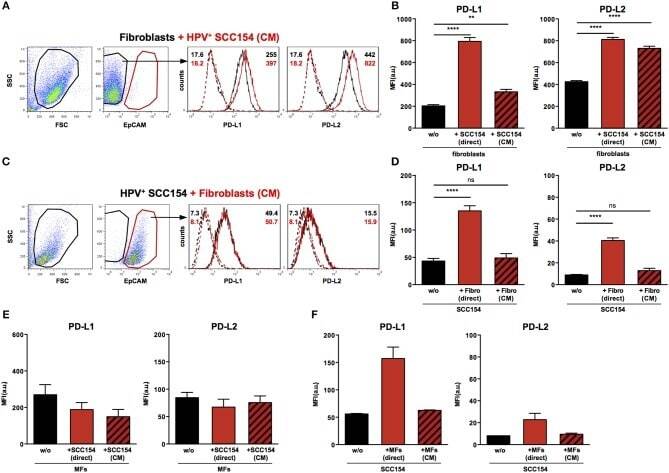
- Figure 5 Conditioned medium from HPV-positive HNSCCs up-regulates PD-L1 and PD-L2 on fibroblasts. Fibroblasts were cultured alone or co-cultured in direct contact with HPV-positive SCC154 (direct) or with conditioned medium from HPV-positive SCC154 (CM). Illustrative histograms show PD-L1 and PD-L2 expression on fibroblasts cultured alone (black histograms) or co-cultured with conditioned medium from HPV-positive SCC154 ( A ; red histograms). Graphs show PD-L1 and PD-L2 expression (mean +- SEM; n = 13) on fibroblasts cultured alone (w/o), co-cultured directly with HPV-positive SCC154 (direct) or with conditioned medium from HPV-positive SCC154 (CM) (B) . HPV-positive (SCC154) HNSCCs were cultured alone or co-cultured in direct contact with fibroblasts (Fibro direct) or with conditioned medium from fibroblasts (Fibro CM). Illustrative histograms show PD-L1 and PD-L2 expression on HPV-positive SCC154 cultured alone (black histograms) or co-cultured with conditioned medium from fibroblasts ( C ; red histograms). Graphs show PD-L1 and PD-L2 expression (mean +- SEM; n = 4) on HPV-positive SCC154 cultured alone (w/o), co-cultured directly with fibroblasts (Fibro direct) or with conditioned medium from fibroblasts (Fibro CM) (D) . Macrophages were cultured alone (w/o) or co-cultured in direct contact with HPV-positive SCC154 (direct) or with conditioned medium from HPV-positive SCC154 (CM). Graphs show PD-L1 and PD-L2 expression (mean +- SEM; n = 3) on macrophages for the in
- Submitted by
- Invitrogen Antibodies (provider)
- Main image
- Experimental details
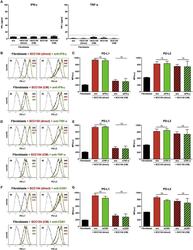
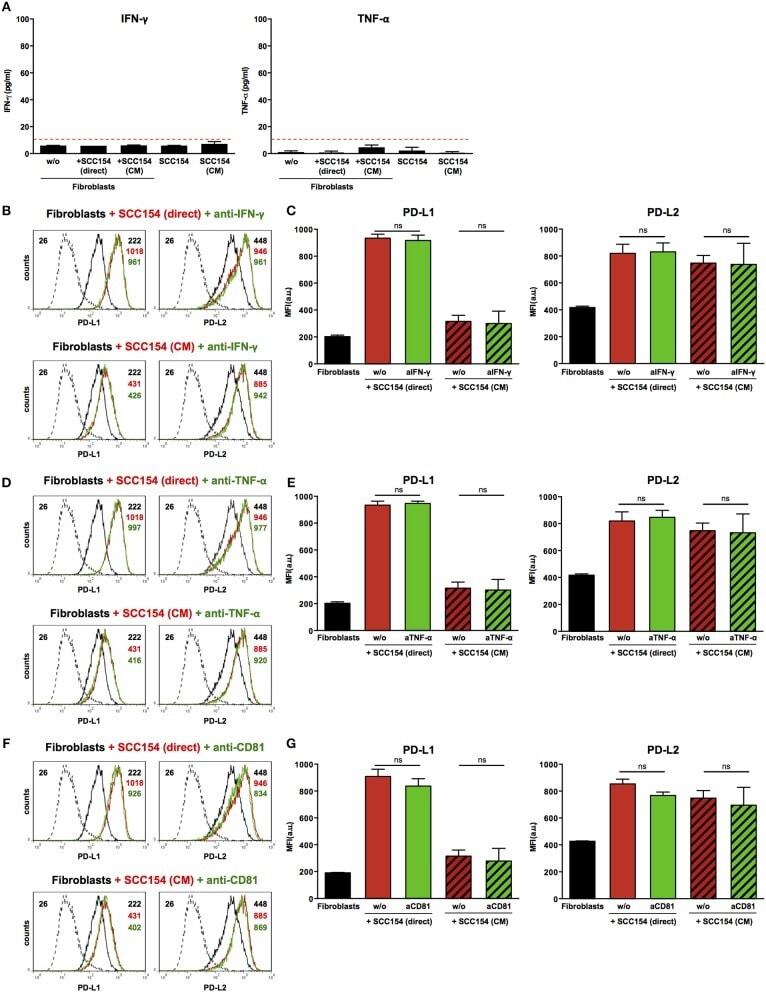
- Figure 6 Blockade of IFN-gamma, TNF-alpha, or CD81 does not affect PD-L1 and PD-L2 up-regulation by HPV-positive HNSCCs. Fibroblasts were cultured alone (w/o) or co-cultured in direct contact with HPV-positive SCC154 (SCC154 direct) or with conditioned medium from HPV-positive SCC154 (SCC154 CM) as indicated. Graphs (A) show IFN-gamma and TNF-alpha levels in culture supernatants (mean +- SEM; n = 4). The dashed red line indicates the lowest value (15.6 pg/ml) of the dynamic range for the ELISA assays used. Neutralizing antibodies anti-IFN-gamma (B,C) , anti-TNF-alpha (D,E) , or anti-CD81 (F,G) were added to the cultures as indicated. Illustrative histograms show PD-L1 and PD-L2 expression on fibroblasts cultured alone (black histograms), co-cultured directly with HPV-positive SCC154 or with conditioned medium from HPV-positive SCC154 alone (red histograms) or in the presence of blocking antibodies (green histograms). Graphs show PD-L1 and PD-L2 expression (mean +- SEM; n = 3) on fibroblasts for the indicated treatments. ns, not significant (one-way ANOVA with Bonferroni correction for multiple comparisons) Numbers adjacent to plots represent MFI values; dashed histograms show control staining with isotype-matched antibodies. MFI, mean fluorescence intensity.
- Submitted by
- Invitrogen Antibodies (provider)
- Main image
- Experimental details
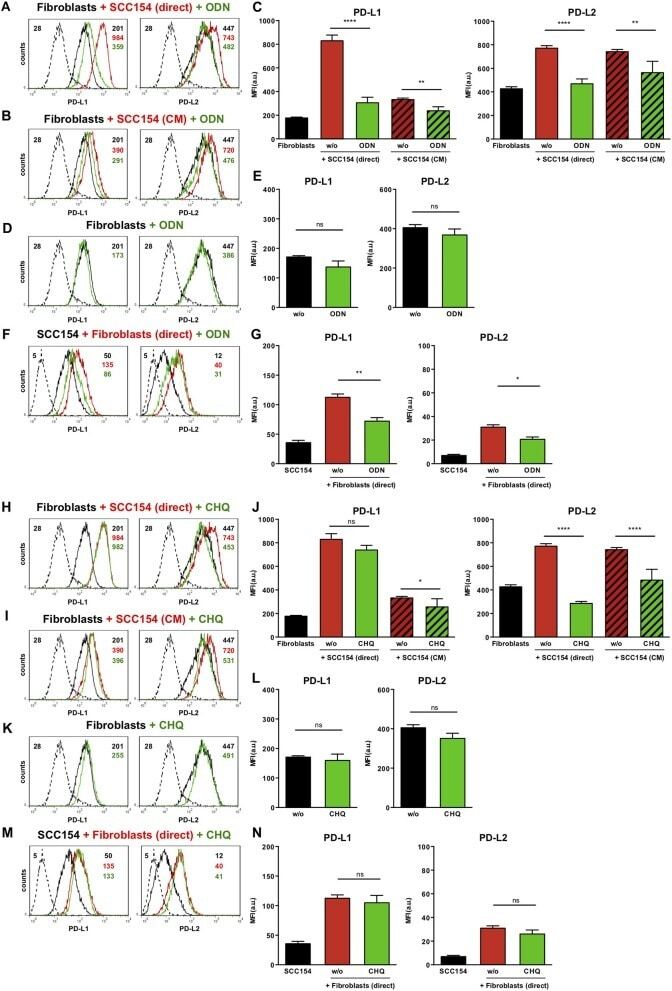
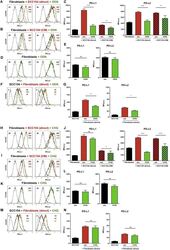
- Figure 7 The TLR9 antagonists ODN TTAGGG and chloroquine inhibit PD-1 ligands up-regulation on fibroblasts co-cultured with HPV-positive HNSCCs. Fibroblasts were cultured alone (w/o) or co-cultured in direct contact with HPV-positive SCC154 (SCC154 direct) or with conditioned medium from HPV-positive SCC154 (SCC154 CM) in the presence or absence of the TLR9 antagonists ODN TTAGGG (ODN) or chloroquine (CHQ). Illustrative histograms show PD-L1 and PD-L2 expression on fibroblasts cultured alone (black histograms), co-cultured directly with HPV-positive SCC154 (red histograms) or co-cultured directly with HPV-positive SCC154 in the presence of ODN (A) or CHQ (H) (green histograms). Illustrative histograms show PD-L1 and PD-L2 expression on fibroblasts cultured alone (black histograms), cultured with conditioned medium from HPV-positive SCC154 (red histograms) or with conditioned medium from HPV-positive SCC154 in the presence of ODN (B) or CHQ (I) (green histograms). Graphs show PD-L1 and PD-L2 expression (mean +- SEM; n = 6) on fibroblasts for the indicated treatments (C,J) . Illustrative histograms show PD-L1 and PD-L2 expression on fibroblasts cultured alone (black histograms) or in the presence of ODN (D) or CHQ (K) (green histograms). Graphs show PD-L1 and PD-L2 expression (mean +- SEM; n = 4) on fibroblasts for the indicated treatments (E,L) . HPV-positive SCC154 were cultured alone or co-cultured in direct contact (direct) with fibroblasts in the presence